HAL Id: hal-00880314
https://hal.inria.fr/hal-00880314
Submitted on 5 Nov 2013
HAL is a multi-disciplinary open access
archive for the deposit and dissemination of
sci-entific research documents, whether they are
pub-lished or not. The documents may come from
teaching and research institutions in France or
abroad, or from public or private research centers.
L’archive ouverte pluridisciplinaire HAL, est
destinée au dépôt et à la diffusion de documents
scientifiques de niveau recherche, publiés ou non,
émanant des établissements d’enseignement et de
recherche français ou étrangers, des laboratoires
publics ou privés.
Predicting SPARQL Query Execution Time and
Suggesting SPARQL Queries Based on Query History
Rakebul Hasan, Fabien Gandon
To cite this version:
Rakebul Hasan, Fabien Gandon. Predicting SPARQL Query Execution Time and Suggesting SPARQL
Queries Based on Query History. [Research Report] RR-8392, Inria. 2013. �hal-00880314�
ISSN 0249-6399 ISRN INRIA/RR--8392--FR+ENG
RESEARCH
REPORT
N° 8392
November 2013 Project-Teams WimmicsPredicting SPARQL
Query Execution Time
and Suggesting SPARQL
Queries Based on Query
History
RESEARCH CENTRE
SOPHIA ANTIPOLIS – MÉDITERRANÉE
2004 route des Lucioles - BP 93 06902 Sophia Antipolis Cedex
Predicting SPARQL Query Execution Time
and Suggesting SPARQL Queries Based on
Query History
Rakebul Hasan, Fabien Gandon
Project-Teams WimmicsResearch Report n° 8392 — November 2013 — 15 pages
Abstract: In this paper first we address the problem of predicting SPARQL query execution time. Accurately predicting query execution time enables effective workload management, query scheduling, and query optimization. We use machine learning techniques to predict SPARQL query execution time. We generate the training dataset from real queries collected from DBPedia 3.8 query logs. As features of a SPARQL query, we use the SPARQL query algebra operators and different basic graph pattern types that we generate by clustering the training SPARQL queries. We achieved high accuracy (coefficient of determination value of 0.84) for predicting query execution time.
Second, we address the problem of suggesting similar SPARQL queries based on query history. Users often need assistance to effectively construct and refine Semantic Web queries. To assist users in constructing and refining SPARQL queries, we provide suggestions of similar queries based on query history. Users can use the suggestions to investigate the similar previous queries and their behaviors.
Pr´
ediction du temps d’ex´
ecution d’une requˆ
ete SPARQL
et suggestion de requˆ
etes sur la base d’un historique
R´esum´e : Dans ce rapport, nous examinons tout d’abord le probl`eme de la pr´ediction du temps d’ex´ecution des requˆetes SPARQL. Pr´edire avec pr´ecision le temps d’ex´ecution des requˆetes permet une gestion efficace de la charge de travail, la planification et l’optimisation des requˆetes. Nous utilisons des techniques d’apprentissage automatique pour pr´edire le temps d’ex´ecution des requˆetes SPARQL. Nous g´en´erons l’ensemble de donn´ees d’apprentissage `a partir de requˆetes r´eelles recueillies dans les logs de DBPedia 3.8. Comme caract´eristiques d’une requˆete SPARQL, nous utilisons les op´erateurs de l’alg`ebre de requˆetes SPARQL et les diff´erents types de motifs de graphes requˆetes que nous g´en´erons par le regroupement des requˆetes SPARQL d’apprentissage. Nous obtenons une pr´ecision ´elev´ee (coefficient de valeur de d´etermination de 0,84) pour pr´edire le temps d’ex´ecution des requˆetes.
Deuxi`emement, les utilisateurs ont souvent besoin d’aide pour construire efficacement et d’affiner les requˆetes au Web s´emantique. Pour aider les utilisateurs `a construire et affiner les requˆetes SPARQL, nous fournissons des suggestions de requˆetes similaires bas´ees sur l’historique des requˆetes. Les utilisateurs peuvent utiliser ces suggestions pour ´etudier les pr´ec´edentes requˆetes similaires et leurs comportements.
Predicting SPARQL Query Execution Time and Suggesting SPARQL Queries 3
Contents
1 Introduction 4
2 Problem Description and Methodology 4
3 Solution Components 5
4 Building a Prediction Model for SPARQL Queries 5
4.1 Model with SPARQL Algebra Features . . . 5
4.2 Model with Additional Basic Graph Pattern Features . . . 8
4.3 Model with Multiple Regressions . . . 10
4.4 k-Nearest Neighbors Regression Model . . . 10
5 Suggesting SPARQL queries 11
6 Related Work 12
7 Conclusion and Future Work 13
4 Hasan & Gandon
1
Introduction
Predicting how a query will behave is important for effective workload management, query scheduling, and query optimization.[6, 7]. As the complexity of the Semantic Web increases, it is becoming increasingly important to develop effective ways of querying the Semantic Web data. Central to this problem is knowing how a query will behave prior to executing the query. This will help us to adjust our queries accordingly. Knowing the history of similar queries will also help in making these adjustments.
In this paper, we first address the problem of predicting SPARQL query execution time. In the previous work in database research[6, 7], researchers have successfully applied machine learning techniques to accurately predict database query performance. Inspired by their success, we use machine learning techniques to predict SPARQL query execution time. A key contribution of our work is transforming SPARQL queries into vector representation necessary for machine learning algorithms.
Previous research [17, 18] suggests that constructing and refining Semantic Web queries is a difficult task especially if the users do not have expert level knowledge of the data and the underlying schema. Users often need assistance in forms of suggestions to effectively construct and refine Semantic Web queries. We use the same vector representation of SPARQL queries to suggest similar SPARQL queries using nearest neighbors search. Users can use these sugges-tions for various purposes including understanding the history of similar query behaviors, and constructing and refining queries.
In section 2 we discuss the problems we address and our research methodology. In section 3 we describe our solution components and experiment configurations. In section 4 we describe the features we use for our solution and explain the experiments we performed for predicting SPARQL query execution time. In section 5 we discuss how we suggest similar SPARQL queries based on query history. In section 6 we describe the related work. Finally, in section 7 we conclude and outline the future work.
2
Problem Description and Methodology
We address two problems in this paper: (i) how to predict SPARQL query execution time prior to query execution; (ii) how to suggest similar SPARQL queries based on query history.
To study query performance, we apply the same scientific approach that scientists use to understand the natural world. Sedgewick and Wayne [15] discuss the application of scientific methods to study running time of computer programs. This approach is motivated by D.E. Knuth’s insight of using scientific methods to understand performance of algorithms. In sum-mary, the scientific method comprises of: (a) observing some features of the natural world; (b) hypothesizing a model consistent with the observation; (c) predicting some events using the hy-pothesis; (d) verifying the predictions by further observations; (e) validating by repeating until the observations and the predictions agree. In addition, the experiments must be reproducible, so that others can validate the hypothesis. Hypotheses must also be falsifiable, so that we know when a hypothesis is wrong. We use this methodology to experimentally study SPARQL query running time. We build the model for suggesting SPARQL queries by reusing the models we build in the experimental study of SPARQL query running time.
Predicting SPARQL Query Execution Time and Suggesting SPARQL Queries 5
3
Solution Components
Our system configuration includes the Jena TDB triple store1, Mac OS X version 10.6.8 operating
system, Intel Core i7 2.7 GHz processor, 8 GB system RAM with 4 GB RAM allocated to Jena TDB. We randomly select 6000 queries from DBPSB (DBpedia SPARQL Benchmark) [10] query log dataset2 containing all queries posed to the official DBpedia SPARQL endpoint from April
to July 2010. We load the DBpedia 3.8 dataset3into our Jena TDB. Then we run the randomly
selected 6000 queries and record their execution times. We choose Jena TDB as the triple store because Jena includes tools to generate the SPARQL query algebra expressions that Jena TDB uses.
Out of the 6000 queries, we use 3600 queries and their execution times as the training dataset (60%), 1200 queries and their execution times as the validation dataset (20%), and 1200 queries and their execution times as the test dataset (20%). In our experiments we use Weka’s [8] implementation of the Support Vector Machine (SVM) regression, x -means clustering, k -nearest neighbors regression, k -dimensional tree; and libsvm [4] implementation of SVM classifier.
4
Building a Prediction Model for SPARQL Queries
The first step to build the prediction model is to represent SPARQL queries as vectors. Then we train our model with the vector representation of our training queries and their execution times. We use the coefficient of determination, denoted as R2, to evaluate our model. R2 is a
widely used evaluation measure for regression. R2 measures how well future samples are likely
to be predicted. R2values range from 0 to 1 where 0 is the worst and 1 is the best score. In this
section, we walk through our experiments and discuss the choices we make.
4.1
Model with SPARQL Algebra Features
The SPARQL query engine of Apache Jena - known as ARQ4 - performs a series of steps to
execute a query. First, parsing the query string into an abstract syntax tree (AST). Next, ARQ transforms the abstract syntax tree to an algebra expression comprising the SPARQL algebra operators5. An algebra expression is also a tree. Finally, ARQ optimizes and evaluates the
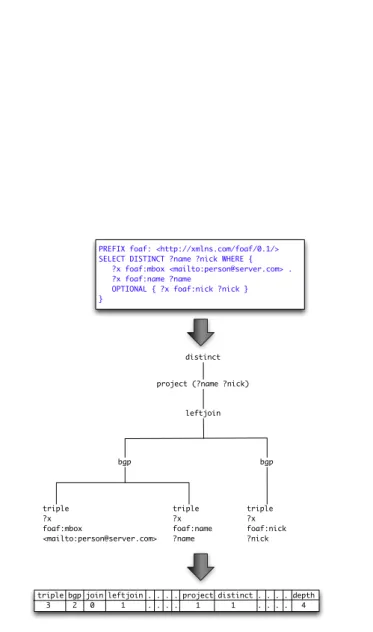
algebra expression on an RDF dataset. We use the SPARQL algebra operators to construct a query feature vector. We use Jena ARQ API to programmatically create SPARQL algebra expressions from SPARQL query strings. For an algebra expression, we use the frequencies of all the SPARQL algebra operators in the algebra expression except the slice operator. Each of these operators represent a dimension in the feature vector. The slice operator is the combi-nation of OFFSET and LIMIT SPARQL keywords. We take the sum of all the slice operator cardinalities appearing in the algebra expression as the value of the dimension that represents the slice operator. We also use the depth of the algebra expression tree as a feature. Figure 1 shows an example of extracting the SPARQL algebra features vector from a SPARQL query.
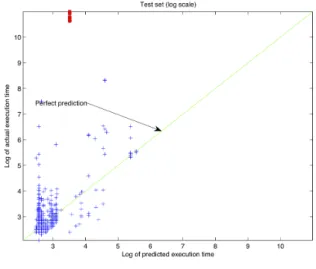
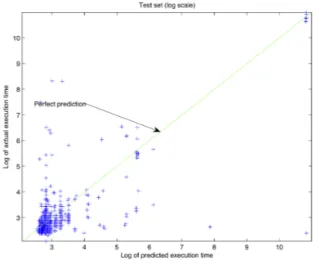
We train a regression variant of the Support Vector Machine (SVM) [16] to test out these SPARQL algebra features. This model performs poorly for our test queries with a low R2 value
of 0.004492. Figure 2 shows the log scale plotting of predicted execution time vs actual execution time for our test queries. We plot them in log scale to account for wide range of execution times
1Jena TDB: http://jena.apache.org/documentation/tdb
2Query log dataset: ftp://download.openlinksw.com/support/dbpedia/
3DBpedia 3.8: http://wiki.dbpedia.org/Datasets3.8
4Overview of ARQ Query Processing http://jena.apache.org/documentation/query/arq-query-eval.html
5SPARQL algebra operators: http://www.w3.org/TR/sparql11-query/#sparqlQuery
6 Hasan & Gandon
distinct project (?name ?nick)
leftjoin bgp bgp triple ?x foaf:mbox <mailto:[email protected]> triple ?x foaf:name ?name triple ?x foaf:nick ?nick
triple bgp join leftjoin . . . . project distinct . . . . depth 3 2 0 1 . . . . 1 1 . . . . 4
PREFIX foaf: <http://xmlns.com/foaf/0.1/> SELECT DISTINCT ?name ?nick WHERE { ?x foaf:mbox <mailto:[email protected]> . ?x foaf:name ?name
OPTIONAL { ?x foaf:nick ?nick } }
Figure 1: Example of extracting SPARQL algebra features vector from a SPARQL query.
Predicting SPARQL Query Execution Time and Suggesting SPARQL Queries 7
in the visualization. The model under-estimates the execution times for queries which have long actual execution time - highlighted in red in figure 2. A large number of queries are far from the perfect prediction line.
Figure 2: Log scale plotting of predicted vs actual execution times for the test queries (test dataset R2 = 0.004492).
Figure 3 compares the predicted vs actual execution times for test queries which have shorter query execution times. In this figure, we plot the execution times without scaling them to log values. Again a large number of queries are far from the perfect prediction line. This means that the predictions by this model are not accurate.
Figure 3: Predicted vs actual execution times for the test queries which have shorter query execution times (test dataset R2= 0.004492).
8 Hasan & Gandon
After observing the long execution time outliers, we found out that many of them share structurally similar basic graph patterns. In our algebra features, we only considered the number of triples in the basic graph patterns appearing the queries. But this does not represent the basic graph patterns themselves. In other words, our algebra features do not represent the basic graph patterns appearing in SPARQL queries. What kind of basic graph pattern appears in a SPARQL query influences the execution time of the query. In subsection 4.2, we discuss how we address this problem.
4.2
Model with Additional Basic Graph Pattern Features
For an RDF graph, there are infinite number of possibilities to write a basic graph pattern. There are infinite number of possibilities for literals values. Even if we consider only the set of literal values and the set of resources appearing in the RDF graph, the number of possibilities to write a basic graph patterns would be exponentially large. More precisely, an RDF graph with a set of n triples has 2n subsets of triples – i.e. the power set. Each of these subsets can be a possible
basic graph pattern. Therefore, transforming basic graph patterns directly to vector space would result in exponentially large number of dimensions.
We represent a basic graph pattern as a vector that is relative to the basic graph patterns in the training data. As the first step of this process, we cluster the structurally similar basic graph patterns in the training data into K clusters. The basic graph pattern in the center of a cluster is the representative basic graph pattern for that cluster. Second, we represent a basic graph pattern as a K dimensional vector where the value of a dimension is the structural similarity between the basic graph pattern and the representative basic graph pattern corresponding to that dimension. We use K = 10 for the experiments in this paper. To compute the structural similarity between two basic graph patterns, we first construct two graphs from the two basic graph patterns, then compute the graph edit distance [3] between these two graphs.
A basic graph pattern in a SPARQL query contains a set of triples. We take the triples in all the basic graph patterns appearing in a SPARQL query and construct an RDF graph from these triple. Then we replace the SPARQL variable labels in the constructed graph by a fixed symbol - the symbol ‘?’. We call such a graph a pattern graph.
The graph edit distance between two graphs is the minimum amount of distortion needed to transform one graph to another. The minimum amount of distortion is the sequence of edit operations with minimum cost. The edit operations are deletions, insertions, and substitutions of nodes and edges. The example from [13] in figure 4 shows a possible edit path to transform graph g1 to graph g2. The edit operations in this path are three edge deletions, one node deletion, one node insertion, two edge insertions, and finally two node substitutions.
Figure 4: A possible edit path to transform graph g1 to graph g2.
A well known method for computing graph edit distance is using the A* search algorithm to explore the state space of possible mappings of the nodes and edges of the source graph to the nodes and edges of the target graph. However, the computational complexity of this edit distance algorithm is exponential in the number of nodes of the involved graphs, irrespective of using A*
Predicting SPARQL Query Execution Time and Suggesting SPARQL Queries 9
search with a heuristic function to govern the tree traversal process. We use the polynomial time suboptimal solution of graph edit distance that Riesen and Bunke [13] propose. We use the implementation of the suboptimal solution of Riesen and Bunke that Riesen et al. [14] later integrated in the Graph Matching Toolkit6.
We use the k -mediods [9] clustering algorithm to cluster the basic graph patterns in training data. We use k -mediods because it chooses data points as centers and uses an arbitrary distance function. We use the suboptimal graph edit distance algorithm as the distance function for k -mediods. For the K dimensional vector representation of basic graph patterns, we compute the structural similarity between a basic graph pattern piand a basic graph pattern C(k) representing
a cluster center as below:
sim(pi, C(k)) =
1 1 + d(pi, C(k))
(1)
The term d(pi, C(k)) is the graph edit distance between basic graph patterns pi and C(k). This
formulation gives us a similarity score within the range of 0 to 1. A similarity score of 0 being the least similar and a score of 1 being the most similar.
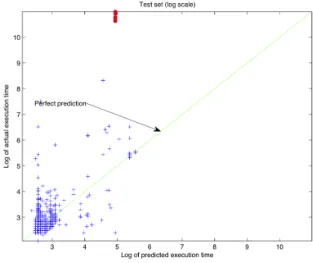
We again train a SVM regression model with both the SPARQL algebra features and the basic graph pattern features. The R2 value on the test queries improves to 0.124204. Figure 5 shows
the log scale plotting of predicted execution time vs actual execution time of our test queries using this model. The model still under-estimates the execution times for queries which have long actual execution time - highlighted in red. However, the predictions moved more towards the perfect prediction line. Therefore the R2 value improved.
Figure 5: Log scale plotting of predicted vs actual execution times for the test queries (test dataset R2 = 0.124204).
A possible reason for this under-estimation could be the fact that our training dataset has queries with various different time ranges. Fitting a curve in such irregular data points is often inaccurate. In the next subsection we discuss how we address this problem.
6Graph Matching Toolkit http://www.fhnw.ch/wirtschaft/iwi/gmt
10 Hasan & Gandon
4.3
Model with Multiple Regressions
To address the problem of our irregular training data, we first split our training data according to execution time ranges, then we train different regressions for different time ranges. We use the x-means [12] clustering algorithm to find X clusters of execution times in our training data. We used x-means because it automatically chooses the number of clusters. For each cluster found in the training data, we create a training data subset with all the queries of the corresponding cluster. We use these X training data subsets to train X number of SVM regressions. As features, we use both the algebra and the basic graph pattern features.
We also train a SVM classifier [4] with a training dataset containing all the training queries and the cluster number of each query as the label for the queries. For an unseen query, we first predict the cluster for the query using the SVM classifier, then we predict the execution time using the SVM regression that correspond to the predicted class for the query. The accuracy of the SVM classifier on our test dataset is 96.0833%. This means that we can accurately predict the execution time ranges of unseen queries as each cluster correspond to a time range of query execution times. The high accuracy also validates our previous observation that the lower R2
values were due to queries with irregular execution times - long and short running queries - in our training data.
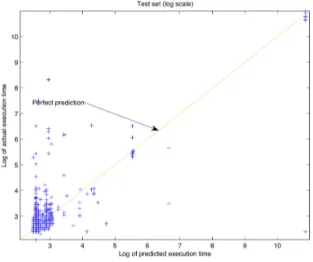
The overall R2value on our test dataset with this model jumps to 0.83862. Figure 6 shows the log scale plotting of predicted execution time vs actual execution time of our test queries using multiple regression models. The long running queries are very close to the perfect prediction line. Also there are more queries moved towards the perfect prediction line.
Figure 6: Log scale plotting of predicted vs actual execution times for the test queries (test dataset R2= 0.83862).
4.4
k-Nearest Neighbors Regression Model
The k -nearest neighbors algorithm (k -NN) [1, 2] is a non-parametric classification and regression method. The k -NN algorithm predicts based on the closest training examples. The k -NN algorithm is often successful in the cases where decision boundary is irregular. We have a similar
Predicting SPARQL Query Execution Time and Suggesting SPARQL Queries 11
k = 1 k = 2 k = 3 k = 4 k = 5 R2 0.2078 0.3551 0.1473 0.0301 0.0318
Table 1: R2values for different k for k -NN for the validation dataset.
situation with our training data. In our final experiment, we train the regression variant of k -NN algorithm. We use Euclidean distance as the distance function of k -NN. For predictions, we use the weighted average of the k -nearest neighbors - weighted by the inverse of the distance from the querying data point. This ensures that the nearby neighbors contribute more to the prediction than the faraway neighbors. We use the k -dimensional tree (k -d tree) [5] data structure to compute the nearest neighbors. For N training samples, k -d tree can find the nearest neighbor of a data point with O (log N ) operations.
We select the value of k for k -NN by cross validation. Table 1 shows the R2values for different
k for the validation dataset. As k = 2 gives the best R2 value, we select k = 2 for our k -NN
model.
The R2value on the test dataset for the model is 0.837. Figure 7 shows the log scale plotting of predicted execution time vs actual execution time of our test queries using k -NN regression. The result of k -NN and multiple regressions are almost same. However, the complexity of training the k -NN regression is less.
Figure 7: Log scale plotting of predicted vs actual execution times for the test queries (test dataset R2 = 0.837).
5
Suggesting SPARQL queries
Query suggestions are useful for constructing and refining queries. We use the same k -d tree that we construct for our k -NN regression model to suggest similar SPARQL queries. For a given query, we suggest the k nearest neighbors of the query from the k -d tree. For example, listing 1 shows a SPARQL query for which we suggest SPARQL queries.
12 Hasan & Gandon
Listing 1: A sample SPARQL query
S E L E C T D I S T I N C T ? uri
W H E R E
{ d b p e d i a : 1 5 4 9 _ M i k k o ? p ? uri . ? uri rdf : t y p e ? x
}
The top 3 suggestions our algorithm generates are below: Listing 2: Suggestion 1 S E L E C T D I S T I N C T ? uri W H E R E { d b p e d i a : R a d u _ S a b o ? p ? uri . ? uri rdf : t y p e ? x } Listing 3: Suggestion 2 S E L E C T D I S T I N C T ? uri W H E R E { d b p e d i a : H a f a r _ A l - B a t i n ? p ? uri . ? uri rdf : t y p e ? x } Listing 4: Suggestion 3 S E L E C T D I S T I N C T ? uri W H E R E { d b p e d i a : M a u r i c e _ D . _G . _ S c o t t ? p ? uri . ? uri rdf : t y p e ? x }
The suggested queries are very similar to the query in listing 1. A user can use such query suggestions for various purposes. For example, checking the similar queries executed for a given query and analyzing their behavior. This would help the user to understand behavior of similar queries based on the query execution history.
6
Related Work
To the best of our knowledge, there is no existing work on predicting SPARQL query performance using machine learning techniques. In the database literature, Ganapathi et al. [6] discuss pre-dicting performance metrics of database queries prior to query execution using machine learning. The authors use Kernel Canonical Correlation Analysis (KCCA) to predict a set of performance metrics. The authors use a set of query operators as query features to predict the performance metrics. For the individual query elapsed time performance metric, the authors were able to predict within 20% of the actual query elapsed time for 85% of the test queries. The authors envision that their approach can support database workload management and capacity plan-ning. Gupta et al. [7] use machine learning for predicting query execution time ranges on a data warehouse. Gupta et al. achieved an accuracy of 80% predicting with 4 time ranges.
Stojanovic et al. [17] study the problem of query refinement in ontology-based systems. They propose a logic-based approach which enables users to refine queries in a step-by-step fashion. In each step, this approach suggests a ranked list of refinements according to the user’s needs. The authors argue that this approach is suitable for modeling information retrieval tasks on databases. Nandi et al. [11] present an automatic query completion approach to he users construct queries without prior knowledge of the underlaying schema. This approach helps the users to construct
Predicting SPARQL Query Execution Time and Suggesting SPARQL Queries 13
queries while they type by suggesting schema level parameters and text fragments from the data. Zenz et al. [18] introduce the QUICK system to help users construct semantic queries from keywords. QUICK enables a user to start with arbitrary keywords and incrementally constructs the intended query.
7
Conclusion and Future Work
We study the techniques to predict SPARQL query execution time and suggesting SPARQL queries. We learn query execution times from query history using machine learning techniques. An important contribution of our work is transforming SPARQL queries into vector represen-tation necessary for machine learning algorithms. We achieved high accuracy (coefficient of determination value of 0.84) for predicting query execution time.
In future, we would like to evaluate our query suggestions. A possible evaluation method would be to perform a user-centric evaluation. Users would be asked to rate the quality of suggestions. Then we would compute the overall accuracy of our approach by evaluating how much the opinions of the users and the results of our algorithm match.
Acknowledgements
The work presented in this paper is supported by the CONTINT program of French National Agency for Research (ANR) under the Kolflow project (ANR-2010-CORD-021-02).
14 Hasan & Gandon
References
[1] Aha, D., Kibler, D., Albert, M.: Instance-based learning algorithms. Machine Learning 6(1), 37–66 (1991), http://dx.doi.org/10.1007/BF00153759
[2] Altman, N.: An introduction to kernel and nearest-neighbor nonparametric regression. The American Statistician 46(3), 175–185 (1992)
[3] Bunke, H., Messmer, B.: Similarity measures for structured representations. In: Wess, S., Althoff, K.D., Richter, M. (eds.) Topics in Case-Based Reasoning, Lecture Notes in Computer Science, vol. 837, pp. 106–118. Springer Berlin Heidelberg (1994), http://dx. doi.org/10.1007/3-540-58330-0_80
[4] Chang, C.C., Lin, C.J.: LIBSVM: A library for support vector machines. ACM Transactions on Intelligent Systems and Technology 2, 27:1–27:27 (2011), software available at http: //www.csie.ntu.edu.tw/~cjlin/libsvm
[5] Friedman, J.H., Bentley, J.L., Finkel, R.A.: An algorithm for finding best matches in logarithmic expected time. ACM Trans. Math. Softw. 3(3), 209–226 (Sep 1977), http: //doi.acm.org/10.1145/355744.355745
[6] Ganapathi, A., Kuno, H., Dayal, U., Wiener, J.L., Fox, A., Jordan, M., Patterson, D.: Predicting multiple metrics for queries: Better decisions enabled by machine learning. In: Proceedings of the 2009 IEEE International Conference on Data Engineering. pp. 592–603. ICDE ’09, IEEE Computer Society, Washington, DC, USA (2009), http://dx.doi.org/ 10.1109/ICDE.2009.130
[7] Gupta, C., Mehta, A., Dayal, U.: PQR: Predicting query execution times for autonomous workload management. In: Proceedings of the 2008 International Conference on Autonomic Computing. pp. 13–22. ICAC ’08, IEEE Computer Society, Washington, DC, USA (2008), http://dx.doi.org/10.1109/ICAC.2008.12
[8] Hall, M., Frank, E., Holmes, G., Pfahringer, B., Reutemann, P., Witten, I.H.: The WEKA data mining software: an update. SIGKDD Explorations 11(1) (2009)
[9] Kaufman, L., Rousseeuw, P.: Clustering by means of medoids. In: Dodge, Y. (ed.) Statistical Data Analysis based on the L1 Norm, p. 405–416 (1987)
[10] Morsey, M., Lehmann, J., Auer, S., Ngonga Ngomo, A.C.: Dbpedia SPARQL benchmark – performance assessment with real queries on real data. In: Aroyo, L., Welty, C., Alani, H., Taylor, J., Bernstein, A., Kagal, L., Noy, N., Blomqvist, E. (eds.) The Semantic Web – ISWC 2011, Lecture Notes in Computer Science, vol. 7031, pp. 454–469. Springer Berlin Heidelberg (2011), http://dx.doi.org/10.1007/978-3-642-25073-6_29
[11] Nandi, A., Jagadish, H.V.: Assisted querying using instant-response interfaces. In: Pro-ceedings of the 2007 ACM SIGMOD international conference on Management of data. pp. 1156–1158. SIGMOD ’07, ACM, New York, NY, USA (2007), http://doi.acm.org/10. 1145/1247480.1247640
[12] Pelleg, D., Moore, A.W.: X-means: Extending k-means with efficient estimation of the number of clusters. In: Proceedings of the Seventeenth International Conference on Machine Learning. pp. 727–734. ICML ’00, Morgan Kaufmann Publishers Inc., San Francisco, CA, USA (2000), http://dl.acm.org/citation.cfm?id=645529.657808
Predicting SPARQL Query Execution Time and Suggesting SPARQL Queries 15
[13] Riesen, K., Bunke, H.: Approximate graph edit distance computation by means of bipartite graph matching. Image Vision Comput. 27(7), 950–959 (Jun 2009), http://dx.doi.org/ 10.1016/j.imavis.2008.04.004
[14] Riesen, K., Emmenegger, S., Bunke, H.: A novel software toolkit for graph edit dis-tance computation. In: Kropatsch, W., Artner, N., Haxhimusa, Y., Jiang, X. (eds.) Graph-Based Representations in Pattern Recognition, Lecture Notes in Computer Science, vol. 7877, pp. 142–151. Springer Berlin Heidelberg (2013), http://dx.doi.org/10.1007/ 978-3-642-38221-5_15
[15] Sedgewick, R., Wayne, K.: Algorithms. Addison-Wesley, fourth edn. (2011)
[16] Shevade, S.K., Keerthi, S.S., Bhattacharyya, C., Murthy, K.R.K.: Improvements to the SMO algorithm for SVM regression. Neural Networks, IEEE Transactions on 11(5), 1188– 1193 (2000)
[17] Stojanovic, N., Stojanovic, L.: A logic-based approach for query refinement in ontology-based information retrieval s. In: Proceedings of the 16th IEEE International Conference on Tools with Artificial Intelligence. pp. 450–457. ICTAI ’04, IEEE Computer Society, Wash-ington, DC, USA (2004), http://dx.doi.org/10.1109/ICTAI.2004.13
[18] Zenz, G., Zhou, X., Minack, E., Siberski, W., Nejdl, W.: From keywords to semantic queries-incremental query construction on the semantic web. Web Semant. 7(3), 166–176 (Sep 2009), http://dx.doi.org/10.1016/j.websem.2009.07.005
RESEARCH CENTRE
SOPHIA ANTIPOLIS – MÉDITERRANÉE
2004 route des Lucioles - BP 93 06902 Sophia Antipolis Cedex
Publisher Inria
Domaine de Voluceau - Rocquencourt BP 105 - 78153 Le Chesnay Cedex inria.fr