HAL Id: halshs-01281948
https://halshs.archives-ouvertes.fr/halshs-01281948
Submitted on 3 Mar 2016
HAL is a multi-disciplinary open access
archive for the deposit and dissemination of
sci-L’archive ouverte pluridisciplinaire HAL, est destinée au dépôt et à la diffusion de documents
Predicting US banks bankruptcy: logit versus Canonical
Discriminant analysis
Zeineb Affes, Rania Hentati-Kaffel
To cite this version:
Zeineb Affes, Rania Hentati-Kaffel. Predicting US banks bankruptcy: logit versus Canonical Discrim-inant analysis. 2016. �halshs-01281948�
Documents de Travail du
Centre d’Economie de la Sorbonne
Predicting US banks bankruptcy: logit versus Canonical
Discriminant analysis
Zeineb A
FFES,Rania H
ENTATI-K
AFFELPredicting US banks bankruptcy: logit versus Canonical
Discriminant analysis
Zeineb Affes∗ Rania Hentati-Kaffel†‡ February 21, 2016
Abstract
Using a large panel of US banks over the period 2008-2013, this paper proposes an early-warning framework to identify bank leading to bankruptcy. We conduct a comparative analysis based on both Canonical Discriminant Analysis and Logit models to examine and to determine the most accurate of these models. Moreover, we analyze and improve suitability of models by comparing different optimal cut-off score (ROC curve vs theoretical value). The main conclusions are: i) Results vary with cut-off value of score ii) the logistic regression using 0.5 as critical cut-off value outperforms DA model with an average of correct classification equal to 96.22%. However, it produces the highest error type 1 rate 42.67% iii) ROC curve validation improves the quality of the model by minimizing the error of misclassification of bankrupt banks: only 4.42% in average and exhibiting 0% in both 2012 and 2013. Also, it emphasizes better prediction of failure of banks because it delivers in mean the highest error type II 8.43 %.
Keywords: Bankruptcy prediction, Canonical Discriminant Analysis, Logistic regres-sion, CAMELS, ROC curve, Early-warning system
1
Introduction
The financial crisis of 2007 is considered as the first real crisis of excess financial com-plexity. It illustrates the degree of the existing inter-connectivity between banks and
∗Contact author. Centre d’Economie de la Sorbonne, Université Paris1 Panthéon-Sorbonne, Maison
des Sciences Economiques, 106-112 Boulevard de l’Hôpital 75013 Paris, France.Email: [email protected]
†
Contact author. Centre d’Economie de la Sorbonne, Université Paris1 Panthéon-Sorbonne, Maison des Sciences Economiques, 106-112 Boulevard de l’Hôpital 75013 Paris, France. Phone: 00 33 1 44 07 87 45, Email: [email protected]
‡
This work was achieved through the Laboratory of Excellence on Financial Regulation(Labex ReFi) supported by PRES heSam under the reference ANR-10-LABX-0095.
financial institutions and highlighted the phenomenon of contagion that might exist in the interbank market. Since then, a swarming literature has been developed on the subject of quantification, prediction and control of systemic risk.
One of the methods proposed to prevent contagion of bank failures is to assess the bank failure rate. This approach helps to establish an early warning model of bank difficulties. Thus, interactions that may exist between solvency and refinancing risk can identify the banks which have the most difficulties to refinance and therefore be perceived as risky by the other institutions. This stigma will limit part counterparty risk and warn the financial authorities of a liquidity risk in case of default of these banks.
The existing financial literature engorges methods and models which aim to identify institutions whose financial situation appears alarming and deserves attention by super-visors. In this study, we propose to estimate and test the effectiveness of forecasting models of bank failures in the United States. The specificity of our study lies in the fact that it takes into account several financial ratios (solvency ratios, quality of assets, cash or liquidity ...) and is based on a very large sample of US banks (large and small bank) and from 2008 to 2013. The results of our study confirm that early warning system of banking difficulties including CAMEL financial variables is of great efficacy.
The empirical literature distinguishes two methods: parametric and non-parametric validation.Beaver (1966) was the pioneer in using a statistical model for predicting bankruptcy. The approach is to select from thirty financial ratios those which are the most effective indicators of financial failures. The study concludes that the (cash flow/-Total debt) ratio is the best forecasting indicator.
Altman (1968) tested Multiple Discriminant Analysis (MDA) to analyze 70 compa-nies, first by identifying the best five significant explanatory variables from a list of 22 ratios and then by applying the (MDA) to calculate a Z-Altman score for each company. This score was almost accurate in predicting bankruptcy one year ahead. This model was then subsequently improved in Altman and Narayanan (1997) by proposing the zeta model that includes seven variables and classified correctly 96% of companies one year before bankruptcy and 70% five years before bankruptcy.
Since then, the use of discriminant analysis has continued to grow through the dif-ferent published studies (Bilderbeek (1979); Ohlson (1980); Altman (1984);Zopounidis and Dimitras (1993)...). The vast majority of studies achieved after 1980 used the logit models to overcome the drawbacks of the DA method (Zavgren (1985); Lau (1987); Tennyson et al. (1990)...) The logit analysis fits linear logistic regression model by the method of maximum likelihood. The dependent variable(the probability of default) gets the value "1" for bankrupted banks and "0" for the healthy banks.
The second main approach has been developed to fix the constraints of traditional statistical model. Non parametric methods such TRA (Trait Recognition Analysis) also called Trait Recognition Models (TRM) has no prior assumption about variables to predict. It is associated to neural network models and allows the information exploration when interactions between the independent variables are nonlinear (Kolari et al. (2002)). In this sense, since (Frydman et al., 1985) work, decision tree has become a popular data mining technique and commonly used for classification and prediction.
Many other studies have applied this same technique in commercial US banks and have shown that it performs better than the Probit model (Marais et al. (1984)). Messier Jr and Hansen (1988) show that inductive algorithm is better than the DA.
Numerous comparative studies were carried out (Keasey and Watson (1991); Dimi-tras et al. (1996)); Altman and Narayanan (1997); Wong et al. (1997); Adya and Collopy (1998); O’leary (1998);Zhang et al. (1998); Vellido et al. (1999); Coakley and Brown (2000); Aziz and Dar (2004); Balcaen and Ooghe (2006); Balcaen et al. (2004); Ku-mar and Ravi (2007)). However, the supremacy of one method over another remains subject to various controversies because of the heterogeneity of the data used for val-idation (database, number of points in the data, sample selection, valval-idation methods for forecasting, the number and the nature of explanatory variables tested in the model (financial, qualitative ...).
However, recent studies have shown the superiority of neural networks over other techniques (Du Jardin (2010); Jo et al. (1997); Tsai and Wu (2008)). In particular, Du Jardin (2010) results, based on over 200 previous articles, showed that neural network based model leads to better results in terms of failure rate prediction.
The aim of this paper is twofold: descriptive and predictive. In the financial litera-ture, the analytical part is often not addressed. Nevertheless, we believe that this is the cornerstone of a better interpretation of the results. Thus, we proceed by describing and analyzing key financial ratios of the active and non-active banks for the entire period from 2008 to 2013.
In this paper we combined three parametric models (Canonical Discriminant Analysis and Logit) with the descriptive Principal Component Analysis model (PCA) to construct an early warning system (EWS).
First, (PCA) reduced the size of data (dimension below 10) and insure an uncorre-lated blend of variables framework. Then, factor scores were estimated for each bank. These scores were used to estimate (CDA) and Logit models.
One among the important results of this paper is to have compared several methods to calculate the theoretical value of the probability of default that will serve as threshold to split the bank universe into two set : failed or healthy.
The paper consists of four sections. After the introduction, an overview of the existing literature concerning the bank failure prediction is given. Section two describes used data, the methodology and (PCA) results. Section three provides the empirical analysis and the study results. Finally section four contains concluding remarks.
2
Description of the Methodology and the variables
This section focuses on the data gathered for the estimation of our models. We begin by describing data collection and variables selection process. Next, we present the financial and economic ratios followed by descriptive statistics and correlation analysis.
2.1 Data description
We proceed to the constitution of our database of US banks from mainly two sources: "BankScope" and FDIC. Our database covers the period 2008-2013. Statistics shows that the period from 2008 to 2013 is marked by a wave of bank failures in the United States: more than 450 bank failures and FDIC estimated losses to more than US 85 billion dollar.
After data reprocessing, the sample banks contains two categories: active banks and non-active banks. Non-active banks are those which have been declared as bankrupted by the Federal Deposit Insurance Corporation (FDIC). The information on the identity and the bank’s balance sheet data are obtained from the FDIC website. Indeed, all US banks must report their financial statements in the Uniform Bank Performance Report. Some treatments have been applied to our sample to allow homogeneity between banks. Indeed, a bank that has been declared bankrupted in the first quarter of the year "N" will be reclassified and considered as bankrupted in late "N-1"
For banks declared bankrupt by the FDIC after 01/04/N and for which there is no information for the current year, they will be considered as inactive for the year "N". For banks that will make bankruptcy at date later and which data are available in 31/12/N, they will be considered as active for "N". Financial variables of active banks were retrieved from the database "BankScope". Data were available for only 928 banks each year in the period 2008-2013. After processing and verifying data availability of the financial statements required in our study, the number of banks was reduced to 411 failed banks over the entire period 2008-2013 and 836 active banks each year. Table 1 gives more details on our database.
2.2 Variables: review of the literature
Federal regulators developed the numerical CAMEL rating system in the early 1970s to help structuring their examination process. This rating is based on the capital adequacy, asset quality, management quality, earnings ability, and liquidity position ratios. Capital adequacy evaluates the quality of a bank’s capital. Asset quality measures the level of risk of a bank’s assets. This is reflects the quality and the diversity of the credit risk and the ability of the bank to repay issued loans. Management quality is a measure of the quality of a bank’s officers and the efficiency of its management structure. Earnings ability reflects the performance of banks and the stability of its earnings stream. Liquidity measures the ability of banks to meet unforeseen and unexpected deposit outflow in the short time. In February 1997, a sixth component sensitivity to market risk was added to the CAMEL rating system.
A very abundant literature tried to identify the most significant variables of the fi-nancial health of banks. According to Sinkey (1975), the quality of bank assets is the most significant ratio. Assets composition, loans characteristics, capital adequacy, source and use of income, efficiency and profitability are also discriminant variables. Poor asset quality and low capital ratios were the two characteristics of banks most consistently associated with banking problems during the 1970s (Sinkey (1978)). Avery et al. (1984),
Barth et al. (1985) and Benston (1985) conclude that the proxies of loans portfolio com-position and quality, capital ratio and the source of income are significant. Thomson (1991) demonstrate that the probability that a bank will fail is a function of variables re-lated to its solvency, including capital adequacy, asset quality, management quality, and the relative liquidity of the portfolio. Martin (1977) found that the capital asset ratio, and the loans portfolio’s composition to total assets ratio have a high level of significance. Pantalone et al. (1987) proposed a model including most of CAMEL proxies: profitabil-ity, management’s efficiency, leverage, diversification and economic environment. Their results confirm the main cause of default was bad credit risk management. The model of Barr et al. (1994) include CAMEL proxies and efficiency scores as management’s quality proxies and a proxy of the economic conditions. The six variables selected for their failure-prediction models are equity/total loans (C), non performing loans/total assets (A), DEA efficiency score (M), net income/ total assets (E) and large dollar deposits/ total assets(L).
Our main objective in this study is to provide an accurate bank failure model based on the significant fragility factors. In line with the literature, we maintain the most commonly used financial ratios which can forecast potential failures (Beaver (1966), Altman (1968)), Thomson (1991), Kolari et al. (1996), Jagtiani et al. (2003), Dabos and Sosa-Escudero (2004), and Lanine and Vander Vennet (2006)).
3
Principal Component Analysis
3.1 Variable’s Statistics description
We include in our analysis four categories of variables: (1) two measures of capital ad-equacy. These latter indicates the measurement of the financial strength of a bank and determines the capacity of the bank in terms of meeting time liabilities and other risk such as credit risk, market risk, operational risk and others. The most popular proxy for capturing capital adequacy in previous literature is total equity divided by either total assets or total loans. (2) assets quality measures are considered in data construction. These variables have a crucial role in the assessment of the current condition and finan-cial capacity in the future. We employ four variables related to asset quality (NPLTA, NPLGL, LLRTA, and LLRGL). We note that for NPLTA and NPLGL variables we use the proxy loans not accruing plus loans over 90 days late/ total assets (non-performing loans/total assets). (3) Bank profitability which is assessed through two ratios. The first ratio is the net profit as a share of total assets. As for the second measure, it is the net profit as a share of total shareholders’ equity. Both measures are positively related to the financial performance of the bank and negatively related to the failure (Hassan Al-Tamimi and Charif (2011)). (4) The liquidity level of the bank is assessed through employing three ratios. The first one is total liquid assets to total assets. This indicates the ability of the bank to cover its liabilities. The second ratio which was used to estimate liquidity is total liquid assets as a share of total deposits. This ratio depicts the capacity of the bank to cover unanticipated deposit withdrawal. The ratio
of liquid assets to short term liabilities is the last ratio to determine the liquidity. The explanatory variables are shown below:
Categories CAMEL Variables Definition
Capital Adequacy EQTA Total Equity/Total Assets
EQTL Total Equity/Total Loans
Assets Quality NPLTA Non Performing Loans/Total Assets
NPLGL Non Performing Loans/Gross Loans
LLRTA Loan Loss Reserves/Total Assets
LLRGL Loan Loss Reserves/Gross Loans
Earnings Ability ROA Net Income/Total Assets
ROE Net Income/Total Equity
Liquidity TLTD Total loans /Total customer Deposits
TDTA Total Customer Deposits/Total Assets
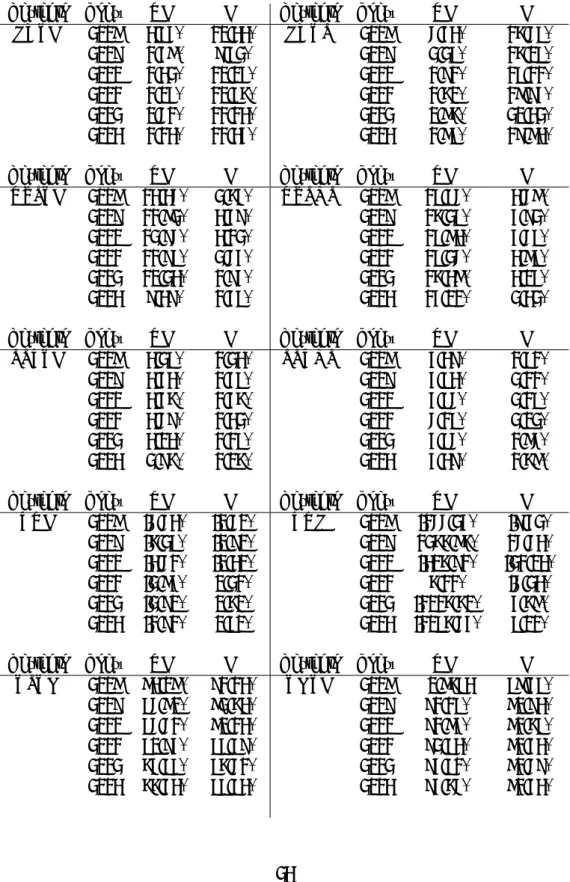
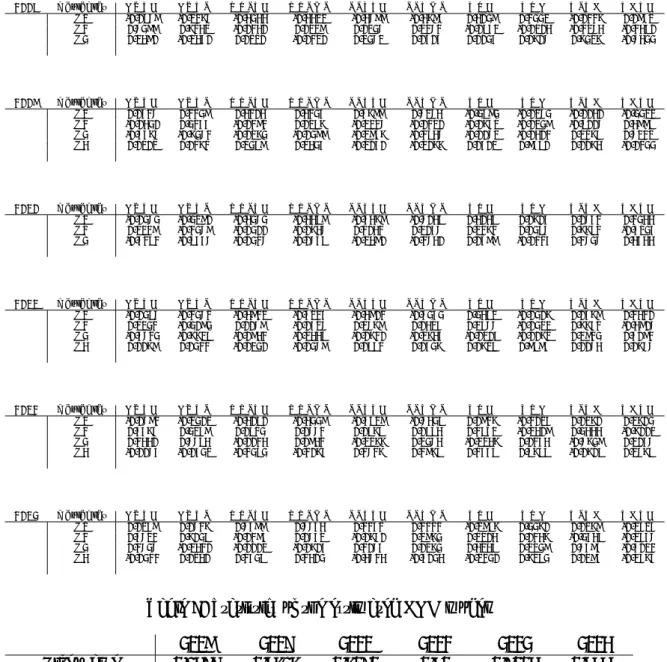
Table (2) presents the means of the ten financial ratios for the two groups (Non Failed Bank (NFB) and Failed Bank (FB)), and significance tests for the equality of group means for each ratio.
First, according to capital adequacy ratios which are measures of how much capital is used to support the banks’ risk assets. (EQTA) ratios for (FB) are on average very low. A low ratio means a significant leverage of these banks. This makes banks less resistant to shocks. Thus, the higher (EQTA) value is; the lower the probability of default will be. As banks trend toward failure, their equity position is likely to decrease, thus a negative relationship is expected between total loans and failure. The same conclusions emanate from the (EQTL) ratio analysis.
According to the asset quality ratio, we note that (NPLTA) ratios for (FB) are very low and disparate for the period spanning between 2008 and 2013. The immediate conse-quence of large amount of non-performing loans(NPL) is bank failure. In fact, according to our data, the economic environment has pushed up (NPL) thus the ratios (NPLTA), (NPLGL), (LLRTA) and (LLRGL) decrease. Banks with a high (NPL)amount tend to carry out internal consolidation to improve the asset quality rather than distributing creditand will be obliged to raise provision for loan loss. For example, (NPLGL) ratio fell by 3.92% from 13.35% to 9.31% for (FB) and by 1.17% for (NFB). We note that low value of loan portfolio signals the potential existence of an important vulnerability in the financial system (17.75% in 2008 and 17.83% in 2010). (LLRTA) and (LLRGL) provide an useful indication for analysts because they indicate a bank’s sense of how stable its lending base is. The higher the ratio, the poorer the quality of the loan portfolio will be (3.59% for (LLRTA) ratio and 5.17% for (LLRGL) ratio for the (FB) in 2011).
Finally (TLTD) and (TDTA) liquidity ratios are often used by policy makers to assess the lending practices of banks and get some statistics. If the ratio is too high, it means that banks might not have enough liquidity to cover any unforeseen fund requirements; if the ratio is too low, banks may not be earning as much as they could be. Table (2)
exhibits in average for(FB) high values (for example 91.13% and 82.63% for 2008 and 2009). These high ratios reflect the fact that they are relying on borrowed funds.
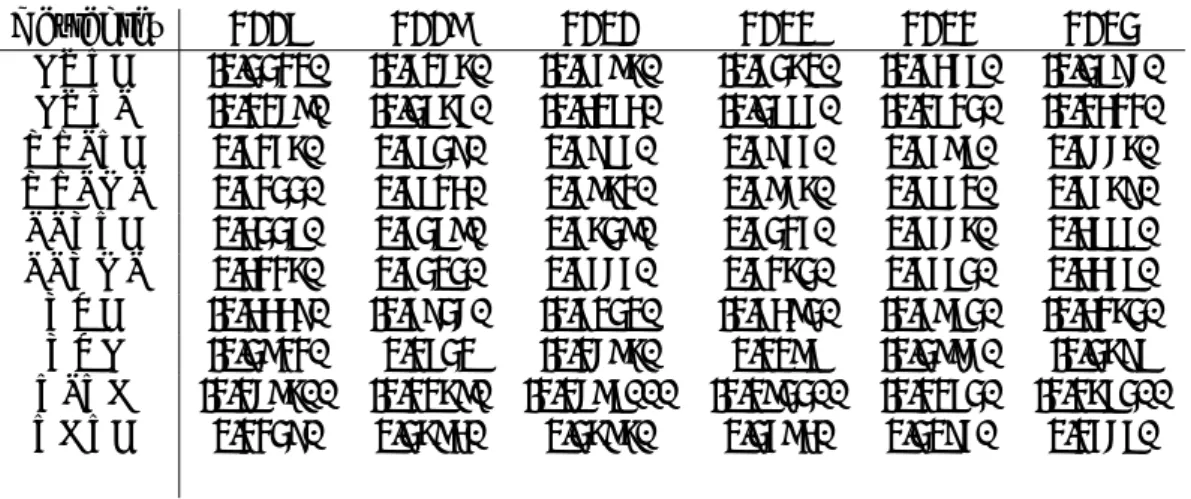
Table (3) is used to analyze the correlation coefficients between the different ex-planatory variables and the dependent variable (probability of default). We note the significance at 1% and 5% of all the variables that we have retained in our study. Note also that most of the coefficients have the expected signs. For example, a negative cor-relation is confirmed for (EQTA) and (EQTL) for all years. Indeed, an increase in the value of the two ratios has a negative effect on the bank’s survival.
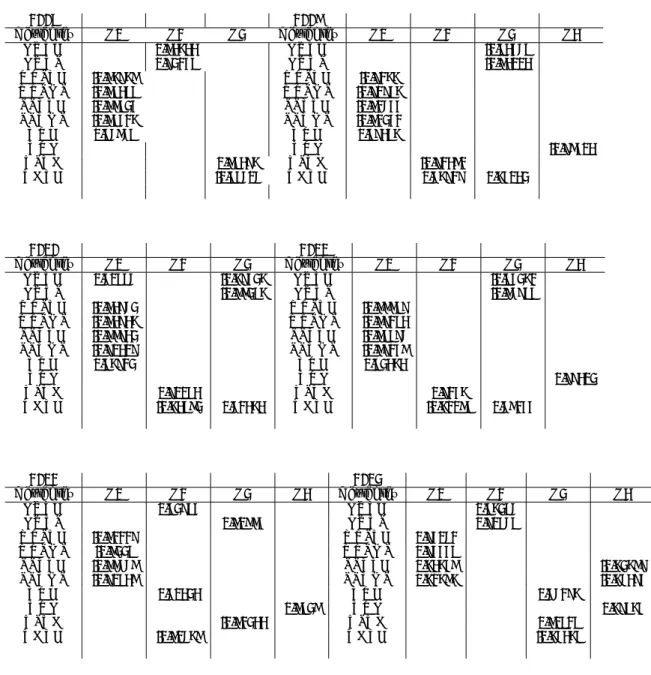
Table(4), presents the correlation matrix of ratios. Here, it can be seen that most of the ratios shows correlation to each other. When scrutinizing the correlation’s matrix pairwise, we can distinguish the following aspects. There is a strong correlation (over 90%) between the pairs of variables (NPLTA) / (NPLGL) and (LLRTA)/(LLRGL). This result is generalized for all years and reflects a strong link between them and that one of the variablescan be replaced by another.Also, the Asset quality component (AQ) which groups (NPLTA), (NPLGL), (LLRTA) and (LLRGL) variables is negatively correlated with the return on assets (ROA). The ratio (EQTA) variable, which is a proxy of capital adequacy, and profitability of assets are negatively correlated with proxies of asset quality. There is a positive correlation between asset quality and profitability of the bank’s assets. The same interpretation is still valid for years 2010 and 2011.
3.2 PCA
In this section we present the results of variables selection under the Principal Compo-nent Analysis (PCA). The aim is to extract the most important information from the data and to compress the data dimension by keeping only the most important ratios to explain the changes in financial conditions of banks.
Several tests are provided as following:
i) Bartlett’s test to validate the assumption of equality of variances. In this sense, if the test statistic is larger than the critical value, we reject the null hypotheses at the 5% significant level (Table 5). Thus, the sample correlation matrix did not come from a population where the correlation matrix is an identity matrix. ii) Kaiser-Meyer-Olkin (KMO) to test if the variables have enough in common to
war-rant a factor analysis. In this test (KMO) retain only components with eigenvalues greater than one. Eigenvalues, also called characteristic roots are presented in Ta-ble (5).
In addition to this tests, we perform (PCA) by analysing Factor Loading which are correlation coefficients between the financial variables and factors. Finally, we determine the (PCA) scores.
Before getting to the description of (PCA), we first analyse the correlation matrix. Then after centering and standardizing each ten variables, we determine the optimal number of principal component analysis.
The starting point is the correlation matrix. Table (4) presents the degree of depen-dence between the initial ten variables. It can be easily seen that variables are correlated. This means that the information they convey have some degree of redundancy. To per-form this finding of correlation, we present in Table (5) Bartlett’s test of Sphericity. Bartlett test compares the correlation matrix with a matrix of zero correlation . A zero p-value is obtained over all the period from 2008 to 2013. Thus, we perform a valid factor analysis.
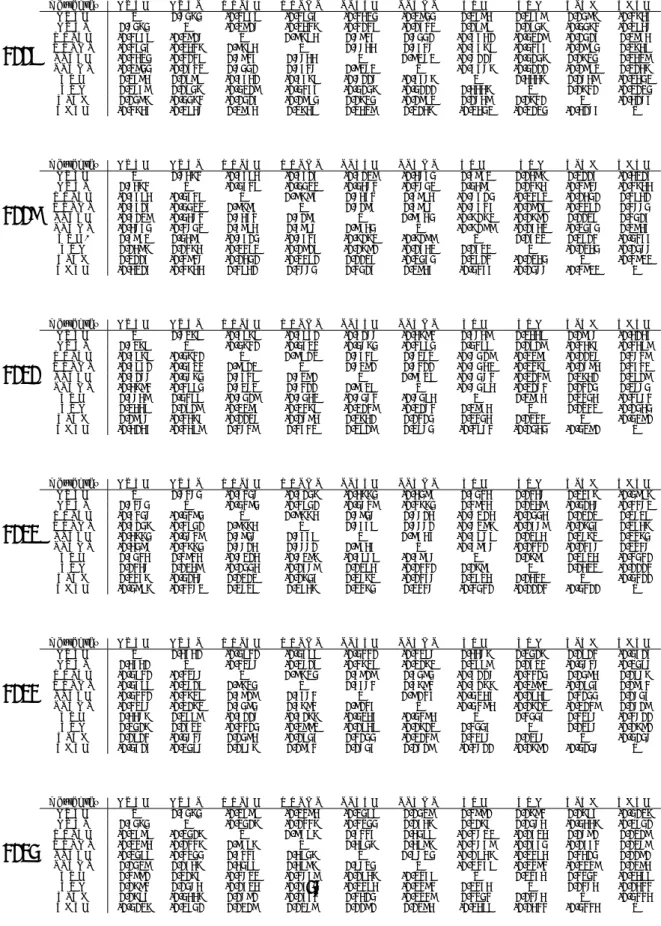
Table (6) describes the estimated factors and their eigenvalue. In 2008, we retain the first three factors. These factors explain 71.93% of the total variation of the financial conditions of banks. The first factor is the most important dimension to explain the changes in financial conditions of banks. It explains 41.54% of the total variance of the selected financial ratios. Factors F2 and F3 respectively explain 16.15% and 14.23% of the total variance.
Under the same decision rule of (KMO) measure and based on the results of the Eigenvalue’s factors of 2009. These four factors account for 81.76% of the total variation of the financial conditions of banks. The first factor explains 46.81% of the total variance of financial ratios. Factors F2, F3 and F4 respectively explain 13.23%, 11.56% and 10.15% of the total variance.
In 2010, the first three factors explained 71.4% of the total variation. The first factor explains 46.6% of the total variance. Factors F2 and F3 respectively explain 13.9% and 10.89% of the total variance. The choice of four factors is validated for 2011 and account for 81.68% of total variation. Finally, for the years 2012 and 2013, the first four selected factors explain almost 77% of the total variation.
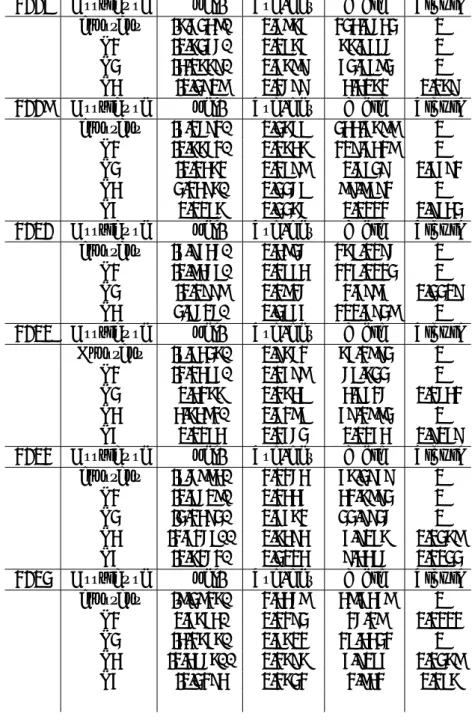
We follow (PCA) by considering and evaluating Factor’s loadings (see Table 7). In our case, the contribution ratios in the main components vary between 0 and 1 in absolute values. If a variable contributes more than 0.5 in a specific factor, it will be considered as the main indicator. However,if its contribution is below this threshold, the variable will be considered as a secondary indicator.
For 2008, variables that explain better the first factor F1 are (NPLTA), (NPLGL), (LLRTA), (LLRGL) and (ROA). F1 refers to both assets quality and return on assets components. The component loadings tell us how much of the variation in a variable is explained by the component. For example asset quality loading values are negatives. Thus, an increase in the value of these ratios will result in a lower score factor F1. So, the increase in these ratios will decline the asset quality. This implies, subsequently, an increase in the probability of default of the bank. The (ROA) ratio has a positive loading, which means that an increase in its value will increase the F1 score. We find the same results for 2009, 2010 and 2011 for F1 factor. For 2012 and 2013, F1 groups only variables of asset quality. For 2013, all the ratios have a positives loadings, which means that an increase in its values will increase the score of the factor F1.
F2 groups ratios of Capital Adequacy (EQTA) and (EQTL) only for 2008, 2012 and 2013. Loadings for these two variables are positives. An increase in the value of these two ratios will increase the value of the score of the Capital Adequacy factor and reduce the probability of default.
In 2009 this factor is composed by the ratios (TLTD) and (TDTA). Loadings are negatives and an increase of the value will accentuate the probability of default.
In 2010 and 2011, we retain also the second factor F2 which includes liquidity com-ponents. (TLTD) ratio has a positive loading, which means that an increase in its value will increase the D-score of the liquidity factor. (TLTD) ratio is considered as a good proxy of short term viability and a low value means that there is no optimal reallocation of resources.
For 2009, 2010 and 2011 the factor F3 is composed by capital adequacy variables and (TDTA) variable.
For the other years studied, a fourth factor (F4) is considered and it brings the ratio (ROE) and the two ratios of asset quality.
Finally, we determine the factor score coefficient matrix for each bank. According to the Table (8) which describes the factor score coefficients, we calculate factor scores for each bank using the formula below:
Fbi =
X
uijzbj (1)
Where:
• Fbi:the estimated factor i for bank b
• zbj: the standardized value of the jth ratios for a bank b
• uij: the factor score coefficient for the ith factor and the jth ratios
• These scores (Fai) were used as independent variables in estimating the
discrimi-nant and the Logit model.
4
Empirical results
4.1 Canonical Discriminant Analysis
In this section, we provide Canonical Discriminant Analysis (CDA) to conduct and recuperate an early warning system indication of failed banks. In this sense, we propose to describe the relationships among the two groups of banks (bankrupt or not) based on a set of discriminating variables.
The canonical discriminant function is expressed as follow:
Dbi= b0+ β1Fb1+ β2Fb2+ ... + βiFbi (2)
Where:
• Dbi: the value (score) on the canonical discriminant function for bank b.
Each sampling group of bank has a single composite canonical score, and the group centroids indicate the most typical location of a bank from a particular group. Discrim-inant analysis assumes the normality of the underlying structure of the data for each group. The proposed procedure is as follow:
1. Estimate the D-score of each bank via the equation ?? 2. Calculate the cut-off score.
3. Classify banks according to the optimal cut-off.
We recall that the optimal cut-off score is approximately zero. This is the weighted average of scores for bankrupt banks and active banks. Thus, the decision rule applied in the separation of sample studied is: a bank with a D-score less than zero will be considered as a bankrupt bank. However a bank with a D-score greater than zero will be classified in the group of healthy banks.
Eigenvalue’s for 2008, 2009 and 2013 are respectively 0.2389, 0.4626 and 0.4775 (see Table 9). This result shows that the discriminant function does not allow easy identification of status between banks. Statistics of Wilk’s lambda which correspond to the total variance in the discriminant scores not explained by differences among the groups confirm this result. Wilk’s values for 2008, 2009 and 2013 are respectively 80.72%, 68.37% and 67.68% of the variance are not explained by group differences.
For 2012, a high eigenvalue (0.8013) shows that the discriminant function differenti-ates the two groups of banks. The model explains only 44.49% (Square canonical R) of the variance between the two classes (FB, NFB). Wilk’s lambda greater in average than 70% shows that the most of total variability is attributable to differences between the means of D-scores of the groups. The square canonical correlation coefficient testifies the weak association between the discriminant scores and the set of independent variables (among 35%).
Finally, the linear combination of the factors scores provide for each bank a D-score, according to the estimated canonical discriminant model below :
Dscore2008 = 0.9550F1+ 0.3071F2+ 0.2059F3 (3) Dscore2009 = 0.8921F1−0.2337F2−0.6026F3 Dscore2010 = 0.9217F1+ 0.2594F2−0.5791F3 Dscore2011 = 0.9536F1+ 0.2449F2−0.5198F3 Dscore2012 = 0.8876F1+ 0.5917F2+ 0.5595F4 Dscore2013 = −0.8190F1+ 0.3770F2+ 0.4593F3+ 0.5229F4
Correlations between predictor variables and standardized canonical discriminant function are given in the table 10.
Over all there are no surprises in score’s factors. In 2008 for example, F1, F2 and F3 are positively related to the D-score’s bank. Clearly, good asset quality and a high level
of equity, improve profitability. In addition, a sufficient level of liquidity help bank to be able to perform its score and its ranking so it promotes in the non-failed bank group. In 2009, according to the structure of the matrix correlation (see Table 10) we retain only 3 Factors. F2 and F3 are negatively related to the score. This means that the rise of these later will reduce the bank’s score. Indeed, a low level of liquidity coupled with a low level of funds reduces the bank’s score.
4.2 Logit Regression
In this section, we propose the validation of the logit model which is considered as one of the most commonly applied parametric failure prediction models in both the academic literature as well as in the banking regulation and supervision. Logit model is based on a binomial regression and is based on the estimation of the probability of failure P(Z). This probability is defined as a linear function of a vector of covariates Zi and a vector
of regression coefficients βi:
Zi = β0+ β1X1+ β2X2+ . . . + βnXn (4)
In this study, the logistic regression model used, the dependent variable Yi Which
takes a value of 1 (Y=1) when a failure occurred in a predefined period following the date at which the financial statement data are determined. If not, Yi, takes on a value
of 0 (Y=0) when no failure occurred.
The relationship between the dependent variable and the predictor variables is ex-pressed as follows:
(
P(Y = 1) = P (Z) = (1+exp1(−Z)) P(Y = 0) = 1 − P (Z) = (1+exp1 (Z))
(5) In our analysis we consider the factors determined from the (PCA) as explanatory vari-ables. After estimating the coefficients of the Logit model, we obtain the score of each bank Za: Za= β0+ n X i=1 βiFi (6)
Subsequently, we determine the probability of default of each bank:
The estimated probability of default allows the reallocation of each bank to a specific risk class. Subsequently, a threshold P* is set to enable segregation between banks and the allocation of these to one of two classes. If the estimated default probability is greater than P* then the bank will be considered bankrupted, conversely, if the estimated default probability is lower than P*, it will be considered active. Most previous work considers a bank as faulty if its default probability is greater than or equal to 0.5.
Zscore2008 = −6.5238 − 0.245F1−3.0669F2 (7) Zscore2009 = −4.0591 − 0.6651F1+ 2.1396F3 Zscore2010 = −4.9435 − 0.8357F1+ 2.7505F3 Zscore2011 = −7.7326 − 1.1374F1+ 3.6381F3 Zscore2012 = −7.5883 − 0.7508F1−2.1392F2−1.4157F3−0.6151F4 Zscore2013 = −8.2816 + 0.4643F1−3.1646F2−0.3756F3
For 2008, only F1 and F2 are significant with a value of R2equal to 50.72%. For 2009,
the level of R2 is relatively low (47%) and only F1 and F3 are significant. In general, we
found the same results for 2010 and 2011. For 2012, the model is very satisfactory with
R2 value close to 75%. All factors are significant. For the last year, the quality of the
regression is good. All of F1, F2 and F3 are significant at the 5% level.(Table 11, Table 12)
For 2008 and 2012, all the significant factors are negatively related to the score of the bank. This means that an improvement in the asset quality, a better profitability, a high level of equity and a sufficient level of liquidity will increase the score of the bank and reduce the probability of default.
For 2009, 2010 and 2011, the factor F3 was positively related to the score. In fact, a low level of equity increases the probability of default of the bank. For 2013, factor F1 is positively related to the score, meaning that the rise of this factor (bad asset quality) will penalize the bank with a high probability of default.To sum up, all variables (ratios) have the expected signs.
4.3 Evaluation of the models
To evaluate the prediction performance of DA and Logit models, we consider type I/II error rates. They can be measured by a confusion matrix shown in Table 13. This matrix summarizes the correct and incorrect classifications that models produced for our data-set. Rows and columns of the confusion matrix correspond to the true and predicted classes respectively. The error type I is the error of not rejecting a null hypothesis when the alternative hypothesis is the true state of nature. This latter concern the prediction error of the classifier which incorrectly classifies the bankrupted bank into non-bankrupted bank. Thus, error type II presents the rate of prediction errors of a classifier to incorrectly classify the non-bankruptcy bank into bankrupted bank. As consequence, a natural criterion for judging the performance of a classifier is the probability for making a misclassification error.
We consider an early warning model as good when it delivers a low probability of committing error Type I and avoid classifying a failed bank in to the group of non-bankrupted banks.
For the prediction accuracy of the (CDA) model we proceed by two approaches to select the best cut-off score.
In the first one, we calculate the cut-off score.
In literature and according to Canbas et al. (2005), the default cut-off value in two class classifiers is approximately equal to zero and computed by the equation below:
Cut − Of f = (N1D1+ N0D0)
(N1+ N0) (8)
Where
• N1 :number of bankrupted bank
• D1 :average score for bankrupted bank
• N0 :number of non-bankrupted bank
• D0 :average score for non-bankrupted bank
But, if the two classes are asymmetric and unequal in term of size, the optimal cutting score for a discriminant function is the weighted average of the group centroids Hair et al. (2010).The formula for calculating the critical score between two groups is:
Cut − Of f = (NAZB+ NBZA)
(NA+ NB) (9)
Where ZA and ZB are the centroids for group A and B and NA and NB are the
number of banks in each group. This formula is adopted in our paper for the (CDA) analysis. The second methodology to select the optimal cutting score is based on the Receiver operating characteristics (ROC curve) graphs.
After, we classify bank in failed or healthy group according to the comparison between D-score and the cut-off score:
• if D-score > cut-off, the bank is classified to the non bankrupt group • if D-score < cut-off, the bank is classified to the bankrupted group
From the results in tables 14 and 17, we can observe that the average correct classifi-cation rate is about 90%. For example, in 2008, the number of miss-classified bankrupt bank is 10 (error type I is equal to 27.03%). 79 healthy banks were classified in the FB group (type II error 6.55%). Looking more closely at our database, we found that among these 79 banks predicted to failing banks, 75 banks will actually fail during the years 2009, 2010 and 2011.
In 2009, type II error is equal to 11.31%. By scrutinizing the state of these banks that are considered by the (CDA) model as bankrupted, we find that they go bankruptcy in the years following. The model is quite severe in its classification and penalizes some
banks even before they were to fail. The results of the discriminant analysis for the year 2012 were significant. Indeed, the model was able to correctly predict 97.62% of banks. 10 failed banks were classified in the group of NFB (30.30% type I error) and 11 healthy banks were allocated to the FB group (1.29% type II error). Among active banks classified bankrupt, actually seven banks will go bankrupt in the year 2013.
In 2013, the discriminant function deliver a good rate of 98.82% ranking. In other words, the model has failed to correctly classify banks 1.18%. Indeed, five failed banks were predicted as active banks (33.33% type I error) and 5 active banks were allocated to the FB group (type II error 0.6%).
To sum up, with the canonical discriminant analysis we obtained good prediction rates of about 92.85%, 87.36%, 89.99%, 93.52%, 97.62% and 98.82% for respectively 2008, 2009, 2010, 2011, 2012 and 2013 years. We also noted that the type II error rate is relatively high (6.55%, 11.31%, 9.2%, 5.54%, 1.29% and 0.6% for the years 2008, 2009, 2010, 2011, 2012 and 2013). This means that some non-failed banks were predicted as failed banks. Therefore, and after analyzing our database, we can conclude that discriminant analysis predicts the failure of banks in the years ahead.
Finally according to the best cut-off obtained via the ROC curve methods, we obtain results in term of accuracy (classification rate), Type I, type II error, sensitivity and specificity which are presented in table 17.
The optimal critical point corresponds to the value which minimizes both the error of the type I (bankrupted banks classified in the group of the non-failed banks) and the error of the type II (active banks classified like failing). It is also the value which makes it possible to maximize sensitivity (correctly classified failing banks) and specificity (active banks correctly assigned to the group of the non-failing banks).
The application of the research of the critical point in the (CDA) model gives the following results: in 2008, according to figures 1 and 2, the optimal threshold is reached at the value of -1.4306. The discriminating analysis succeeded in classifying 91.72% of the banks in the adequate groups. Indeed, 86.49% of the defaulted banks and 91.88% of the non-failed banks were correctly classified. Among, the 37 failing banks, 32 banks were assigned to the group of the banks in bankruptcy. On the other hand, 5 banks in bankruptcies were classified in the group of the non-failed banks (error type I : 13.51%). Moreover, 98 active banks were declared like failing banks (error type II was 8.12%).
In 2009, the model made it possible to classify 90.83% of the banks correctly. 77.86% from the failing banks and 92.4% of the non-failed banks were correctly classified. Ac-cording to the confusion matrix, we notice that 29 failing banks were assigned to the group of the healthy banks (error type I was 22.14%) and 82 active banks were classified as failing banks (error type II of 7.60%).
For the year 2010, the discriminating analysis succeeded in classifying 95.37% of the banks correctly. Indeed, 84.43% of the failing banks and 96.76% of the non-failed banks were assigned to their adequate group. Among the 122 failing banks, 19 banks were classified as non-failed banks (error type I 15.57%). 3.24% of the healthy banks were classified as failing banks.
Indeed, 91.78% of the failing banks and 97.29% of the non-failed banks were correctly classified. Conversely, 6 banks of the failed group were predicted as healthy banks (error type I was 8.22%).
In 2012, the best critical point took the value of -1.8593 and made it possible to classify 99.77% of the banks correctly. Indeed, the discriminating model made it possible to classify all the healthy banks in the group of the non-failed banks (specificity 100%). Yet, 2 banks among the 33 failing banks were classified in the group of the non-failed banks (error type I 6.06%).
The same results are observed for the year 2013. With a cut-off of -0.9216, the rate of correct classification is of 99.76% and all of the non-failed banks were correctly classified (specificity 100%).
We can conclude that the Canonical Discriminant Analysis classify correctly on av-erage 95.7% of banks in the appropriate groups.
In 2008, the Discriminant Analysis was able to classify 91.72% of banks in the ap-propriate groups. The results in the following years show an increase in the accuracy of the model. We notice that the rate of the correct classification was improved pass-ing from 91.72 % in 2008 to 99.76 % in 2013. Based on the confusion matrix, we note that the rate of misclassification of the active banks tend to decrease over the years (from 8.12% in 2008 to 2.71% in 2011). In addition to that, for the period spanning between 2012-2013 the model classify correctly all active banks (error type II : 0.00%). The obtained results indicate that the discriminant analysis does not correctly classified bankrupt banks. Indeed, we found that the error Type I rates are relatively high. For example in 2009, 22.14% failed banks were allocated to active banks group.
The model seems to be very effective for the years 2012 and 2013. The banks were able to clean up their balance sheet and to recover after the crisis (years 2008 and 2009.) For the prediction accuracy of the Logit model, we Firstly compared the probability of default obtained from the scoring function with the theoretical threshold (probability of default =0.5). After, we used the ROC curve to find the best cut-off point which minimizes the overall error (sum of error type I and error type II).
According to the results in Tables 15 and 17, we observe that the Logistics regression allows to have a satisfactory overall result in terms of correct classification rate (97.83%, 92.56%, 94.35%, 96.24%, 97.85% and 98.47% for the years 2008, 2009, 2010, 2011, 2012 and 2013). The Logit model permits to classify correctly 99.75%, 97.59%, 97.60%, 97.62%, 99.06% and 99.52% of the non-failed banks over the period 2008-2013. In this sense, the model misclassify only 0.33%, 2.41%, 2.4%, 2.38%, 0.94% and 0.48% of the non failed banks (error type II). In the other hand, we obtained a higher error rate type I (62.16%, 48.85%, 38.15%, 20.55%, 33.33% and 60%) which means that the model was not able to classify correctly the bankrupt banks.
The research of the critical point by the ROC curve in the Logit model gives the following results (Table 16):
In 2008, the best critical point corresponds to the value of 0.0402 (cf. figures 1 & 2) the model of the logistic regression makes it possible to obtain a rate of good ranking of 92.36%. Thus, 7.64% of the banks were not correctly classified. Indeed, 4 failing banks
were assigned to the classes of the non-failed banks (error type I was 10.81%). On the other hand, 91 healthy banks were predicted as failing (error type II was 7.54%).
The results of year 2009 show a rate of bad classification of about 16.12% which means that 83.88% of the banks were correctly classified. The confusion matrix also shows that 12 failing banks were assigned to the group of healthy banks (error type I 9.16%). However, 183 healthy banks were declared like failing banks (error type II 16.96%).
For the year 2010, the Logistic regression did not succeed in classifying 10.10% of the banks correctly. Indeed, 8 failing banks were assigned to the group of healthy banks (error type I = 6.56%) and 101 healthy banks were classified as failing banks (error type II 10.55%). The Logit model made it possible to correctly classify 93.44% from failing banks and 89.45% of non-failed banks.
For the year 2011, 100% of failing banks were correctly classified. According to the confusion matrix, we noticed that 70 active banks were assigned to the group of failing banks (error type II 7.92%).
The same results are observed in 2012 and 2013 in terms of sensitivity (100%)which means that the Logit model classify correctly all the failed banks (error type I 0%)
As a conclusion, one can say that the results of the logistic regression are overall satisfactory in terms of % of error type I. (0% per 2011, 2012 and 2013 - % of failed banks correctly predicted). We also validated that the error rate of the type I is larger with the discriminating analysis than with the Logit model over the whole period of analysis. Using the matrices of confusion, we could also check that the discriminating analysis does not manage to detect the banks which are really in bankruptcy. On the other hand, with the Logit model, the error of classification of the failing banks in the group of the active banks is not very high.
It is clear that for the years from 2011 to 2013, the Logit model classifies the whole of the failing banks correctly (sensitivity 100%). The discriminating analysis makes it possible to have weaker error rates of the type II (8.12%; 7.60%; 3.24%; 2.71%; 0.00% and 0.00% against 7.54%; 16.96%; 10.55%; 7.92%; 6.46% and 3.23% for the Logit model over the period 2008-2013). This shows the supremacy of the logistic regression in term of forecast of failure. For example, for the year 2009, among the 183 banks predicted like failing, 163 banks really will default in the following years.
Lastly, for better apprehending the impact of the choice of the cut-off on the clas-sification and the forecast in the two models applied, we propose to compare results (average of values obtained on the totality of the period of 2008 to 2013 for the whole set of parameters of the obtained matrices of confusions (Table 18)).
For that purpose, we compared the results of the probability of default and the D-score derived from the score function with the following thresholds:
• The theoretical threshold (P*= 0.5; critical cut-off for the DA) • The critical point obtained by the ROC curve
For the Logistic analysis, the results show the supremacy of the latter to generate better results in term of rate of good classification on average about 96.22% with a
theoretical cut-off of 0.5. However, by calculating the probability of default with the critical limit of the ROC curve, the Logistic regression makes it possible to reduce the error type I (4.42% (ROC) against 42.67% (theoretical cut-off)). Furthermore, by using the theoretical score, the Logit model permits to classify on average 98.51% of the non-failed banks. On the other hand, by using the critical score of the ROC curve, we obtained success rates of classification of the non-failed banks on average 91.22%. For type II error, which informs us about the predictive power of the model to detect defaulted banks, we demonstrate the supremacy of the Logit model using the optimal cut-off of the ROC curve (average error type II: 1,49% (theoretical cut-off) against 8,78% (ROC)).
The comparison of the overall results of the discriminant analysis show that the model using the optimal cut-off of the ROC curve abtain more accurate results in term of average correct classification (95.72% against 93.36% (theoretical cut-off)).
We also observed that the Discriminant Analysis with a cut-off of the ROC curve reduce on average the error type I (24.74% vs 13.14%) and the error type II (5.75% vs 3.61%).
For error type II , which informs us about the predictive power of the model to detect defaulted banks, and for error type I which provides information on the capacity of the model to recognize the failing banks, we demonstrate the supremacy of the Logit model using the optimal cut-off of the ROC curve.
5
Conclusion
This paper shows how accurately U.S bank failures can be predicted with Logit and Canonical Discriminant Analysis models by utilizing CAMEL’s Variables.
First, Principal Component Analysis (PCA) was performed to compress the data dimension by keeping only the most important ratio combinations.
We compared different cut-off point formulas to provide and evaluate classification accordingly.
Our results confirm, first that the more accurate the theoretical critical probabil-ity of default value are, the more accurate the sensitivprobabil-ity of the model. In this sense comparative results over the entire period prove that correct classification was improved with the ROC curve cut-off value for both Logit and DA model. The first finding proves that sensitivity of classification is improved and in average Logit model outperforms DA (95.58% vs 86.86%).
The second finding concerns the supremacy of ROC curve validation concerning the quality of the model by minimizing the error of misclassification of bankrupt banks: only 4.42% in average and 0% in both 2012 and 2013.
Third, in term of correct classification (both for failed and non-failed banks) we prove that DA is better by using theoretical probability of default 0.5 (96.22% against 93.36%). Finally, models were used to provide early warning signals. Moreover, The combina-tion of the two models allows a better informacombina-tion about the future prospect of banks. Indeed, ROC curve validation emphasizes better prediction of bank failure because it
delivers, in average, the highest error type II 8.78%. This means that the model classifies some solvable banks in bankrupt group. So, we can conclude that the Logit was able to predict the failure of banks. Thus, it gives good signal about banks, which would failed one or two year later.
Overall, the study reveals also that our choice resulting from combinations of ten financial ratios which represent Capital adequacy, Assets quality, Earnings ability and Liquidity are obvious determinants of predicting bankruptcy.
Our results can be used for several purposes. For instance, regulators and banks can predict problems in order to avoid financial distress which can lead to bankruptcy. This improves banking supervision to establish supervisory guidelines. In fact, our method-ological framework helps to construct an Early Warning System that can be used by supervisory authorities to detect banks that present significant and serious risks.
References
Adya, M. and Collopy, F. (1998). How e! ective are neural networks at forecasting and prediction? a review and evaluation. J. Forecasting, 17:481–495.
Altman, E. I. (1968). Financial ratios, discriminant analysis and the prediction of cor-porate bankruptcy. The journal of finance, 23(4):589–609.
Altman, E. I. (1984). A further empirical investigation of the bankruptcy cost question.
The Journal of Finance, 39(4):1067–1089.
Altman, E. I. and Narayanan, P. (1997). An international survey of business failure classification models. Financial Markets, Institutions & Instruments, 6(2):1–57. Avery, R. B., Hanweck, G. A., et al. (1984). A dynamic analysis of bank failures.
Technical report, Board of Governors of the Federal Reserve System (US).
Aziz, M. A. and Dar, H. A. (2004). Predicting corporate financial distress: Whither do we stand? Department of Economics, Loughborough University.
Balcaen, S. and Ooghe, H. (2006). 35 years of studies on business failure: an overview of the classic statistical methodologies and their related problems. The British
Account-ing Review, 38(1):63–93.
Balcaen, S., Ooghe, H., et al. (2004). Alternative methodologies in studies on business failure: do they produce better results than the classical statistical methods? Vlerick
Leuven Gent Management School Working Papers Series, (16).
Barr, R. S., Siems, T. F., et al. (1994). Predicting bank failure using dea to quantify management quality. Technical report, Federal Reserve Bank of Dallas.
Barth, J. R., Brumbaugh, R. D., Sauerhaft, D., Wang, G. H., et al. (1985). Thrift institution failures: causes and policy issues. In Federal Reserve Bank of Chicago
Beaver, W. H. (1966). Financial ratios as predictors of failure. Journal of accounting
research, pages 71–111.
Benston, G. J. (1985). An analysis of the causes of savings and loan association failures. Salomon Brothers Center for the Study of Financial Institutions, Graduate School of Business Administration, New York University.
Bilderbeek, J. (1979). Empirical-study of the predictive ability of financial ratios in the netherlands. Zeitschrift fur Betriebswirtschaft, 49(5):388–407.
Canbas, S., Cabuk, A., and Kilic, S. B. (2005). Prediction of commercial bank failure via multivariate statistical analysis of financial structures: The turkish case. European
Journal of Operational Research, 166(2):528–546.
Coakley, J. R. and Brown, C. E. (2000). Artificial neural networks in accounting and finance: Modeling issues. International Journal of Intelligent Systems in Accounting,
Finance & Management, 9(2):119–144.
Dabos, M. and Sosa-Escudero, W. (2004). Explaining and predicting bank failure using duration models: The case of argentina after the mexican crisis. Revista de Análisis
Económico, 19(1).
Dimitras, A. I., Zanakis, S. H., and Zopounidis, C. (1996). A survey of business failures with an emphasis on prediction methods and industrial applications. European Journal
of Operational Research, 90(3):487–513.
Du Jardin, P. (2010). Predicting bankruptcy using neural networks and other classi-fication methods: The influence of variable selection techniques on model accuracy.
Neurocomputing, 73(10):2047–2060.
Frydman, H., Altman, E. I., and KAO, D.-L. (1985). Introducing recursive partitioning for financial classification: the case of financial distress. The Journal of Finance, 40(1):269–291.
Hair, J., Black, W., Babin, B., and Anderson, R. (2010). Multivariate data analysis: a global perspective, pearson. Upper Saddle River, NJ.
Hassan Al-Tamimi, H. A. and Charif, H. (2011). Multiple approaches in performance assessment of uae commercial banks. International Journal of Islamic and Middle
Eastern Finance and Management, 4(1):74–82.
Jagtiani, J., Kolari, J., Lemieux, C., Shin, H., et al. (2003). Early warning mod-els for bank supervision: Simpler could be better. ECONOMIC
PERSPECTIVES-FEDERAL RESERVE BANK OF CHICAGO, 27(3):49–59.
Jo, H., Han, I., and Lee, H. (1997). Bankruptcy prediction using case-based reason-ing, neural networks, and discriminant analysis. Expert Systems with Applications, 13(2):97–108.
Keasey, K. and Watson, R. (1991). Financial distress prediction models: A review of their usefulness1. British journal of Management, 2(2):89–102.
Kolari, J., Caputo, M., and Wagner, D. (1996). Trait recognition: An alternative ap-proach to early warning systems in commercial banking. Journal of Business Finance
& Accounting, 23(9-10):1415–1434.
Kolari, J., Glennon, D., Shin, H., and Caputo, M. (2002). Predicting large us commercial bank failures. Journal of Economics and Business, 54(4):361–387.
Kumar, P. R. and Ravi, V. (2007). Bankruptcy prediction in banks and firms via sta-tistical and intelligent techniques–a review. European journal of operational research, 180(1):1–28.
Lanine, G. and Vander Vennet, R. (2006). Failure prediction in the russian bank sector with logit and trait recognition models. Expert Systems with Applications, 30(3):463– 478.
Lau, A. H.-L. (1987). A five-state financial distress prediction model. Journal of
ac-counting research, pages 127–138.
Marais, M. L., Patell, J. M., and Wolfson, M. A. (1984). The experimental design of classification models: An application of recursive partitioning and bootstrapping to commercial bank loan classifications. Journal of accounting Research, pages 87–114. Martin, D. (1977). Early warning of bank failure: A logit regression approach. Journal
of banking & finance, 1(3):249–276.
Messier Jr, W. F. and Hansen, J. V. (1988). Inducing rules for expert system de-velopment: an example using default and bankruptcy data. Management Science, 34(12):1403–1415.
Ohlson, J. A. (1980). Financial ratios and the probabilistic prediction of bankruptcy.
Journal of accounting research, pages 109–131.
O’leary, D. E. (1998). Using neural networks to predict corporate failure. International
Journal of Intelligent Systems in Accounting, Finance & Management, 7(3):187–197.
Pantalone, C. C., Platt, M. B., et al. (1987). Predicting commercial bank failure since deregulation. New England Economic Review, (Jul):37–47.
Sinkey, J. F. (1975). A multivariate statistical analysis of the characteristics of problem banks. The Journal of Finance, 30(1):21–36.
Sinkey, J. F. (1978). Identifying" problem" banks: How do the banking authorities measure a bank’s risk exposure? Journal of Money, Credit and Banking, 10(2):184– 193.
Tennyson, B. M., Ingram, R. W., and Dugan, M. T. (1990). Assessing the information content of narrative disclosures in explaining bankruptcy. Journal of Business Finance
& Accounting, 17(3):391–410.
Thomson, J. B. (1991). Predicting bank failures in the 1980s. Economic Review-Federal
Reserve Bank of Cleveland, 27(1):9.
Tsai, C.-F. and Wu, J.-W. (2008). Using neural network ensembles for bankruptcy prediction and credit scoring. Expert Systems with Applications, 34(4):2639–2649. Vellido, A., Lisboa, P. J., and Vaughan, J. (1999). Neural networks in business: a survey
of applications (1992–1998). Expert systems with applications, 17(1):51–70.
Wong, B. K., Bodnovich, T. A., and Selvi, Y. (1997). Neural network applications in business: A review and analysis of the literature (1988–1995). Decision Support
Systems, 19(4):301–320.
Zavgren, C. V. (1985). Assessing the vulnerability to failure of american industrial firms: a logistic analysis. Journal of Business Finance & Accounting, 12(1):19–45.
Zhang, G., Patuwo, B. E., and Hu, M. Y. (1998). Forecasting with artificial neural networks:: The state of the art. International journal of forecasting, 14(1):35–62. Zopounidis, C. and Dimitras, A. (1993). The forecasting of business failure: Overview
of methods and new avenues. Applied Stochastic Models and Data Analysis, World
Scientific Publ., London.
List of Tables
1 Data analysis . . . 22 2 Means of the ten variables . . . 23 3 Correlation coefficients between the explanatory variables and the
depen-dent variable . . . 24 4 Correlation Matrix . . . 25 5 Results of Bartlett’s test of sphericity and KMO . . . 26 6 Eigenvalues of the factors . . . 27 7 Factors Loading . . . 28 8 Factor scores coefficient matrix . . . 29 9 Statistics of the estimated CDA model . . . 29 10 Factor Structure Matrix - Correlations . . . 30 11 Significance tests of factors . . . 31 12 Statistical tests of Logit models . . . 32 13 Confusion Matrix . . . 32 14 Results of DA confusion matrix . . . 33 15 Results of Logit . . . 33
16 classification results with ROC curve . . . 34 17 Comparaison . . . 35 18 Average Results . . . 36
List of Figures
1 ROC curve CDA vs Logit regression . . . 37 2 Best cut off point that maximizes the sensitivity and the specificity . . . . 39 3 Error type I and II : Logit vs CDA . . . 41
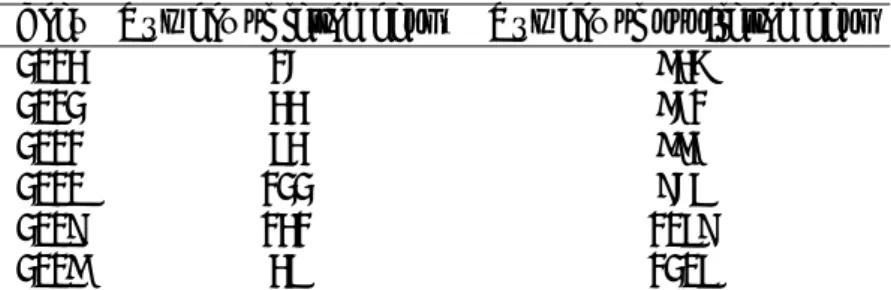
Table 1: Data analysis Year Number of failed banks Number of non-failed bank
2013 15 836 2012 33 851 2011 73 884 2010 122 957 2009 131 1079 2008 37 1207
Table 2: Means of the ten variables
Variable Years NAB AB Variable Years NAB AB
EQTA 2008 3.74% 10.33% EQTL 2008 5.43% 16.57% 2009 1.48% 9.72% 2009 2.27% 16.07% 2010 1.32% 10.04% 2010 1.91% 17.11% 2011 1.04% 10.76% 2011 1.60% 18.94% 2012 0.51% 11.13% 2012 0.86% 20.32% 2013 1.13% 11.34% 2013 1.87% 19.83%
Variable Years NAB AB Variable Years NAB AB
NPLTA 2008 13.35% 2.64% NPLGL 2008 17.75% 3.58% 2009 11.82% 3.49% 2009 16.27% 4.92% 2010 12.95% 3.12% 2010 17.83% 4.57% 2011 11.97% 2.54% 2011 17.25% 3.87% 2012 10.23% 1.94% 2012 16.38% 3.04% 2013 9.39% 1.47% 2013 14.01% 2.32%
Variable Years NAB AB Variable Years NAB AB
LLRTA 2008 3.27% 1.23% LLRGL 2008 4.39% 1.71% 2009 3.43% 1.47% 2009 4.73% 2.11% 2010 3.46% 1.46% 2010 4.75% 2.17% 2011 3.59% 1.32% 2011 5.17% 2.02% 2012 3.03% 1.17% 2012 4.75% 1.85% 2013 2.96% 1.06% 2013 4.39% 1.68%
Variable Years NAB AB Variable Years NAB AB
ROA 2008 -5.53% -0.50% ROE 2008 -155.24% -9.42% 2009 -6.27% -0.90% 2009 1266.86% 15.53% 2010 -3.51% -0.30% 2010 -306.91% -21.03% 2011 -2.84% 0.21% 2011 6.11% -5.23% 2012 -2.90% 0.60% 2012 -1016.60% 4.68% 2013 -1.91% 0.70% 2013 -1076.54% 7.01%
Variable Years NAB AB Variable Years NAB AB
TLTD 2008 83.08% 91.13% TDTA 2008 0.8673 78.47% 2009 75.80% 82.63% 2009 91.17% 80.93% 2010 75.51% 80.13% 2010 91.84% 81.67% 2011 70.94% 77.79% 2011 92.73% 81.43% 2012 64.77% 76.51% 2012 94.71% 81.59% 2013 66.43% 77.73% 2013 94.65% 81.43%
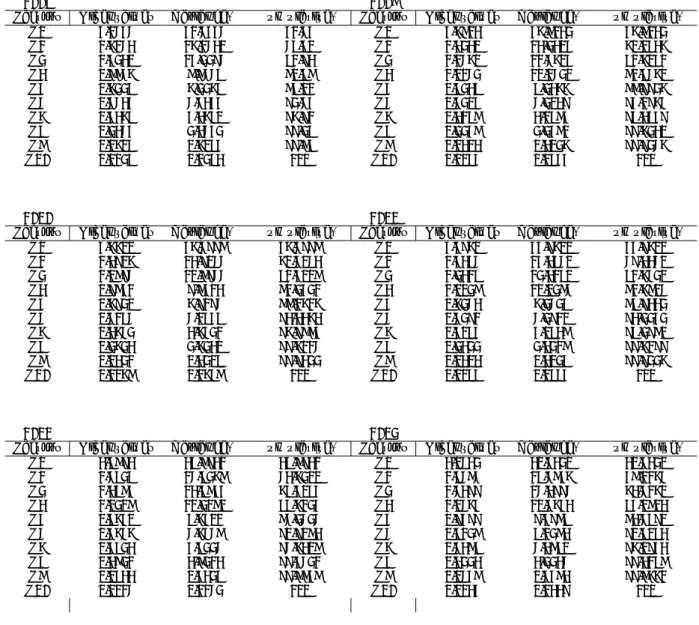
Table 3: Correlation coefficients between the explanatory variables and the dependent variable Variables 2008 2009 2010 2011 2012 2013 EQTA -0,2210* -0,5056* -0,5486* -0,5260* -0,4347* -0,2795* EQTL -0,1058* -0,2764* -0,3043* -0,2774* -0,1712* -0,1311* NPLTA 0,4146* 0,4729* 0,5974* 0,5944* 0,5487* 0,4556* NPLGL 0,4122* 0,4713* 0,5861* 0,5856* 0,5740* 0,4469* LLRTA 0,3227* 0,4278* 0,4628* 0,5214* 0,4456* 0,3777* LLRGL 0,3116* 0,4202* 0,4454* 0,5162* 0,4472* 0,3347* ROA -0,3339* -0,4925* -0,4020* -0,4382* -0,4872* -0,3162* ROE -0,2811* 0,0420 -0,1586* 0,0087 -0,2885* -0,2697 TLTD -0,0586** -0,1068* -0,0587*** -0,0822** -0,1042* -0,0672** TDTA 0,1129* 0,2683* 0,2686* 0,2483* 0,2094* 0,1457*
Table 4: Correlation Matrix
2008
Variables EQTA EQTL NPLTA NPLGL LLRTA LLRGL ROA ROE TLTD TDTA
EQTA 1 0,6373 -0,2858 -0,2835 -0,2413 -0,1933 0,1594 0,1659 0,0397 -0,2745 EQTL 0,6373 1 -0,1906 -0,1427 -0,2028 -0,0521 0,0898 0,0837 -0,3372 -0,1846 NPLTA -0,2858 -0,1906 1 0,9784 0,6925 0,6330 -0,5540 -0,3109 -0,0305 0,1964 NPLGL -0,2835 -0,1427 0,9784 1 0,6644 0,6526 -0,5578 -0,3255 -0,0983 0,1748 LLRTA -0,2413 -0,2028 0,6925 0,6644 1 0,9161 -0,6006 -0,3037 0,0713 0,1419 LLRGL -0,1933 -0,0521 0,6330 0,6526 0,9161 1 -0,5567 -0,3000 -0,0981 0,1047 ROA 0,1594 0,0898 -0,5540 -0,5578 -0,6006 -0,5567 1 0,4447 0,0649 -0,1431 ROE 0,1659 0,0837 -0,3109 -0,3255 -0,3037 -0,3000 0,4447 1 0,0720 -0,1013 TLTD 0,0397 -0,3372 -0,0305 -0,0983 0,0713 -0,0981 0,0649 0,0720 1 -0,4065 TDTA -0,2745 -0,1846 0,1964 0,1748 0,1419 0,1047 -0,1431 -0,1013 -0,4065 1 2009
Variables EQTA EQTL NPLTA NPLGL LLRTA LLRGL ROA ROE TLTD TDTA
EQTA 1 0,6472 -0,5584 -0,5505 -0,5019 -0,4653 0,5951 0,0497 0,1005 -0,4105 EQTL 0,6472 1 -0,3528 -0,3311 -0,3462 -0,2631 0,3496 0,0274 -0,2926 -0,2744 NPLTA -0,5584 -0,3528 1 0,9795 0,6452 0,5984 -0,6503 -0,1281 -0,0430 0,2840 NPLGL -0,5505 -0,3311 0,9795 1 0,6096 0,5986 -0,6525 -0,0908 -0,1180 0,2663 LLRTA -0,5019 -0,3462 0,6452 0,6096 1 0,9643 -0,7071 -0,0790 0,0015 0,2305 LLRGL -0,4653 -0,2631 0,5984 0,5986 0,9643 1 -0,7099 -0,0541 -0,1353 0,1945 ROA) 0,5951 0,3496 -0,6503 -0,6525 -0,7071 -0,7099 1 0,0511 0,1502 -0,3255 ROE 0,0497 0,0274 -0,1281 -0,0908 -0,0790 -0,0541 0,0511 1 -0,0143 -0,0366 TLTD 0,1005 -0,2926 -0,0430 -0,1180 0,0015 -0,1353 0,1502 -0,0143 1 -0,2911 TDTA -0,4105 -0,2744 0,2840 0,2663 0,2305 0,1945 -0,3255 -0,0366 -0,2911 1 2010
Variables EQTA EQTL NPLTA NPLGL LLRTA LLRGL ROA ROE TLTD TDTA
EQTA 1 0,6178 -0,5878 -0,5850 -0,5066 -0,4792 0,5649 0,1448 0,0956 -0,4045 EQTL 0,6178 1 -0,3720 -0,3512 -0,3673 -0,2883 0,3288 0,0809 -0,2476 -0,2489 NPLTA -0,5878 -0,3720 1 0,9801 0,6528 0,6161 -0,6309 -0,1195 -0,0016 0,2629 NPLGL -0,5850 -0,3512 0,9801 1 0,6190 0,6200 -0,6341 -0,1278 -0,0694 0,2521 LLRTA -0,5066 -0,3673 0,6528 0,6190 1 0,9618 -0,6362 -0,1029 0,1740 0,1809 LLRGL -0,4792 -0,2883 0,6161 0,6200 0,9618 1 -0,6384 -0,1062 0,0203 0,1663 ROA 0,5649 0,3288 -0,6309 -0,6341 -0,6362 -0,6384 1 0,1964 0,1234 -0,2862 ROE 0,1448 0,0809 -0,1195 -0,1278 -0,1029 -0,1062 0,1964 1 0,0121 -0,0343 TLTD 0,0956 -0,2476 -0,0016 -0,0694 0,1740 0,0203 0,1234 0,0121 1 -0,3190 TDTA -0,4045 -0,2489 0,2629 0,2521 0,1809 0,1663 -0,2862 -0,0343 -0,3190 1 2011
Variables EQTA EQTL NPLTA NPLGL LLRTA LLRGL ROA ROE TLTD TDTA
EQTA 1 0,6263 -0,5236 -0,5037 -0,4773 -0,4396 0,5324 0,0246 0,1257 -0,3987 EQTL 0,6263 1 -0,3293 -0,2830 -0,3629 -0,2773 0,2924 0,0149 -0,3046 -0,2261 NPLTA -0,5236 -0,3293 1 0,9774 0,6936 0,6604 -0,6104 -0,0334 0,0101 0,1618 NPLGL -0,5037 -0,2830 0,9774 1 0,6558 0,6660 -0,6197 -0,0569 -0,0735 0,1547 LLRTA -0,4773 -0,3629 0,6936 0,6558 1 0,9545 -0,5868 0,0184 0,1671 0,1273 LLRGL -0,4396 -0,2773 0,6604 0,6660 0,9545 1 -0,5956 -0,0220 -0,0256 0,1226 ROA 0,5324 0,2924 -0,6104 -0,6197 -0,5868 -0,5956 1 0,0795 0,1514 -0,2320 ROE 0,0246 0,0149 -0,0334 -0,0569 0,0184 -0,0220 0,0795 1 0,0411 -0,0002 TLTD 0,1257 -0,3046 0,0101 -0,0735 0,1671 -0,0256 0,1514 0,0411 1 -0,3200 TDTA -0,3987 -0,2261 0,1618 0,1547 0,1273 0,1226 -0,2320 -0,0002 -0,3200 1 2012
Variables EQTA EQTL NPLTA NPLGL LLRTA LLRGL ROA ROE TLTD TDTA
EQTA 1 0,4540 -0,3820 -0,3588 -0,3220 -0,2156 0,4467 0,1307 0,0802 -0,3505 EQTL 0,4540 1 -0,2166 -0,1608 -0,2718 -0,1071 0,1589 0,0512 -0,3626 -0,1386 NPLTA -0,3820 -0,2166 1 0,9713 0,5909 0,5393 -0,5006 -0,2203 0,0394 0,0867 NPLGL -0,3588 -0,1608 0,9713 1 0,5562 0,5792 -0,5077 -0,1991 -0,0835 0,0962 LLRTA -0,3220 -0,2718 0,5909 0,5562 1 0,9025 -0,3145 -0,0848 0,2033 0,0635 LLRGL -0,2156 -0,1071 0,5393 0,5792 0,9025 1 -0,3294 -0,0701 -0,1029 0,0609 ROA 0,4467 0,1589 -0,5006 -0,5077 -0,3145 -0,3294 1 0,2335 0,2156 -0,2600 ROE 0,1307 0,0512 -0,2203 -0,1991 -0,0848 -0,0701 0,2335 1 0,0156 -0,0790 TLTD 0,0802 -0,3626 0,0394 -0,0835 0,2033 -0,1029 0,2156 0,0156 1 -0,3036 TDTA -0,3505 -0,1386 0,0867 0,0962 0,0635 0,0609 -0,2600 -0,0790 -0,3036 1 2013
Variables EQTA EQTL NPLTA NPLGL LLRTA LLRGL ROA ROE TLTD TDTA
EQTA 1 0,5373 -0,1598 -0,1294 -0,1388 0,0319 0,2990 0,0792 0,0785 -0,3017
EQTL 0,5373 1 -0,1307 -0,0227 -0,2133 0,0547 0,1075 0,0364 -0,3447 -0,1530
NPLTA -0,1598 -0,1307 1 0,9687 0,5225 0,4388 -0,2611 -0,0514 0,0690 0,0109
NPLGL -0,1294 -0,0227 0,9687 1 0,4837 0,4897 -0,2659 -0,0553 -0,0552 0,0169
Table 5: Results of Bartlett’s test of sphericity and KMO
2008 2009 2010
Bartlett’s test Bartlett’s test Bartlett’s test
CHISQ 10377,26 CHISQ 12095,3 CHISQ 10597,54
d.f. 45 d.f. 45 d.f. 45
p-value 0 p-value 0 p-value 0
KMO 0,6299962 KMO 0,6490987 KMO 0,6334672
2011 2012 2013
Bartlett’s test Bartlett’s test Bartlett’s test
CHISQ 9277,847 CHISQ 7054,398 CHISQ 6082,105
d.f. 45 d.f. 45 d.f. 45
p-value 0 p-value 0 p-value 0
Table 6: Eigenvalues of the factors
2008 2009
Factors Eigenvalues Variance% Cumulative% Factors Eigenvalues Variance% Cumulative% F1 4,1545 41,5445 41,54 F1 4,6813 46,8132 46,8132 F2 1,6153 16,1530 57,70 F2 1,3230 13,2304 60,0436 F3 1,4230 14,2295 71,93 F3 1,1560 11,5604 71,6041 F4 0,8856 8,8557 80,78 F4 1,0152 10,1520 81,7560 F5 0,6227 6,2267 87,01 F5 0,7237 7,2366 88,9926 F6 0,5534 5,5344 92,54 F6 0,5204 5,2039 94,1965 F7 0,4367 4,3670 96,91 F7 0,3178 3,1784 97,3749 F8 0,2354 2,3542 99,27 F8 0,2248 2,2481 99,6230 F9 0,0607 0,6074 99,87 F9 0,0303 0,3026 99,9256 F10 0,0127 0,1273 100 F10 0,0074 0,0744 100 2010 2011
Factors Eigenvalues Variance% Cumulative% Factors Eigenvalues Variance% Cumulative% F1 4,6600 46,5998 46,5998 F1 4,4960 44,9600 44,9600 F2 1,3906 13,9055 60,5053 F2 1,4375 14,3750 59,3350 F3 1,0895 10,8955 71,4008 F3 1,2317 12,3170 71,6520 F4 0,9841 9,8413 81,2421 F4 1,0028 10,0285 81,6805 F5 0,6920 6,9195 88,1616 F5 0,6253 6,2527 87,9332 F6 0,5175 5,1747 93,3363 F6 0,5291 5,2910 93,2242 F7 0,3652 3,6521 96,9884 F7 0,4074 4,0738 97,2980 F8 0,2623 2,6230 99,6115 F8 0,2322 2,3218 99,6199 F9 0,0321 0,3207 99,9322 F9 0,0303 0,3027 99,9226 F10 0,0068 0,0678 100 F10 0,0077 0,0774 100 2012 2013
Factors Eigenvalues Variance% Cumulative% Factors Eigenvalues Variance% Cumulative% F1 3,7893 37,8931 37,8931 F1 3,0532 30,5320 30,5320 F2 1,5727 15,7268 53,6200 F2 1,7585 17,5846 48,1165 F3 1,3784 13,7844 67,4044 F3 1,5399 15,3995 63,5160 F4 1,0208 10,2080 77,6124 F4 1,0564 10,5643 74,0803 F5 0,7640 7,6401 85,2525 F5 0,9499 9,4987 83,5790 F6 0,5656 5,6558 90,9083 F6 0,7128 7,1283 90,7073 F7 0,4723 4,7225 95,6308 F7 0,5387 5,3870 96,0943 F8 0,3821 3,8213 99,4521 F8 0,3223 3,2235 99,3178 F9 0,0433 0,4327 99,8848 F9 0,0548 0,5483 99,8661 F10 0,0115 0,1152 100 F10 0,0134 0,1339 100
Table 7: Factors Loading 2008 2009 Variables F1 F2 F3 Variables F1 F2 F3 F4 EQTA 0,83633 EQTA -0,73457 EQTL 0,92147 EQTL -0,83003 NPLTA -0,86968 NPLTA -0,9166 NPLGL -0,87377 NPLGL -0,90976 LLRTA -0,88724 LLRTA -0,81544 LLRGL -0,87416 LLRGL -0,81241 ROA 0,75857 ROA 0,79376 ROE ROE -0,98403 TLTD 0,87396 TLTD -0,91381 TDTA -0,77505 TDTA 0,56919 0,64032 2010 2011 Variables F1 F2 F3 Variables F1 F2 F3 F4 EQTA 0,50475 -0,69426 EQTA -0,74261 EQTL -0,88276 EQTL -0,85977 NPLTA -0,83952 NPLTA -0,88879 NPLGL -0,83936 NPLGL -0,89173 LLRTA -0,88932 LLRTA -0,87795 LLRGL -0,90309 LLRGL -0,89148 ROA 0,76912 ROA 0,72363 ROE ROE 0,99302 TLTD 0,90043 TLTD 0,9146 TDTA -0,63782 0,51363 TDTA -0,61087 0,58144 2012 2013 Variables F1 F2 F3 F4 Variables F1 F2 F3 F4 EQTA 0,72974 EQTA 0,76275 EQTL 0,80884 EQTL 0,90457 NPLTA -0,81119 NPLTA 0,94051 NPLGL -0,8227 NPLGL 0,94447 LLRTA -0,88558 LLRTA 0,63648 -0,62689 LLRGL -0,90438 LLRGL 0,61686 -0,65394 ROA 0,50323 ROA 0,55196 ROE 0,8728 ROE 0,69764 TLTD -0,81233 TLTD 0,80717 TDTA -0,80568 TDTA -0,65367