HAL Id: hal-02412933
https://hal-cnrs.archives-ouvertes.fr/hal-02412933
Submitted on 16 Dec 2019
HAL is a multi-disciplinary open access
archive for the deposit and dissemination of
sci-entific research documents, whether they are
pub-lished or not. The documents may come from
teaching and research institutions in France or
abroad, or from public or private research centers.
L’archive ouverte pluridisciplinaire HAL, est
destinée au dépôt et à la diffusion de documents
scientifiques de niveau recherche, publiés ou non,
émanant des établissements d’enseignement et de
recherche français ou étrangers, des laboratoires
publics ou privés.
Analysis of slight precipitation in China during the past
decades and its relationship with advanced very high
radiometric resolution normalized difference vegetation
index
Xinyue Li, Yves Balkanski, Zhengfang Wu, Thomas Gasser, Philippe Ciais,
Feng Zhou, Laurent Li, Shu Tao, Shushi Peng, Shilong Piao, et al.
To cite this version:
Xinyue Li, Yves Balkanski, Zhengfang Wu, Thomas Gasser, Philippe Ciais, et al.. Analysis of slight
precipitation in China during the past decades and its relationship with advanced very high radiometric
resolution normalized difference vegetation index. International Journal of Climatology, Wiley, 2018,
38 (15), pp.5563-5575. �10.1002/joc.5763�. �hal-02412933�
Analysis of Slight Precipitation in China during the Past Decades and Its
Relationship with AVHRR NDVI
Xinyue Li1, 2, Yves Balkanski2, Zhengfang Wu3, Thomas Gasser2, 4, Philippe Ciais2, Feng Zhou1, Laurent Li5, Shu Tao1,
Shushi Peng1, 2, Shilong Piao1, Rong Wang2, 6, Tao Wang2, 7, Bengang Li1*
1 Sino-French Institute for Earth System Science, Laboratory for Earth Surface Processes, College of Urban and
Environmental Sciences, Peking University, Beijing 100871, China
2 Laboratoire des Sciences du Climat et de I‘Environnement, CEA-CNRS-UVSQ, 91191 Gifsur-Yvette, France. 3 College of Geographical Sciences, Northeast Normal University, Changchun, Jilin 130024, China
4 Centre International de Recherche en Environnement et Développement CNRS - Ponts ParisTech - EHESS -
AgroParisTech - CIRAD, 94736 Nogent - sur - Marne, France.
5 Laboratoire de Météorologie Dynamique, CNRS, Sorbonne Université, Paris, France 6 Department of Global Ecology, Carnegie Institution for Science, Stanford, California, USA.
7 CAS Center for Excellence in Tibetan Plateau Earth Sciences, Chinese Academy of Sciences, Beijing, China.
Abstract: Precipitation is one of the most important factors determining the occurrence of extreme hydro-meteorological
events and water resource availability. Precipitation in different grades has diverse ecological effects, and slight precipitation (SP, defined as 0.1 - 1.0 mm/day) is the minimal level among them. In this study, we investigated SP trends from 1961 to 2013, as well as the relationship between SP and advanced very high radiometric resolution (AVHRR) normalized difference vegetation index (NDVI) in China during growing season from 1981 to 2006. The distributions and trends of SP were analysed by calculating the daily precipitation data. The average annual slight precipitation amount (SPA) and the number of slight precipitation days (SPD), derived from 839 monitoring stations in China, show a decreasing trend over the last five decades, which is in agreement with total precipitation (TP) but in different rates. When the trend was analysed seasonally, SP in most stations decreases significantly in September-October-November (SON) and June-July-August (JJA), and the largest decrease is found in SON. About 49.5 and 68.7% of monitoring stations show a decreasing trend in SON, in both SPA and SPD, whereas the trend is less popular in March-April-May
(MAM, SPA: 19.7%, SPD: 41.4%) and December-January-February (JJF, SPA: 25.6%, SPD: 43.1%). Moreover, our analysis indicates that the decrease of SP is mainly due to the decrease of SPD as the median amount of daily SP was unchanged over the past five decades (close to 0.3 mm/day). Based on 26-year (1981-2006) semi-monthly AVHRR NDVI data and the records of SP data, the relationship between AVHRR NDVI and SP was also investigated. In regions with lower (<600 mm) TP, the correlation coefficients between NDVI and SP tend to be higher. These results highlight that SP has different effects than TP on vegetation growth. We also analysed time lag effects and concluded that the sensitivity of NDVI to SP for grass vegetation (the correlation coefficient is 0.327) is more noticeable than for trees (0.211) or shrubs (−0.058). The relationship between SP and NDVI also provides us new insights on the dependence of vegetation growth on meteorological factors.
Key words: slight precipitation, multiyear trends, NDVI, growing season, space correlation.
1. Introduction
Climate change has not only beneficial impacts on the natural ecosystem but can also have detrimental influences on the natural ecosystem and human society (IPCC, 2013), and precipitation is among the vital aspects of climate change research. Temperature and precipitation are among the most relevant meteorological variables for hydrological impact studies (Xu, 1999; Bronstert et al., 2007). The latter is also the most important driver for both agricultural production and freshwater resources (Kundzewicz et al., 2007). Thus, as a key physical process, precipitation connects climate, weather and water cycle together (IPCC, 2007). It is noteworthy that precipitation has also changed remarkably over the past few decades in steps with climate change, which was mainly reflected in the increase of total precipitation (TP) in mid- and high latitudes over continental regions (Jones et al., 2007; Trenberth, 2011). China stretches across vast area, covering diverse climate regimes (including low, middle and high latitude) and is subject to the effects of precipitation variation, including floods and droughts (Zhang et al., 2006; Qin et al., 2007; Wang and Zhai, 2008). Therefore, variation and distributions of precipitation in China have received prevalent concerns (Qin and Qian, 2006; Wang et al., 2006; 2011; Min and Qian, 2008; Xu et al., 2014). Further studies showed that, although annual precipitation in China has remained stable over recent decades (Liu et al., 2005), it varied seasonally and regionally (Wang and Zhou, 2005; Zhai et al., 2005; Ma and Fu, 2006). For example, there is more precipitation in winter and summer, but less in spring and autumn, and the amounts of precipitation showed a “+, −, +” pattern from northeast to southwest; it increased in northwest China (NWC) and decreased in north China (NC) (Wang et al., 2006).
According to the China meteorological industry standard norms (Fu et al., 2008; Li et al., 2013), daily precipitation rates at monitoring stations are classified into six grades of intensity. They are trace (no amount), slight (≤ 1 mm/day), small (> 1 mm/day, < 10 mm/day), large (≥ 1 mm/day, < 50 mm/day), heavy (≥ 50 mm/day, < 100 mm/day) and very heavy (≥100 mm/day). Extensive studies mainly pay attention to changes in the last four grades (Fu et al., 2008; Li et al., 2013; Zhang and Wu, 2014), and extreme precipitation events have been the focus of studies (Alexander et al., 2006; Steensen et al., 2011; Shastri et al., 2015). Nevertheless, precipitation in small scale, especially slight precipitation (SP), has not been studied as much before. Hence, the trends of SP as a function of time are poorly understood. In contrast to extreme precipitation, SP is beneficial to plant growth. Extreme precipitation happens generally over a short time span, causing floods and runoff, whereas SP is able to penetrate into the soil, which has a strong effect on soil moisture (Trenberth et al., 2003; Trenberth, 2011). Previous researchers also pointed out that the frequency of days with precipitation is as important as precipitation amount and is more susceptible to climate change (Karl and Knight, 1998; Trenberth et al., 2003). Because of the shortage of studies on SP, there is a considerable research gap in the field of the frequency of days with SP. Here, we address this gap by focusing on both slight precipitation amounts (SPA) and slight precipitation days (SPD) in China. Only a few researchers have investigated the spatio-temporal variation of SP over China (Yan and Yang, 2000; Fu et al., 2008; Gao and Wu, 2014). Some studies found that SP in China shows a consistent decreasing trend, which is reflected in the reduction of drizzle days, particularly over the northern region of China (Yan and Yang, 2000; Qian et al., 2007b; Fu et al., 2008). Nevertheless, these studies did not detail the regional and seasonal SP trend over Mainland China, and this is what this study demonstrates. We analysed a greater number of measuring stations compared to what previous authors have considered. In addition, SP plays an important role in the growth of natural vegetation (Qian et al., 2007a; Zhang and Wu, 2014), while there is no analysis, to our knowledge, of the relationship between SP and the growth condition of vegetation greenness (NDVI) at a national scale. The growing state of the vegetation is linked to climate factors (Jackson et al., 2001; Bonan, 2015) – mainly through temperature and precipitation variations (Prasad et al., 2005). Gomez-Mendoza et al. (2008) pointed out that those changes in precipitation with various time scales have effects on the spatio-temporal variation of NDVI of different vegetation types. Precipitation has proved to be the most important climatic factor that correlates with NDVI, especially in semi-arid areas (Al-Bakri and Suleiman, 2004). Yet, the quantitative relationships between SP and NDVI have not been studied over wide regions of the world.
The purpose of this work is twofold. First is the identification of regional SP trends in China. We characterized the spatio-temporal variation of SP, interannual and seasonal trends of SPA and SPD in eight regions over China using intensive ground meteorological station data from 1961 to 2013; the determination of which one (SPA or SPD) makes the
most important contribution to changes in SP was also discussed. Second was analysing the relationship between SP and natural plants. The correlation coefficients between SP and NDVI during growing season (May to September) for various types and regions in corresponding period (from 1981 to 2006) were documented, and time lag effects were also taken into consideration.
Materials and methods
2.1 Datasets
Climate Data
Daily data from 839 stations were obtained from the Chinese National Meteorological Center (http://data.cma.cn/data/cdcdetail/dataCode/SURF_CLI_CHN_MUL_DAY_V3.0.html), which includes daily maximum surface air temperature, daily minimum surface air temperature and daily TP (including total precipitation amount [TPA] and total precipitation days [TPD]), and the digital display is accurate to one decimal place. Detailed information is listed in Table S1. The number of observational stations in service has changed in number over time as well. In the early 1950s, the number of stations increased from 160 to 400. Since 1958, the number that measure precipitation and temperature has remained at around 660. No measurement protocol changed during our study period. We used this data series of daily precipitation from 1961 to 2013. To avoid biases caused by missing values, we discarded stations where daily precipitation was recorded with missing values of more than 3 months within a single year or more than 12 months over the whole observational period, following Xu et al. (2014). We also applied methods to deal with the problem caused by changing the position of the stations, as Hawkins (1977) did. After considering the homogeneity of station distribution as well, we used daily precipitation data for the analysis, derived from 735 stations in total from 1961 to 2013 (See distribution pattern in Figure 1). For the missing data remaining in these stations, the averages of the nearest four stations were used in place of the absent value in the observational data before the subsequent analysis.
AVHRR NDVI Data
The biweekly NDVI data of 1981–2006 used in this study were obtained from the Pathfinder Data Sets of the EOS (Earth Observation System) data centre in the United States and the GIMMS 2g dataset of NOAA-AVHRR NDVI 15-day synthesized data (http://ecocast.arc.nasa.gov/data/pub/gimms/) from July 1981 to September 2006 (a total of 26 years). The maximum value of the two fortnightly data points was considered a monthly value, and the data resolution is 8 km.
We captured the dataset covering Mainland China.
Vegetation Data
We also analysed the relationship between SP and NDVI of natural vegetation from different types, including coniferous forest, broad-leaved forest, shrub, desert, grassland, grass cluster, meadow and marsh, derived from The Vegetation Map of China IOB (2007). This map was edited by the Institute of Botany, Chinese Academy of Sciences, and was published by China Atlas Press (Figure S1) (http://www.nsii.org.cn/mapvege), depicting the vegetation distribution over the area of this study. We reclassified these several types of natural vegetation into five basic types according to their shapes and habits (Changyong, 2011), namely, trees, shrub, desert, herbage and marsh, for further correlation analysis.
2.2 Methods
We showed the general pattern of SP over the past 50 years via two maps (both SPA and SPD). In order to explore the spatio-temporal variations of SP, first, China was divided into eight regions to analyse the spatial distribution of SP, namely, northeast, NC, central China (CC), northwest, southwest1, southwest2, south China and east China (EC) (Figure 1) following previous studies (Cheng, 1991; DFCH, 2006; IOB, 2007). These eight areas were divided by latitude and longitude, mainly according to ecological factors and geographic conditions (Gu et al., 2017). Second, 3-year moving averages and the accumulative anomaly method were used to analyse the trend of SP as a function of time. Moving average value is calculated from a time series of n to the average of multiple m consecutive sequence; for detailed information and operation, refer to Booth et al. (2006) and Chiarella et al. (2006). Both of these methods are useful for demonstrating long-term trends and are good at presenting turning points.
Seasonal trend
Daily SP was aggregated to seasonal sums of each region, including March to May (MAM), June to August (JJA), September to November (SON) and December to February (DJF). Table 1 shows the statistics of annual SP in China (CN) and in eight regions over the last five decades. A positive kurtosis in China indicates that the concentration of both SPA and SPD around the average is lower than that of normal distribution. Similarly, SPA and SPD in eight regions are not identical to the normal distribution. Therefore, to derive the change of SP in different seasons, we estimated the trends of the SPA and SPD by using a Mann-Kendall trend analysis method for all sites (see detailed method in SI) and the statistical significance of the slope, or its p-value, given by the Student's t test.
Regional climate tendency
In order to analyse the interannual climate tendency, we estimated the trend of SP in the eight regions using least square linear regression of SP (SPA and SPD) against the year. The linear regression ignores the interannual and interdecadal change of small scale while analysing the trends of precipitation; therefore, this method helps us derive the trend of SP in the long term (Ning and Qian, 2008). We derived the SP trend rate by calculating the slope of the least square linear regression; a positive value of the result indicates an “upward trend,” and a negative value of the result indicates a “downward trend” (Xu et al., 2014).
Median method
The median is a popular summary statistic used in descriptive statistics, and it is not skewed so much by extremely large or small values compared to the mean (Rousseeuw and Bassett, 1990). Therefore, we also selected a median amount of daily SP as an indicator to demonstrate whether SPA or SPD contributes more to the variation of SP.
Space correlation
Because the state of crops is affected by human practices, such as irrigation, we restricted the analysis of the relationship between SP and NDVI to natural vegetation. We extracted the spatial distribution ranges of each type of natural vegetation using Geographic Information System (GIS) technology and then overlaid them with the location of each meteorological station. Subsequently, all the monitoring stations corresponding to each category region were marked. Following Li et al. (2002), the NDVI value from the data of AVHRR NDVI was extracted according to the location of the monitoring stations. Then, we calculated monthly maximum NDVI of two biweekly periods in the same month (Li et al., 2002) and monthly SPA and SPD during the growing season, from May to September. Finally, we calculated the correlation coefficients between SP and NDVI for each region of China and vegetation type using Statistical Product and Service Solutions (SPSS) (Spearman as this method is robust to outliers). The correlation coefficients were computed by retaining both the trends in NDVI and in SP series.
3. Results and Discussions
3.1 The spatio-temporal variation of slight precipitation
appear in southwest China (e.g., Sichuan, Guizhou and Chongqing), consistent with Wu (2012). Wu (2012) revealed that light precipitation appears over southwest China primarily. In addition, SPA mainly distributes in the northeastern forest zone and northwest Xinjiang. Minimum SPA values (< 6.0 mm) are found in NWC (e.g., Inner Mongolia and south-central Xinjiang). The SPD distribution shows a similar spatial distribution than SPA (Figure 2b). The SP distribution differs from that of TP in China – the latter one exhibits a gradual decrease from southeast to northwest (Figure S2). This difference is partly explained by the fact that the origin of SP is closely linked with the formation of rain, including convective, local frontal and orographic, while it is more sensitive to environmental factors, such as the variable aerosol particle concentration (Qian et al., 2009), and to orography compared to more intense precipitation in other grades.
The spatial distributions of SPA and SPD over 1961-2013 are shown in Figure 2. Maximum SPA values (> 30.0 mm) appear in Southwest China (e.g. Sichuan, Guizhou and Chongqing), consistent with Wu (2012). SPA also shows large values in the extreme north of Northeast China and Northwest China, corresponding to mountainous areas in mid-latitudes. Minimum SPA values (< 6.0 mm) are found in most areas of NWC (e.g. Inner Mongolia and south central Xinjiang). In a general manner, SPD shows a similar spatial distribution (Figure 2b). It is worth to note that the SP distribution differs significantly from that of total precipitation (TP) in China, the latter exhibiting a gradual decrease from southeast to northwest (Figure S2). This difference is certainly a revelatory element of the fact that SP has its own formation mechanisms and conditions that are distinct from intense precipitations. SP is thought to be more sensitive to environmental factors, such as abundance of aerosol particles (Qian et al., 2009) and to orography.
3.1.1 Long-term trend of SP
Trends of annual SP (SPA and SPD) and 3-year moving averages in the past 50 years are shown in Figure 3. The main information that can be derived from this figure includes the following: the highest SPA 3-year values (18.6 mm) for this moving average analysis occurred from 1964 to 1966, and the lowest one (14.8 mm) occurred from 2007 to 2009. The annual mean SPA indicated an exceptional peak in 1964, reaching 20.0 mm. Low ebb occurred in 2007. Significant decline trends in both SPA (Figure 3, panel a) and SPD (Figure 3, panel b) were observed on these figures. This result confirms the finding in Qian et al. (2009), suggesting that SP underwent a decreasing trend in eastern China over the past 50 years. It is also consistent with Huang and Wen (2013), who analysed drizzles for lands around the globe and found a decreasing trend for China and most of the Eurasian continent. They concluded that the atmospheric stratification stability related to global warming is the possible contributor to the decreasing trend in China from 1961 to 2010,
although the precise cause for the trend of SP in China is still unclear. Some authors also pointed out the important role played by aerosols that may affect precipitations through multiple processes, such as direct radiative effects, nucleation and heating effects of carbonaceous aerosols (Koren et al., 2005; Rosenfeld et al., 2008). Gao and Wu (2014), in a further study, showed that the SP decline in eastern China is largely caused by increases in aerosol loads: regions with higher aerosol optical depth (AOD) (high aerosol load) tend to have more severe decreasing trend in SP.
To describe the spatio-temporal behaviours of SP well, we used the Mann-Kendall Test for each of the 735 monitoring stations over the past 50 years (Figure 4). Results clearly confirm the negative trend identified for the whole of China over the past five decades (SPA: −0.0637 mm/year, p < .05; SPD: −0.3261 days/year, p < .05). In addition, we analyse the spatial distribution of SPA trends for each station (see Figure 4a). SPA shows significant negative trends in the southeast half of China, including the Bohai Bay coast, the NC plain, the middle and lower reaches of the Yangzi River and the southeast hills and most of southwest China (the number of monitoring stations with a positive trend is being very scarce over these regions). Most of the regions where SPA shows positive trends (although not significant) are located in the northwest half of China, including the mountainous areas in northern Xinjiang, Hetao plain and a few areas in the southern part of the Tibetan Plateau. The spatial structure of SPD trend is highly consistent with SPA in China over the last five decades (as shown in Figure 4b). Overall, more than 40% of the 735 monitoring stations show a decreasing trend in both SPA (40.0%) and SPD (66.0%). In conclusion, if we plot an imaginary line from the northeast to southwest (Heihe-Tengchong line; see the red line in Figure 1, which is an important line in China for both physical and human geography [Yue et al., 2003; Chen and Chen, 2008]), we will separate China into two parts. The majority of measuring stations southeast of this line shows a significant negative trend but a positive trend (although not significant) northwest of this line, both in SPA and SPD. Cities located in the southeast of this line are densely populated and well developed, with substantial industrial pollutants and aerosols emissions. However, it is the opposite condition in the northwest regions of Heihe-Tengchong Line. The better ecological environment and special orography might be the reason for fewer aerosols in northwest regions, which would cause an increasing trend of SP at several monitoring stations (Berg, 1971). This result is consistent with the finding of Gao and Wu (2014), who pointed out that, over the last 50 years, with the exception of a few regions in NC, SPA and SPD display a decreasing trend to the east of China.
To complete the analysis performed at each individual station over China over the last five decades, we also investigated climate tendency in eight regions of China. Figure 5 shows regional trends in SPA over the period 1961–2013; these regions are NWC, NC, Northeast China (NEC), SWC1, CC, EC, SWC2 and SC, as well as China as a whole. The climate tendency of these eight regions in China are estimated to be 0.10, −3.80, −0.40, −0.40, −0.80, −1.10, −1.80 and −0.90
mm/10a, respectively. We found that the most pronounced decreasing trends for SPA occur over EC, SC and SWC2, whereas the trend is weaker over CC, NC, NEC and SWC1. For seven regions of eight, except NWC, the climate tendency is statistically significant. Only the climate tendency over the NWC region (p = .57, >.05) is positive and not significant. The climate tendency in China, on average, is estimated to be −0.62 mm/10a, and the decreasing rate reaches 0.33% per year.
We subsequently documented the different climate tendency between SP and TP. The trend in SPA showed a significant decreasing trend in most regions of China, while TPA remained almost unchanged over the past 53 year (see Figures 5 and S3a). The average rate of decrease in SPA is up 0.33% per year, while it was only 0.002% per year for TPA for the whole of Mainland China. Moreover, we figured out that there was 20.6-day decrease for TPD and 17.1-day decrease for SPD over the past five decades (as shown in Figure S3b, c), which indicates a significant decreasing trend for both TPD and SPD. We infer from these numbers that most of the decrease of TPD is attributable to the SPD decrease.
3.1.2 SP variation for different seasons
Table 2 indicates the SP trends in the eight regions of China over the last five decades, for different seasons. As shown in previous studies, e.g. Chen and Lu (1981), climate in China can be fundamentally divided into a monsoon climate and a non-monsoon climate. The latter is mainly represented by the sub-region NWC (Northwest China), and the former is consist of the rest seven regions in this research. The number of stations showing significant decrease trend in NWC is much lower than over any other areas that is dominated by the summer monsoon (see Table 2) in all seasons except JJA. Therefore, we found that the decrease trend of SP in non-monsoon region is the most indistinct during most time of the year, compared with that in monsoon region. (The detailed pattern and seasonal evolution of SP can be found in SI, Figure S4 and S5).
From Table 3, we also derived that most stations show a significant decreasing trend in SON, for both SPA (364 stations, 49.5%) and SPD (505 stations, 68.7%). The number of stations in JJA comes second; there are 222 (30.2%) and 392 (53.3%) stations for SPA and SPD, respectively. The significant decreasing trend is less popular in MAM (SPA: 19.7%, SPD: 41.4%) and DJF (SPA: 25.6%, SPD: 43.1%). Therefore, we concluded that the amount of stations with a significant negative trend tended to occur more in JJA and SON than in MMA and DJF, both for SPA and SPD. The seasonal variation in the trends of both SPA and SPD appear to be related to prevailing meteorological conditions. As precipitation in China is mostly monsoon-driven, in SON, the rainy season has ceased over major regions in China, except for SC and EC. Cold air in NC is powerful during this period, and the southward cold air forces the warm and moist air over land to
retreat to the south. Furthermore, temperature drops sharply in DJF, and evaporation decreases (Miao and Wang, 2007). Weak winter precipitation and evaporation could be the cause for fewer sites with significant variation trends in SP.
The seasonal variation in the trends of both SPA and SPD appear to be related to prevailing meteorological conditions. As precipitation in China is mostly monsoon-driven, in SON, the rainy season has ceased over major regions in China, except for SC and EC. Cold air in NC is powerful during this period, and the southward cold air forces the warm and moist air over land to retreat to the south. Furthermore, temperature drops sharply in DJF, and evaporation decreases (Miao and Wang, 2007). Weak winter precipitation and evaporation could be the cause for fewer sites with significant variation trends in SP.
3.1.3 Daily variation of SP
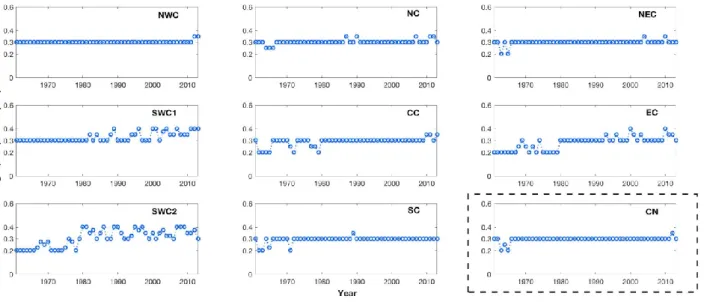
The median amount of daily SP shows almost no change. As can be seen from Figure 6, it is close to 0.3 mm/day in all eight regions, as well as over the whole of China. This median value indicates that the daily SPA has been kept stable over the past 53 years. Considering that there is an obvious decreasing trend of SP amount over the 53 years under study, we attribute this decrease to a decrease in the number of SP days.
3.2 The relationship between slight precipitation and AVHRR NDVI during growing season
We also documented the multiyear trend for NDVI in eight regions and the whole of China, as shown in Figure S6. NDVI trends are generally decreasing as SP does but not in NC and NEC. Therefore, we further performed a spatial correlation for SP and NDVI for different regions and different vegetation types.
3.2.1 Correlation between SP and AVHRR NDVI for different regions
In this section, we investigate the correlation between NDVI and SP in the eight regions over China. The spatial pattern of NDVI/SPD is highly consistent with that of NDVI/SPA (as shown in Figure 7). The correlation coefficient between SP and NDVI generally ranges from −0.33 to 0.51. There are positive values in the north of China, including NEC, NC and NWC, with values ranging from 0.00 to 0.51. In contrast, the correlation coefficient values in the other five regions are negative and range from −0.33 to 0.00.
The spatial distribution of the correlation coefficients between SP and NDVI shown in Figure 7 exhibits a progressive increasing trend from southeast China to NWC. This may be due to a more abundant precipitation condition over
southeast China than over NWC, consistent with our previous speculation. This result suggests that the growing environment for the plant is one of the most important factors affecting the correlation coefficient between SP and NDVI. The maximum value (> 0.35) can be found in the west of NEC and the north region of NWC, while the minimum value (< 0) appears in the south region of China. TP (see Figure S2) within NEC, NC and NWC are at a similar level (< 600 mm/year, relatively less in China), and the long-term correlation coefficients in these regions are positive. Concerning regions with higher TP (> 600 mm/year), the correlation coefficients showed an opposite trend but were not statically significant, and we interpreted it as an indication that there are other causes for variability of these regions. The spatial patterns of extreme value in the correlation coefficient of NDVI/SPD and TP are almost distinct to each other, which means the regions with more precipitations tend to display less correlation coefficients of NDVI/SPA and NDVI/SPD. This may be because that SP does not play a key role on the growing of vegetation in regions with abundant precipitations. In contrast, SP is a necessity for plants growing in arid areas, like NWC, NEC and parts of NC. The local differences between the correlation coefficient of NDVI/SPA and NDVI/SPD are illustrated by the shadowed areas (statistically significant at the 95% [p < .05] level) in Figure 7. Shadow areas in Figure 7b spread over a larger surface than that in Figure 7a. Thus, we infer that SPD has stronger effects on the growth of natural vegetation compared with SPA.
3.2.2 Correlation between SP and AVHRR NDVI for different vegetation types
We investigate the correlation between SP and NDVI for different natural vegetation types (Alpine Vegetation and Mixed Needle leaf and Broad-leaf Forest, covering no monitoring stations, were discarded). There is no significant difference between the correlation coefficients of NDVI and SPA and that of NDVI and SPD. Table 4 shows that the maximum NDVI/SP correlation coefficient occurs six times with SPD and only two times with SPA. This suggests that the degree of correlation between natural vegetation's NDVI and precipitation days is higher than with precipitation amount. The correlation coefficient of NDVI/SPD is also relatively higher than that of NDVI/SPA, as mentioned in section 3.2.1. In addition, we also found that SPA and SPD have lag effects on some kinds of vegetation. For example, coniferous forest, grassland, grass cluster and marsh, and the maximum correlation between NDVI and SP appears to be better correlated with a 1-month or 2-months lag, rather than no lag (Table 4).
Reclassifying the vegetation into five types as shown in Figure 8 shows that the correlation coefficient between herbaceous vegetation NDVI and SP is the highest (only consider the three most common type of vegetation, herbage, trees and shrub here), trees come second, and the least correlated vegetation type appears to be shrubs. This may be
associated with the growing properties of the plant itself, including root system. The roots of shrub vegetation and trees tend to extend deep into the soil, and their sensitivity to SP is much lower than herbaceous vegetation, the roots of which have a relatively shallow extent. Besides, the correlation coefficient between NDVI of desert vegetation and SP (both SPA and SPD) is higher than for any other type of vegetation. We speculate that the growing condition of plants is also of great importance to the correlation coefficient of NDVI/SP. SP is not a vital factor for plants that grow in areas with frequent rainfall, and thus, the correlation coefficient between SP and NDVI is relatively low. On the contrary, for desert plants, they are more dependent on precipitation at small levels. Thus, their sensitivity to SP is more intense.
We are now proposing several future directions to explain the decreasing trend quantified in SP here over China. Qian et al. (2009) discussed the role of human activities in the decrease of SPA and SPD over EC. Gao and Wu (2014) argued that this trend was driven through the relationship between SP and aerosol abundances retrieved through aerosol optical depth. The microphysical interactions between aerosol and clouds are likely to cause this behaviour. Many studies point to the role of modulating the NDVI (Al-Bakri and Suleiman, 2004). Understanding this link will require sorting out the respective roles of meteorological factors, root zone soil moisture and soil physical properties (Cihlar et al., 1991; Schultz and Halpert, 1993). In addition, although the correlation coefficient of NDVI/SP was documented over the last five decades here, at a national scale, we cannot predict how its decreasing trend affects the natural vegetation growth. Such relationships between natural vegetation and SP require a suitable model that includes the effects of SP on plant phenology.
4. Conclusions
This study documents the temporal and spatial SP variation over China and determines the trends of SP by season over the last five decades. Temporal variations of SPA and SPD both show a negative trend from 1961 to 2013, which is in agreement with TP, although at a different speed. It shows seasonal and regional differences as well. Moreover, we identified that the decrease of SPD plays a more important role on the decrease of SP, compared with SPA. Despite the spatio-temporal variation of SP, we also explored the relationship between SP and NDVI during growing season by investigating the correlations between SP and NDVI of various vegetation types. We found that these correlation coefficients between NDVI and SP are stronger in regions with less TP, mainly distributed in desert vegetation. Over these regions, SP has a key influence on the growing condition of vegetation. In addition, SP has the most significant influence on NDVI from the desert, followed by grass and marsh. It has no significant effect on tree or shrub from our results. The relationship between SP and NDVI provides us with new insights on the dependence of natural vegetation
growth on meteorological factors, and people should pay more attention on SP, especially in arid and semi-arid areas.
Acknowledgment
This study was supported by the National Natural Science Foundation of China (Grand No. 41771495) and by the 111 project of the Ministry of Education of China (B14001). The authors are grateful to Haibo Du for his technical support.
References
Al-Bakri, J. & Suleiman, A. 2004. NDVI response to rainfall in different ecological zones in Jordan. International
Journal Of Remote Sensing, 25: 3897-3912.
Alexander, L., Zhang, X., Peterson, T., Caesar, J., Gleason, B., Klein Tank, A., . . . Rahimzadeh, F. 2006. Global observed changes in daily climate extremes of temperature and precipitation. Journal of Geophysical Research:
Atmospheres, 111.
Berg & T., G. O. COLLECTION EFFICIENCY IN WASHOUT BY RAIN. In Proceedings of the Other Information:
From Precipitation scavenging meeting; Richland, Wash. (2 Jun 1970). In Precipitation scavenging (1970). UNCL. Orig. Receipt Date: 31-DEC-71, 1971.
Bonan, G. 2015. Ecological climatology: concepts and applications, Cambridge University Press.
Booth, E. G., Mount, J. F. & Viers, J. H. 2017. Hydrologic Variability of the Cosumnes River Floodplain. San Francisco
Estuary & Watershed Science, 4.
Bronstert, A., Kolokotronis, V., Schwandt, D. & Straub, H. 2007. Comparison and evaluation of regional climate scenarios for hydrological impact analysis: General scheme and application example. International Journal Of
Climatology, 27: 1579-1594.
Changyong, S. 2011. Recognition and proposal on the vegetation classification system of China. Chinese Journal of
Plant Ecology, 35: 882-892.
Chen, J. & Lu, D. 1981. Division of monsoon cimatic regions in China. Journal of Beijing Forestry University, 04. 10.13332/j.1000-1522.
Chen, M. & Chen, J. 2008. Phosphorus release from agriculture to surface waters: past, present and future in China.
Water Science & Technology A Journal of the International Association on Water Pollution Research, 57: 1355.
Cheng, C. 1991. Climate and Agriculture in China, Meteorology Press: Beijing.
Dynamics & Control, 30: 1729-1753.
Cihlar, J., Laurent, L. S.-. & Dyer, J. 1991. Relation between the normalized difference vegetation index and ecological variables. Remote Sensing Of Environment, 35: 279-298.
DFCH. 2006. Standard of Assessing Drought (trial version). Chinese Drought and Flood Control Headquarters.
Fu, J., Qian, W., Lin, X. & Chen, D. 2008. Trends in graded precipitation in China from 1961 to 2000. Advances In
Atmospheric Sciences, 25: 267-278.
Gao, Y. & Wu, J. 2014. The Preliminary Analysis of the Slight Precipitation Effected by Aerosol. Journal of University of
Chinese Academy of Sciences, 31: 314-321.
Gómez-Mendoza, L., Galicia, L., Cuevas-Fernandez, M., Magana, V., Gómez, G. & Palacio-Prieto, J. 2008. Assessing onset and length of greening period in six vegetation types in Oaxaca, Mexico, using NDVI-precipitation relationships. International Journal Of Biometeorology, 52: 511-520.
Gu, F., Zhang, Y., Huang, M., Tao, B., Liu, Z., Hao, M. & Guo, R. 2017. Climate-driven uncertainties in modeling terrestrial ecosystem net primary productivity in China. Agricultural And Forest Meteorology, 246: 123-132. Hawkins, D. M. 1977. Testing a sequence of observations for a shift in location. Journal Of The American Statistical
Association, 72: 180-186.
Huang, G. & Wen, G. 2013. Spatial and temporal variations of light rain events over China and the mid-high latitudes of the Northern Hemisphere. Chinese Science Bulletin, 58: 1402-1411.
IOB. 2007. Vegetation Map of China. Institute of Botany, C. a. o. s. (ed.). Institute of Botany, China Atlas Press, Chinese academy of science: Beijing.
IPCC. 2007. Climate Change 2007, The Physical Science Basis. Contribution of Working Group I to the Fourth Assessment Report of the Intergovernmental Panel on Climate Change. Cambridge University Cambridge, United Kingdom 499-587.
IPCC. 2013. Climate Change 2013, The Physical Science Basis. Contribution of Working Group I to the Fifth Assessment Report of the Intergovernmental Panel on Climate Change. Cambridge University Cambridge, United Kingdom 499-587, 434-497.
Jackson, R. B., Lechowicz, M. J., Li, X. & Mooney, H. A. 2001. Phenology, growth, and allocation in global terrestrial productivity. Terrestrial Global Productivity: 61-82.
Jones, P., Trenberth, K., Ambenje, P., Bojariu, R., Easterling, D., Klein, T., . . . Soden, B. 2007. Observations: surface and atmospheric climate change. Climate change 2007: the physical science basis. Contribution of Working Group I
Karl, T. R. & Knight, R. W. 1998. Secular trends of precipitation amount, frequency, and intensity in the United States.
Bulletin Of The American Meteorological Society, 79: 231-241.
Koren, I., Kaufman, Y. J., Rosenfeld, D., Remer, L. A. & Rudich, Y. 2005. Aerosol invigoration and restructuring of Atlantic convective clouds. Geophysical Research Letters, 32.
Kundzewicz, Z., Mata, L., Arnell, N., Döll, P., Kabat, P., Jiménez, B., . . . Shiklomanov, I. 2007. Freshwater resources and their management.[W:] Climate Change 2007: Impacts, Adaptation and Vulnerability. Contribution of Working Group II to the Fourth Assessment Report of the Intergovernmental Panel on Climate Change,(red. Parry, ML, Canziani, OF, Palutikof, JP, Hanson, CE & van der Linden, PJ). Cambridge University Press, Cambridge, UK.
Li, B., Tao, S. & Dawson, R. 2002. Relations between AVHRR NDVI and ecoclimatic parameters in China. International
Journal Of Remote Sensing, 23: 989-999.
Li, F., Zhang, M. & Li, X. 2013. Variation characteristics of different-level precipitation in Ningxia of Southwest China in 1962-2011. Chinese Journal of Ecology, 8: 2154-2162.
Liu, B., Xu, M., Henderson, M. & Qi, Y. 2005. Observed trends of precipitation amount, frequency, and intensity in China, 1960–2000. Journal of Geophysical Research: Atmospheres, 110.
Liu, X., Zhu, X., Pan, Y., Yizhan, L. I. & Zhao, A. 2015. Spatiotemporal changes in vegetation coverage in China during 1982—2012. Acta Ecologica Sinica.
Ma, Z. & Fu, Z. 2006. The Fact of Drought in North China from 1951 to 2004. Chinese Science Bulletin, 51: 2429-2439. Miao, Q. & Wang, Y. The division of four seasons in China and its variation characteristic analysis. In Proceedings of the
The Chinese meteorological society annual meeting, 2007.
Min, S. & Qian, Y. 2008. Trends in all kinds of precipitation events in China over the past 40 years. Acta Scientiarum
Naturalium Universitatis Sunyatseni, 47: 105-111.
Ning, L. & Qian, Y. 2008. Analysis on Trends of Annual and Seasonal Four Kinds of Daily Precipitation in China.
Plateau Meteorology, 27: 1010-1020.
Prasad, V. K., Anuradha, E. & Badarinath, K. 2005. Climatic controls of vegetation vigor in four contrasting forest types of India—evaluation from National Oceanic and Atmospheric Administration’s Advanced Very High Resolution Radiometer datasets (1990–2000). International Journal Of Biometeorology, 50: 6-16.
Qian, W., Fu, J. & Yan, Z. 2007a. Decrease of light rain events in summer associated with a warming environment in China during 1961–2005. Geophysical Research Letters, 341: 224-238.
years. Advances in Earth Science, 7.
Qian, Y., Gong, D., Fan, J., Leung, L. R., Bennartz, R., Chen, D. & Wang, W. 2009. Heavy pollution suppresses light rain in China: Observations and modeling. Journal of Geophysical Research: Atmospheres, 114.
Qin, A.-m. & Qian, W.-h. 2006. The seasonal climate division and precipitation trends of China in recent 41 years.
Plateau Meteorology, 25: 495-502.
Qin, D., Chen, Z., Luo, Y., Ding, Y., Dai, X., Ren, J., . . . Zhang, D. 2007. Updated Understanding of Climate Change Sciences. Advances in Climate Change Research.
Rosenfeld, D., Lohmann, U., Raga, G. B., O'Dowd, C. D., Kulmala, M., Fuzzi, S., . . . Andreae, M. O. 2008. Flood or drought: how do aerosols affect precipitation? Science, 321: 1309-1313.
Rousseeuw, P. J. & Bassett, G. W. 1990. The Remedian: A Robust Averaging Method for Large Data Sets. Journal Of The
American Statistical Association, 85: 97-104.
Schultz, P. & Halpert, M. 1993. Global correlation of temperature, NDVI and precipitation. Advances In Space Research, 13: 277-280.
Shastri, H., Paul, S., Ghosh, S. & Karmakar, S. 2015. Impacts of urbanization on Indian summer monsoon rainfall extremes. Journal of Geophysical Research: Atmospheres, 120: 496-516.
Steensen, B., Ólafsson, H. & Jonassen, M. O. 2011. An extreme precipitation event in Central Norway. Tellus Series
A-Dynamic Meteorology And Oceanography, 63: 675-686.
Trenberth, K. E. 2011. Changes in precipitation with climate change. Climate Research, 47: 123-138.
Trenberth, K. E., Dai, A., Rasmussen, R. M. & Parsons, D. B. 2003. The changing character of precipitation. Bulletin Of
The American Meteorological Society, 84: 1205-1217.
Wang, D., Chen, L. & Ding, Y. 2006. The change trend in rainfall, wet days of china in recent40 years and the correlation between the change trend and the change of globe temperature. Journal Of Tropical Meteorology, 3: 012. Wang, X. & Zhai, P. 2008. Changes in China’s precipitation in various categories during 1957–2004. Journal Of Tropical
Meteorology, 5: 788-798.
Wang, Y. & Zhou, L. 2005. Observed trends in extreme precipitation events in China during 1961–2001 and the associated changes in large-scale circulation. Geophysical Research Letters, 32.
Wang, Z., Shen, S. & Liu, R. 2011. Impact analysis of precipitation in different classes on Anuual Precipitation Change in recent 40 years in China. Meteorological and Environmental Sciences, 34: 7-13.
Wu, Z. 2012. Analysis of characteristics of precipitation days at different levels in southwest China. In Analysis of
Xu, C. 1999. Climate change and hydrologic models: A review of existing gaps and recent research developments. Water
Resources Management, 13: 369-382.
Xu, X., Zhang, x., Dai, E. & Song, W. 2014. Research of trend variability of precipitation intensity and their contribution to precipitation in China from 1961 to 2010. Geographical Reserch, 33: 1335-1347.
Yan, Z. & Yang, C. 2000. Geographic Patterns of Extreme Climate Changes in China during 1951-1997 [J]. Climatic and
Environmental Research, 3: 004.
Yue, T. X., Wang, Y. A., Chen, S. P., Liu, J. Y., Qiu, D. S., Deng, X. Z., . . . Tian, Y. Z. 2003. Numerical Simulation of Population Distribution in China. Population & Environment, 25: 141-163.
Zhai, P., Zhang, X., Wan, H. & Pan, X. 2005. Trends in total precipitation and frequency of daily precipitation extremes over China. Journal Of Climate, 18: 1096-1108.
Zhang, F., Liu, J., Gong, T. & Wang, H. 2006. Hydrological Regime of the Karuxung Watershed in North Himalayas.
Acta Geographica Sinica, 11: 002.
Zhang, L. & Wu, J. 2014. Main progress in research on reduced light rain in China during recent decades. Torrential Rain
Tables:
Table 1 Statistics of annual SP in China from 1961 to 2013.
Range Minimum Maximum Mean Std. Deviation Skewness Kurtosis
CN Day (days) 99.5 4.4 103.9 42.8 0.6 0.5 0.7
Amount (mm) 42.1 1.6 43.8 16.5 0.2 0.7 1.5
NEC Day (days) 55.1 21.1 76.2 38.9 1.2 0.6 0.4
Amount (mm) 19.4 8.8 28.2 15.0 0.4 0.6 -0.2 NC Day (days) 70.5 21.2 91.6 31.8 1.2 3.5 17.2 Amount (mm) 24.6 8.8 33.4 12.4 0.4 3.5 17.1 EC Day (days) 49.3 25.5 74.8 42.7 1.0 0.6 0.5 Amount (mm) 14.8 9.9 24.6 15.8 0.3 0.2 0.1 CC Day (days) 83.6 4.4 87.9 45.3 0.4 0.3 0.4 Amount (mm) 34.8 1.6 36.5 17.4 0.4 0.5 1.5 NWC Day (days) 57.8 8.2 65.9 28.5 1.4 0.6 -0.4 Amount (mm) 22.9 2.9 25.9 11.1 0.6 0.6 -0.5 SWC1 Day (days) 90.6 13.3 103.9 50.3 1.8 0.5 1.2 Amount (mm) 38.1 5.7 43.8 20.5 0.8 0.5 1.2 SWC2 Day (days) 58.3 38.2 96.5 62.4 2.8 0.6 -0.6 Amount (mm) 24.2 15.4 39.6 23.3 1.2 1.1 0.5 SC Day (days) 49.0 36.3 13.8 52.5 1.0 0.1 0.6 Amount (mm) 21.5 85.3 35.3 20.3 0.4 1.2 1.4
Table 2 Significance of trends of seasonal slight precipitation (in percent of MS) in eight regions of China. Decrease
significantly means these stations are significant at the 95% confidence level.
Percentage % MAM JJA SON DJF
Amounts Days Amounts Days Amounts Days Amounts Days
NEC No evident trend 6.8 58.3 1.9 6.8 1.0 18.5 12.6 52.4 Increasing trend 47.6 13.6 3.9 0.0 14.6 1.0 43.7 14.6 Decreasing trend 45.6 28.2 94.2 93.2 84.5 80.6 43.7 33.0 Decrease significantly 4.9 15.5 53.4 74.8 43.7 72.8 6.8 14.6 NC No evident trend 8.6 52.9 2.9 15.7 4.3 31.4 11.4 57.1 Increasing trend 30.0 5.7 5.7 0.0 25.7 7.1 42.9 11.4 Decreasing trend 61.4 41.4 91.4 84.3 70.0 61.4 45.7 31.4 Decrease significantly 11.4 24.3 47.1 71.4 34.3 50.0 12.9 18.6 EC No evident trend 0.9 5.6 12.2 28.0 2.8 0.9 4.7 7.5 Increasing trend 2.8 0.0 19.6 3.7 0.0 0.0 11.2 0.0 Decreasing trend 96.3 94.4 68.2 68.2 97.2 99.1 84.1 92.5 Decrease significantly 47.7 86.9 19.6 48.6 77.6 95.3 48.6 79.4 CC No evident trend 8.0 16.8 3.2 16.0 1.6 8.0 7.2 28.0 Increasing trend 6.4 1.6 15.2 3.2 5.6 0.0 24.0 3.2 Decreasing trend 85.6 81.6 81.6 80.8 92.8 92.0 68.8 68.8 Decrease significantly 25.6 61.6 29.6 53.6 59.2 84.0 24.8 54.4 NWC No evident trend 18.6 67.7 2.9 42.2 19.6 62.8 17.7 57.8 Increasing trend 34.3 6.9 38.2 11.8 27.5 5.9 58.8 33.3 Decreasing trend 47.1 25.5 58.8 46.1 52.9 31.4 23.5 8.8 Decrease significantly 6.9 14.7 13.7 30.4 9.8 19.6 1.0 2.9 SWC1 No evident trend 9.1 42.1 4.6 33.0 3.4 27.3 12.5 51.1 Increasing trend 36.4 19.3 23.9 3.4 19.3 3.4 44.3 15.9 Decreasing trend 54.6 38.6 71.6 63.6 77.3 69.3 43.2 33.0 Decrease significantly 11.4 18.2 23.9 45.5 33.0 53.4 15.9 22.7 SWC2 No evident trend 2.9 23.5 0.0 14.7 2.9 2.9 2.9 8.8 Increasing trend 11.8 0.0 14.7 5.9 0.0 0.0 5.9 0.0 Decreasing trend 85.3 76.5 85.3 79.4 97.1 97.1 91.2 91.2 Decrease significantly 29.4 61.8 29.4 55.9 82.4 88.2 61.8 85.3 SC No evident trend 4.7 28.3 0.9 17.0 0.9 4.7 1.9 4.7 Increasing trend 27.4 4.7 12.3 2.8 0.9 0.0 8.5 0.0
Decreasing trend 67.9 67.0 86.8 80.2 98.1 95.3 89.6 95.3 Decrease significantly 11.3 46.2 29.3 52.8 67.0 95.9 50.0 79.3
Table 3. The statistics of monitoring stations on SPA (a) and SPD (b) in different seasons.
(a)
Seasons Sum Stable Ratio Downtrend Ratio (%)
Downtrend
(Statistically significant)
Ratio Uptrend Ratio
MAM 735 57 7.8 418 56.9 145 19.7 181 24.6
JJA 735 29 3.9 544 74.0 222 30.2 126 17.1
SON 735 34 4.6 574 78.1 364 49.5 86 11.7
DJF 735 67 9.1 441 60.0 188 25.6 227 30.9
(b)
Seasons Sum Stable Ratio Downtrend Ratio (%)
Downtrend
(Statistically significant)
Ratio Uptrend Ratio
MAM 735 268 36.5 418 56.9 304 41.4 49 6.7
JJA 735 163 22.1 544 74.0 392 53.3 28 3.8
SON 735 146 19.9 574 78.1 505 68.7 15 2.0
Table 4 Correlation coefficients for NDVI and slight precipitation amount (A), and Correlation coefficients for NDVI
and Slight precipitation days (D) of different natural vegetation, n=130. The data followed with ** means it is significant at 0.01 level, * presented it is significant at 0.05 level. The data, which are shown in bold italic, indicate the maximum correlation coefficient. Vegetation Type (NDVI) Number of sites A two months lag(A-2) D two months lag(D-2) A one month lag (A-1) D a month lag (D-1) A no lag (A) D no lag (D) Coniferous forest (a) 38 0.24* 0.25* 0.09 0.03 -0.06 -0.02
Broad-leaved forest (b) 17 0.11 0.10 0.02 -0.03 0.20* 0.11 Trees(a+b) 55 0.20 0.21 0.01 -0.02 0.00 -0.18 Shrub (c) 37 0.06 0.00 0.01 -0.05 -0.06 0.04 Desert (d) 21 -0.53** -0.53** 0.19* -0.23 0.49 0.55** Grassland (e) 32 0.17 0.16 0.29** 0.30* 0.10 0.06 Grass cluster (f) 9 0.21* 0.25* -0.06 0.06 -0.10 -0.07 Meadow (g) 45 -0.05 0.01 0.16 0.23* -0.29** -0.29** Herbage (e+f+g) 86 -0.05 -0.03 0.27** 0.33** 0.28* 0.25* Marsh (h) 3 -0.20* -0.16 0.18 0.30** 0.08 0.10
FIGURE 1 Geographical distribution of the 735 MS adopted in this research and domains of eight sub regions in China--NEC: Northeast China; NC: North China; EC: East China; CC: Central China; SC; NWC: Northwest China and Southwest China are marked by SWC1, and SWC2, respectively. Together they are called Southwest China. CN refers to China as a whole. The line in red named Heihe-Tengchong line (It is also called Hu line). Heihe is a city in Northeast China, and Tengchong is in Southwest China.
FIGURE 2 Distribution of slight precipitation amount (SPA) (panel a) and slight precipitation days (SPD) (panel b) in 53 years (1961 - 2013), the areas in dark colour display a high value in SPA and SPD, and the light colour show low values. These isolines functioned as labels of gradient for understanding quantitatively.
FIGURE 4 Spatial distribution of trend for annual SPA (a) and SPD (b) during the period of 1961-2013. The monitoring stations coloured in red and blue represent a positive and negative trend, respectively. The stations trend indicators shown as bigger blue dots are significant at the 95% confidence level. The black line is Heihe-Tengchong line.
FIGURE 5 Trends of SPA in eight regions and in whole China from 1961 to 2013. The blue scattered points represent annual SPA. The red and black lines show the linear tendency of each area (Red lines (p< 0.05) represent statistical significant, while black line (p>0.05) does not). P-value of linear fit can be checked in table S3, row SPA.
FIGURE 6 Median value of daily SP against year. The blue scattered points represent the median value of daily SP within one year with the record of slight precipitation.
FIGURE 7 The correlation coefficient of NDVI/SP in different regions over China, and a,b presented NDVI/SPA and NDVI/SPD (ensemble-average result from 1981 to 2006), respectively. The regions covered with shadow indicates statistically significant at the 95% (P<0.05) level.
FIGURE 8 Correlation coefficients between SP and NDVI: (a) SPA and NDVI, (b) SPD and NDVI. Asterisk (*)


![[PDF] Formation développement web pdf bases de données | Cours Informatique](data:image/gif;base64,R0lGODlhAQABAIAAAP///wAAACH5BAEAAAAALAAAAAABAAEAAAICRAEAOw==)