HAL Id: hal-01662060
https://hal.archives-ouvertes.fr/hal-01662060
Submitted on 11 May 2018
HAL is a multi-disciplinary open access
archive for the deposit and dissemination of
sci-entific research documents, whether they are
pub-lished or not. The documents may come from
teaching and research institutions in France or
abroad, or from public or private research centers.
L’archive ouverte pluridisciplinaire HAL, est
destinée au dépôt et à la diffusion de documents
scientifiques de niveau recherche, publiés ou non,
émanant des établissements d’enseignement et de
recherche français ou étrangers, des laboratoires
publics ou privés.
The VIMOS Public Extragalactic Redshift Survey
(VIPERS). The distinct build-up of dense and normal
massive passive galaxies
A. Gargiulo, M. Bolzonella, M. Scodeggio, J. Krywult, G. de Lucia, L. Guzzo,
B. Garilli, R. Granett, S. de la Torre, U. Abbas, et al.
To cite this version:
A. Gargiulo, M. Bolzonella, M. Scodeggio, J. Krywult, G. de Lucia, et al.. The VIMOS Public
Extragalactic Redshift Survey (VIPERS). The distinct build-up of dense and normal massive passive
galaxies. Astronomy and Astrophysics - A&A, EDP Sciences, 2017, 606, pp.A113.
�10.1051/0004-6361/201630112�. �hal-01662060�
arXiv:1611.07047v1 [astro-ph.GA] 21 Nov 2016
April 23, 2018
VIMOS Public Extragalactic Redshift Survey (VIPERS)
The distinct build-up of dense and normal massive passive galaxies
⋆A. Gargiulo
1, M. Bolzonella
2, M. Scodeggio
1, J. Krywult
3, G. De Lucia
4, L. Guzzo
5,6, B. Garilli
1, B. R. Granett
5,6,
S. de la Torre
7, U. Abbas
8, C. Adami
7, S. Arnouts
7, D. Bottini
1, A. Cappi
2,9, O. Cucciati
2,10, I. Davidzon
7,2,
P. Franzetti
1, A. Fritz
1, C. Haines
5, A. J. Hawken
5,6, A. Iovino
5, V. Le Brun
7, O. Le Fèvre
7, D. Maccagni
1, K. Małek
11,
F. Marulli
10,12,2, T. Moutard
13,7, M. Polletta
1,14,15, A. Pollo
11,16, L.A.M. Tasca
7, R. Tojeiro
17, D. Vergani
18,
A. Zanichelli
19, G. Zamorani
2, J. Bel
21, E. Branchini
22,23,24, J. Coupon
25, O. Ilbert
7, and L. Moscardini
10,12,2(Affiliations can be found after the references)
Received **; accepted **
ABSTRACT
We use the final data from the VIPERS redshift survey to extract an unparalleled sample of more than 2000 massive M ≥1011M
⊙
passive galaxies (MPGs) at redshift 0.5 ≤ z ≤ 1.0, based on their NUVrK colours. This enables us to investigate how the population of these objects was built up over cosmic time. We find that the evolution of the number density depends on the galaxy mean surface stellar mass density, Σ. In particular, dense (Σ ≥ 2000 M⊙pc−2) MPGs show a constant comoving number density over this redshift
range, whilst this increases by a factor ∼ 4 for the least dense objects, defined as having Σ < 1000 M⊙pc−2. We estimate stellar ages
for the MPG population both fitting the Spectral Energy Distribution (SED) and through the D4000nindex, obtaining results in good
agreement. Our findings are consistent with passive ageing of the stellar content of dense MPGs. We show that at any redshift the less dense MPGs are younger than dense ones and that their stellar populations evolve at a slower rate than predicted by passive evolution. This points to a scenario in which the overall population of MPGs was built up over the cosmic time by continuous addition of less dense galaxies: on top of an initial population of dense objects that passively evolves, new, larger, and younger MPGs continuously join the population at later epochs. Finally, we demonstrate that the observed increase in the number density of MPGs is totally accounted for by the observed decrease in the number density of correspondingly massive star forming galaxies (i.e. all the non-passive M ≥1011M
⊙objects). Such systems observed at z ≃ 1 in VIPERS, therefore, represent the most plausible progenitors of the
subsequent emerging class of larger MPGs.
Key words. galaxies: elliptical and lenticular, cD; galaxies: formation; galaxies: evolution; galaxies: high redshift
1. Introduction
Deep imaging and dynamical studies of passive galaxies (PGs, M & 1010M
⊙) have shown that these objects are already
in place at z ∼ 2 and, on average, their sizes are a factor ∼ 2-4 smaller than comparable galaxies at the current epoch (Daddi et al. 2005; Trujillo et al. 2006; Longhetti et al. 2007;
van Dokkum et al. 2008; Cimatti et al. 2008; van der Wel et al. 2008; Bezanson et al. 2009; Cassata et al. 2011; Belli et al. 2014). In fact, as example, high-z PGs with M ∼ 1011M
⊙have,
on average, Re ∼ 1-2 kpc and mean stellar mass density Σ =
M/(2πRe2) & 2000 M⊙pc−2, while local PGs with the same
stel-Send offprint requests to: Adriana Gargiulo
e-mail: [email protected]
⋆ based on observations collected at the European Southern
Obser-vatory, Cerro Paranal, Chile, using the Very Large Telescope under programs 182.A-0886 and partly 070.A-9007. Also based on obser-vations obtained with MegaPrime/MegaCam, a joint project of CFHT and CEA/DAPNIA, at the Canada-France-Hawaii Telescope (CFHT), which is operated by the National Research Council (NRC) of Canada, the Institut National des Sciences de l’Univers of the Centre National de la Recherche Scientifique (CNRS) of France, and the University of Hawaii. This work is based in part on data products produced at TER-APIX and the Canadian Astronomy Data Centre as part of the Canada-France-Hawaii Telescope Legacy Survey, a collaborative project of NRC and CNRS. The VIPERS web site is http://www.vipers.inaf.it/.
lar mass tend to have Re ∼ 5 kpc and Σ ∼ 1000 M⊙pc−2 (e.g. Shen et al. 2003;Kauffmann et al. 2003).
These new data have been widely interpreted within an ’inside-out’ scenario according to which local PGs accreted their total stellar mass in two phases. During the first phase, a highly dissipative process at high redshift (z >3-5, e.g. a gas-rich merger (Hopkins et al. 2008) or in situ accretion of cold streams (Kereš et al. 2005;Dekel et al. 2009) forms a compact passive core. Subsequently, this compact galaxy assembles an external and low-density halo through many dry minor merg-ers increasing its radius (e.g.Naab et al. 2007,2009;Hilz et al. 2013;van Dokkum et al. 2008).
This scenario is supported by the drastic decrease in the number density of compact PGs over time, observed in some studies (e.g.Cassata et al. 2013;van der Wel et al. 2014). How-ever, other analyses have found a very mild decrease (e.g.
Poggianti et al. 2013b;Valentinuzzi et al. 2010), or even a con-stant number density evolution (e.g.Damjanov et al. 2014,2015;
Saracco et al. 2010; Gargiulo et al. 2016). This disagreement casts doubts on the necessity of a size-growth for individual compact PG. In fact, differences in the selection criteria of pas-sive galaxies (morphology vs. colour-colour diagram vs. specific star formation rate [sSFR] cut), in the selection of its dense sub-population (e.g. cut at constant Re, Σ, or at 1-2σ below the
size-mass relation [SMR]), and in the rest-frame waveband used to derive the effective radius, make it difficult to compare results from different studies (or at different cosmic epochs, see e.g.
Gargiulo et al. 2016).
Evidence shows that in conjunction with an increase in the mean radial size of PGs by a factor of ∼ 4 from z ∼ 1.5-2 to z = 0, the number of PGs per unit volume increases by a factor ∼ 10 (e.g.Pozzetti et al. 2010;Ilbert et al. 2010;Brammer et al. 2011). If the number density of high-z dense PGs drastically falls, as observed by some authors, because they increase their size, their contribution to the whole population of local PGs would have to be less then 10%, since high-z PGs are ten times less numerous than local PGs. Consequently, the majority of lo-cal PGs would need to have formed through a mechanism other than the inside-out model. On the other hand, if all local PGs were assembled according to the inside-out model, new com-pact PGs would need to form continuously at z < 1.5-2 and then increase their sizes in order to sustain the numerical growth of the whole population. This picture could help to explain works that show a mild or null evolution in the number density of compact PGs. However, if this were the case, further evidence would be expected: the age of dense PGs should not evolve sig-nificantly over time, since this sub-population would be con-stantly refreshed by new galaxies. In fact, if the number density of compact PGs is confirmed to evolve slowly, a third hypoth-esis is also viable: compact PGs might passively age and the increase both in mean Reand in the number of PGs over the time could then mostly be due to the fact that galaxies that quench at later epoch are larger (e.g.Valentinuzzi et al. 2010;Cimatti et al. 2008;Carollo et al. 2013). It is common habit to refer to this last scenario as "progenitor bias" (e.g.Franx & van Dokkum 1996). In this picture the age of the stellar population of compact PGs over cosmic time should be consistent with passive evolution.
Thus, valuable insights into the build up of the PG population can be gained by studying the evolution of the number density and the age of the stellar population together.
In this context, massive (M > 1011M
⊙) PGs (MPGs)
deserve particular attention. These systems are expected to evolve mainly through dry mergers (e.g. Hopkins et al. 2009;
De Lucia & Blaizot 2007) and consequently, to experience a stronger size-growth. So far, because MPGs are extremely rare, very few works have studied the combined evolution of the num-ber density and of the age of MPGs as a function of the com-pactness of the source (Carollo et al. 2013;Fagioli et al. 2016).
Carollo et al.(2013), studied quiescent (sSFR < 10−11yr−1) and elliptical galaxies in the COSMOS field (Scoville et al. 2007). They found that the number density of quiescent and ellipti-cal galaxies with Re < 2.5 kpc decreases by about 30% from z ∼ 1 to z ∼ 0.2 and that their U-V colours are consistent with passive evolution. They concluded that the driving mechanism for the average size-growth of the whole population is the ap-pearance at later epochs of larger quiescent galaxies. More re-cently,Fagioli et al.(2016, hereafter F16) analysed the spectro-scopic properties of ∼ 500 MPGs (defined as galaxies with ab-sent or very weak emission lines and no MIPS detections) at 0.2 < z < 0.8 in the zCOSMOS-bright 20K catalog (Lilly et al. 2007). From the analysis of stacked spectra of small and large MPGs, they dated the stellar content of these groups and found that the two sub-populations have similar ages. The authors con-cluded that, in this mass regime, the size growth of individual galaxies through dry mergers is the most likely explanation for the increase in the mean effective radius of the whole population. A recent analysis byZahid et al.(2016) on the physical proper-ties of compact post starburst galaxies at 0.2 < z < 0.8 with M >
1011M⊙provides new insights. On the basis both of their number
density and of their ages, which have been found to be < 1Gyr, the authors suggest that this class of objects are the progenitors of compact quiescent galaxies. They conclude that a substantial fraction of dense quiescent galaxies at z < 0.8 are newly formed. Despite the efforts and improvements of recent years, the overall picture is far from clear. What is still missing is a homo-geneous analysis of the number density and stellar population age at z ∼ 0.8, i.e. over the redshift range where less compact MPGs start to dominate the Universe (e.g.Cassata et al. 2010,
2013). For this goal to be achieved the following three require-ments must be met: significant samples of MPGs at different red-shifts, in order to have good statistics in each redshift bin and Σ bin; a large volume to minimise the effect of the cosmic variance (which is known to affect the COSMOS field); robust estimates of the ages of stellar populations.
The VIMOS Public Extragalactic Redshift Survey (VIPERS) represents an ideal benchmark for this kind of study. Despite the fact galaxies with M >1011M
⊙are rare, the wide area (∼ 16
ef-fective deg2over the W1 and W4 CFHTLS fields, more details
in Sect. 2) and high sampling rate of the survey (∼ 40%) result in a sample of ∼ 2000 MPGs with spectroscopic redshifts over the redshift range 0.5≤ z ≤ 1.0 (see Sect. 2). The unprecedented quality of statistics over this redshift range allow us to study the evolution of the number density of MPGs as a function of Σ (see Sect. 4). Using D4000nas a spectroscopic diagnostic and by fit-ting the spectral energy distribution (SED) we constrained the age of the stellar population of MPGs as a function both of z and Σ (Sect. 5). This information, together with the evolution of the number density, allowed us to put constraints on the mass ac-cretion scenarios and on the origin of new MPGs (Sect. 6). We summarize all of our results in Sect. 7. Throughout the paper we adopt the Chabrier (2003) initial mass function and a flat cos-mology with ΩM= 0.3 and H0= 70 km s−1Mpc−1. Magnitudes
are in the AB system. Effective radii are circularized.
2. Data
2.1. The VIPERS project
In this work we analyse a beta version of the final public data release of VIPERS. The data set used here is almost identical to the publicly released PDR-2 catalogue (Scodeggio 2016), with the exception of a small sub-set of marginal redshifts (mostly at z > 1.2), which were revised close to the release date. This has no effect on the analysis presented here. VIPERS has measured redshifts for 89128 galaxies to iAB= 22.5, distributed over a total area of 23.5 deg2. This reduces to an effective area of 16.3 deg2 once detector gaps and masked areas such as those with bright stars are accounted for. Spectroscopic targets were selected in the W1 and W4 fields of the Canada-France-Hawaii Telescope (CFHT) Legacy Survey Wide, applying a robust colour-colour pre-selection in the ugri plane, to identify galaxies at z > 0.5. Spectroscopic observations were carried out with VIMOS at the VLT using the low-resolution red grism (R = 220), which covers the wavelength range 5500 - 9500 Å. The rms error of the mea-sured redshifts has been estimated to be σz(z) = 0.00054×(1+z) (Scodeggio 2016). In the same paper, a complete description of the PDR-2 data release can be found, while more information on the original survey design and data reduction procedures are found inGuzzo et al.(2014) andGarilli et al.(2014).
2.1.1. Physical and structural parameters of VIPERS galaxies
For each galaxy of the VIPERS spectroscopic sample, physical properties such as the multi-band luminosity and the total stellar mass were derived through the fit of the SED. The photomet-ric multi-wavelength coverage combines improved ugriz-bands photometry based on the T0007 release of the CFHTLS1 and
K s-band observations from the VIPERS Multi-Lambda Survey (VIPERS-MLS2, Moutard et al.2016a) or, when available, from
the VISTA Deep Extragalactic Observations (VIDEO; Jarvis et al. 2013) survey (more details in Davidzon et al. 2013, 2016;
Moutard et al. 2016b).
The fit was performed with the Hyperzmass software (Bolzonella et al. 2000). The template libraries adopted in the fit procedure are fully described in Davidzon et al. (2013) and are based on Bruzual & Charlot(2003) models, with exponen-tially declining star formation history (∝ e−t/τ, where τ is the time scale of the star formation), τ in the range [0.1-30] Gyr, sub-solar (0.2Z⊙) and solar metallicity, and theChabrier(2003)
IMF. Dust extinction was considered according to two different prescriptions (Calzetti et al. 2000;Prevot et al. 1984).
The structural parameters (effective radius Re, Sersic index n) for ∼85% of the VIPERS sources were derived with GALFIT (Peng et al. 2002) fitting the i-band CHFTLS-Wide images with a 2D-psf convolved Sersic profile (Krywult et al. 2016). The CFHTLS public images have a pixel-scale of ∼0.187′′/px and
the full width at half maximum (FWHM) of point-like sources varies from ∼0.5′′to 0.8′′in the i band. To control the variability of the PSF over the wide CCD area of CFHTLS images (1◦× 1◦) Krywult et al.(2016) selected a set of ∼ 2000 stars uniformly distributed over each field and modeled their profiles using a 2D Chebychev approximation of the elliptical Moffat function. This approach allowed the PSF to be successfully described over ∼ 95% of the whole VIPERS area. Only regions without bright and unsaturated stars, or at the edge of the images (hereafter bad PSF regions) were excluded. Since these regions are well defined, we have removed them from our analysis. Taking this into consid-eration the effective final area we used in this analysis is ∼ 14 deg2.
Krywult et al.(2016) tested the reliability of Reand n derived from ground-based CFHTLS images. They found that the typical effective galaxy radius is recovered within 4.4% and 12% for 68% and 95% of the total sample respectively. We refer to the their paper for further details.
2.2. The sample of massive passive galaxies
From the VIPERS spectroscopic catalogue we selected all galax-ies with highly accurate redshift measurements, i.e. with quality flag 2 6 z f lag 6 9.5 (a confidence level > 95%; 75479 galax-ies in the W1+W4 field). We defined galaxgalax-ies as passive on the basis of their location in the rest-frame colour NUV-r vs. r-K diagram, which is a powerful alternative to the UVJ dia-gram (Williams et al. 2009) to properly identify passive galaxies (for more details seeArnouts et al. 2013;Davidzon et al. 2016;
Moutard et al. 2016a,b). Following Davidzon et al.(2016), we defined quiescent galaxies as those satisfying the following
con-1 http://www.cfht.hawaii.edu/Science/CFHTLS/ 2 http://cesam.lam.fr/vipers-mls/ ditions: NUV − r > 3.75, (1) NUV − r > 1.37 × (r − K) + 3.2, (2) r − K < 1.3. (3)
Among all galaxies satisfying these three conditions (7606 in W1 and 3939 in W4, respectively) ∼95% have sSFR < 10−11yr−1. From the quiescent population we selected the
sub-sample with M ≥1011M⊙ (hereafter MPGs; 1905 galaxies in
the W1 field, and 902 in W4) which is complete up to z = 1.0 (see e.g.Davidzon et al. 2013;Fritz et al. 2014;Davidzon et al. 2016). Below z = 0.5, VIPERS is highly incomplete due to the ugri colour cuts imposed in the selection of spectroscopic tar-gets. Thus the following analysis is limited to the redshift range 0.5 6 z 6 1.0. Finally, we excluded from our analysis galaxies that are in bad PSF regions (see Sect. 2.1). These further cuts leaves us with a sample of 2022 MPGs.
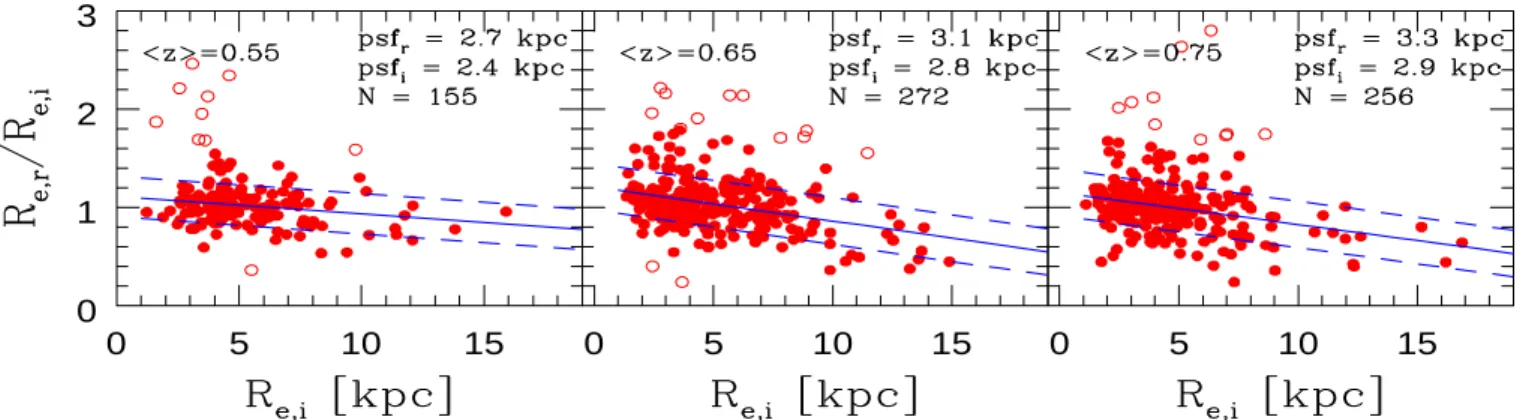
For each of these galaxies we need to derive its mean stel-lar mass density Σ. In the redshift range 0.5 6 z 6 1.0, the i-band filter covers the spectral region across the 4000Å break. In particular, it samples the ∼ V-band (5000Å ) rest-frame at z = 0.5 and the ∼ U-band (3500Å ) rest-frame at z = 1.0. Given the presence of radial colour variations in passive galaxies both at high and low redshift (see e.g.La Barbera & de Carvalho 2009;Saglia et al. 2010;Gargiulo et al. 2012;Guo et al. 2011), the variation of the rest-frame band used to derive Recan induce a spurious trend in the evolution of the radius with redshift. To quantify this bias, the structural parameters for the whole W4 field (and for ∼40% of the W1 field) have been derived in the r-band (FWHM ∼0.8′′, ∼ U-band rest-frame at z . 0.8). Figure
1shows the ratio between the Reof MPGs in the r and i band (Re,r/Re,i) as a function of their Re,i at z < 0.8. For a rigorous analysis, we derived the relations in three finer redshift bins (0.5 6z < 0.6, 0.6 6 z < 0.7, 0.7 6 z < 0.8). The general trend, as derived from the best-fit relations, is that for MPGs Re,i < Re,r. In other words, the internal regions are redder than the outskirts. For the smallest galaxies the difference between the two radii can be up to ∼20%. We note that a portion of MPGs (especially at large Re) has Re,i > Re,r, suggesting the presence a of blue core. However, a detailed study on the internal colour variation in MPGs is beyond the scope of this paper. Given the evidence presented in Fig.1, in the derivation of Σ we referred to the ef-fective radius in the r band for MPGs at z < 0.8, and to Rein the i band for those at z ≥ 0.8. By doing this, we are able to ap-proximately sample the same U band rest-frame over the whole redshift range we probe. For those MPGs at z < 0.8 without an Re,r estimate (mostly in the W1 field), we estimated Re,i using the relations of Fig.1. We checked that the addition of galaxies with Re,rderived from Re,idoes not change the Σ distribution of the sample of MPGs at z < 0.8.
In Figure2we show the fraction of MPGs with available and reliable structural parameters for W1 and W4 fields (magenta and blue points, respectively) and for the total area (red points) as a function of redshift.
Overall, ∼85% of MPGs in the two fields have a reliable Re. For ∼15% of MPGs structural parameters are not available since in some cases we are unable to fit the surface brightness pro-file. This is either because the algorithm does not converge, or the best-fit values of n < 0.2 are unphysical (seeKrywult et al. 2016). Once excluded these objects, the final sample of MPGs with reliable Re(hence Σ) in the redshift range 0.5 -1.0 is com-posed of 1758 galaxies.
0 5 10 15 0 1 2 3 0 5 10 15 0 5 10 15
Fig. 1. The ratio between the effective radius in r band (Re,r) and the effective radius in i band (Re,i) as a function of Re,ifor MPGs in three bins of
redshift as indicated in the top left corner of each plot. In the three panels, the solid blue lines are the best fit relations derived with a sigma-clipping algorithm. Dashed blue lines set the 1σ deviation. The typical dimension of half of the PSF-FWHM of both i-band and r-band images is indicated in the top right corner of each plot with also the number of objects. Open red circles are galaxies at > 3σ from this fit.
Fig. 2. Fraction of MPGs with available Rein the W1 field (magenta
filled points), in the W4 field (blue filled points) as a function of z. At
z < 0.8, MPGs with Rederived from i-band images are included. Red
filled points indicate the completeness for the W1+W4 field.
Table 1. The best-fit values (α, β) of the size mass relation log Re= α
log (M/1011) + β of VIPERS MPGs. R
e,11indicates the value of Reat
M = 1011M
⊙as predicted by the best-fit relation.
z α β Re,11[kpc]
0.5 6 z < 0.7 0.59±0.07 0.60±0.01 3.9 0.7 6 z < 0.9 0.70±0.08 0.53±0.02 3.4 0.9 6 z 6 1.0 0.52±0.10 0.52±0.02 3.3
3. The size mass relation of MPGs in VIPERS for
0.5 < z < 1.0
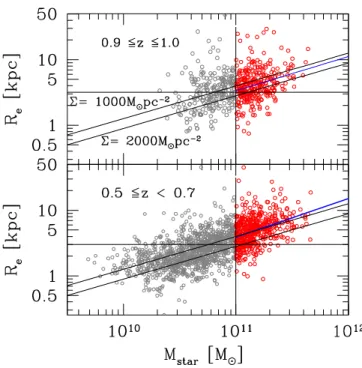
In Fig.3we show the SMR for the VIPERS MPGs in the lowest and highest redshift bin of our sample, i.e. 0.5 6 z < 0.7 and 0.9 6 z 6 1.0. We fitted a size-mass relation of MPGs of the form log Re= α log (M/1011) + β adopting an ordinary least squares fit without take into account errors on Re. The best-fit results are reported in Table1. We add also the result for the intermediate bin (0.7 ≤ z < 0.9). In agreement with previous studies (e.g.
Damjanov et al. 2011; van der Wel et al. 2014), we find that at 1σ there is almost no evolution of the slope of the SMR with time. However, there is an offset among the zero-points. On
av-erage, at fixed stellar mass, MPGs at hzi = 0.6 have Re∼ 1.25 larger than those at z = 1.0. This increase shows that the growth in the mean Re of the passive population is gradual and con-tinuous, extending out to z < 1. The increase in Reis in agree-ment with what has been found by other authors.Damjanov et al.
(2011), for a sample of erly-type galaxies at 0.2 < z < 2.7, found hRei ∝ (1+z)−1.62±0.34, independently of the stellar mass of the galaxy, i.e. an increase by a factor ∼1.4±0.1 in the redshift range 0.6 - 1.0. Similarly,Williams et al.(2010) found hRei ∝ (1+z)−1.3 for passive galaxies (UVJ selected) with M > 1011M⊙which
re-sults in an increase of a factor ∼1.3 in our redshift range. From the analysis of passive galaxies (UVJ colour selected) with M > 2×10¹⁰M
⊙, van der Wel et al. (2014) found hRei ∝ (1+z)−1.48 over the redshift range 0 < z < 3, still in fair agreement with our results.
In Fig. 4 we directly show the distribution of Re of MPGs in the same redshift bins as Fig.3. Although the two distribu-tions are overall different (KS test probability < 10−8), the Figure shows that they cover the same range of Re. This suggests that the population of compact MPGs does not totally disappear with cosmic time. In the next section we will quantify this qualitative trend by estimating the comoving number density of MPGs with different Σ.
4. The number density of MPGs in VIPERS as a function of redshift and mean stellar mass density
In order to derive the number density of the MPGs a function of Σ we subdivided our sample into a “high-Σ sample”, consist-ing of galaxies with Σ ≥ 2000 M⊙pc−2, an “intermediate-Σ
sam-ple”, consisting of galaxies with 1000 < Σ 6 2000 M⊙pc−2, and
a “low-Σ sample” consisting of galaxies with Σ < 1000 M⊙pc−2.
The choice of a cut at 2000 M⊙pc−2was determined by the
char-acteristics of the CFHTLS images. In Fig.3, the horizontal solid lines indicate half of the FWHM of the PSF. We note that all the MPGs with Rebelow half the FWHM of the images, at any redshift, have Σ & 2000 M⊙pc−2. Adopting this cut ensures that
all galaxies with radii lower than the resolution of the image (i.e. galaxies for which Recould be overestimated), are in the same Σ bin and do not spuriously contaminate other bins. We stress that this is a conservative choice. Effective radii are derived by
de-Fig. 3. The size-mass relation of passive VIPERS galaxies (grey open
+ red open points) in the two extreme redshift bins of our analysis (0.5 6z < 0.7 lower panel, and 0.9 6 z 6 1.0 upper panel). Blue open points
are the MPGs analyzed in this paper (vertical lines indicate the mass cut). Horizontal lines indicate half of the FWHM at that redshift, while magenta lines are the best fit of the size-mass relation of MPGs. Black diagonal lines are lines of constant Σ (2000 and 1000 M⊙pc−2).
Fig. 4. The distribution of the effective radius for MPGs in our lowest
(blue histogram) and highest (red histogram) redshift bins. The solid lines indicate the median values of the two distributions. The probability p that the two distributions are extracted from the same parent sample are reported in the label.
convolving the data for the real PSF of the images. At the typical S/N of our galaxies, measurements of Relower than the image resolution are robust as shown in the Appendix ofKrywult et al.
(2016).
Table 2. The total number of massive quiescent galaxies and of the
high-Σ sample, intermediate-Σ sample, and low-Σ sample in the four redshift bins 0.5 6 z < 0.7, 0.7 < z 6 0.8, 0.8 < z 6 0.9, 0.9 < z 6 1.0. At each redshift the sum of the high+intermediate+low Σ galaxies does not return the total number of objects since not all the MPGs have a reliable Re.
z Ntot Nhigh−Σ Nint−Σ Nlow−Σ 0.5 - 0.7 782 165 185 352 0.7 - 0.8 482 144 128 163 0.8 - 0.9 386 103 92 116 0.9 - 1.0 372 112 97 101
In Tab. 2, we list the total number of galaxies in each bin of stellar mass density, and for each redshift bin. Their sum is smaller than the total number of galaxies (first column in Tab.2) since for a fraction of galaxies we do not have a reliable estimate of their structural parameters (see Sect. 2.2).
The VIPERS final sample (and hence our final sample of MPGs) suffers from three sources of incompleteness. These are the Target Sampling Rate (TSR), the Success Sampling Rate (SSR), and the Colour Sampling Rate (CSR). The TSR is given by the ratio of galaxies effectively observed and targeted ies. The SSR is the fraction of spectroscopically observed galax-ies with a redshift measurement. The CSR takes into account the completeness due to the colour selection of the survey. These statistical weights (hereafter TSR(i), SSR(i), CSR(i)) depend on the magnitude of the galaxy, on its redshift, colour, and angu-lar position. They have been derived for each galaxy in the full VIPERS sample (for a detailed description of their derivation seeGarilli et al. 2014;Scodeggio 2016). In the derivation of the number density, we weighted each MPG i in our sample by the quantity w(i) = 1/(TSR(i)*SSR(i)*CSR(i)).
Beside these sources of incompleteness, a fraction of MPGs is lacking of reliable structural parameters. In Fig. 2 we show this fraction as a function of redshift. We checked whether the galaxies without structural parameters belong mainly to a sub-population of galaxies of a given Σ. To address this issue, we compared the fraction of high-, intermediate- and low-Σ MPGs in different redshift bins (which have different levels of com-pleteness). We did not find any significant variation between red-shift bins. Given that there is no dependence between the lack of structural parameters and Σ, we corrected the number densities of MPGs for this source of incompleteness, using the values in Fig.2.
4.1. The number densities of MPGs in VIPERS field as a
function of z andΣ
In Fig.5we show the number density of MPGs as a function of redshift and mean stellar mass density, both in the W1 and W4 fields. Error bars were derived taking into consideration Poisson fluctuations, and the uncertainties on the Reestimates. To con-sider this last source of uncertainty, we computed the standard deviation σ(z, Σ) over 100 number density estimates obtained by replacing for each galaxy the effective radius Rewith a value randomly drawn from a Gaussian distribution with mean value Reand standard deviation the typical error on Re(i.e. 0.05Re, see Sect 2.1).
The estimates of the number density in the W1 and W4 fields are in very good agreement, indicating that the wide area of VIPERS reduces the effect of cosmic variance even for the most
0.4
0.6
0.8
1
z
0.4
0.6
0.8
1
z
0.4
0.6
0.8
1
z
Fig. 5. The number densities for massive passive galaxies with Σ ≥ 2000 M⊙pc−2(right panel, dark red symbols), 1000 ≤ Σ < 2000 M⊙pc−2(central
panel, orange symbols), and Σ < 1000 M⊙pc−2(left panel, green symbols), for the W1 field (filled circles) and W4 one (open circles). Number
densities for the W4 field are shifted in redshift just to visualize them better. The error bars correspond to 1σ.
Total
Fig. 6. The number density of MPGs with different mean stellar mass
density in VIPERS field as a function of the redshift. Dark red triangles refer to high-Σ MPGs, orange circles refer to intermediate-Σ MPGs, and green squares to low-Σ MPGs. Black circles show the number den-sity for the total sample of MPGs. Number densities for the three sub-populations are shifted in redshift just to visualize them better. The er-ror bars correspond to 1σ. We fitted the data with a power law and solid lines are the best-fit relations.
massive galaxy sample. In Fig.6we report the number density of MPGs as a function of Σ (plus the number density for the whole population of MPGs) in the total VIPERS area (W1 + W4). Error bars are derived as described above. The evolution of the num-ber density of the whole population of MPGs is well fitted by a function ρ ∝ (1+z)α, with α = -3.3±0.9. In the ∼ 2.5 Gyr from
z = 1.0 to z = 0.5, the number density of MPGs increases by
a factor ∼ 2.5. Similarly, we fitted the number density evolution of the three subpopulations with a power law, and found α = -5.0±0.4 for low-Σ MPGs, α = -1.8±0.7 for intermediate-Σ MPGs and α = -0.7±0.9 for high-Σ MPGs. We find that the evolution of the number density strongly depends on the mean stellar mass density of the system. In particular the lower the mean stellar mass density, the faster the evolution. The number density of the densest MPGs is approximately constant over the whole redshift range, while the number density of less dense MPGs constantly increases with time by a factor ∼4.
Figure6shows that we are looking at a crucial moment in the build up of the MPG population, i.e. when less compact galax-ies, which constitute the bulk of the local MPG population, start to dominate. In fact, at z > 0.8, the population of MPGs is com-posed in equal parts of high, intermediate and low-Σ galaxies. At lower redshift, the contribution of low-Σ MPGs steadily in-creases. At z = 0.5 compact quiescent galaxies account for just ∼15% of the whole population. Less compact systems, on the other hand, account for more than half of the whole population. This result is in agreement with the analysis by Cassata et al.
(2011) who found that normal (i.e. less dense) passive (sSFR < 10−11yr−1) and elliptical galaxies with 1010 < M .1011.5M⊙
start to become the dominant sub-population at z ∼ 0.9.
Our results are in good agreement also with Carollo et al.
(2013) who found that the number density of passive (sSFR < 10−11yr−1) and elliptical galaxies with M >1011M
⊙ and Re < 2.5 kpc decreases by ∼ 30% in the 5 Gyr between z ∼ 1 and z ∼ 0.2.Damjanov et al. (2015) found an almost constant number density over the redshift range 0.2< z <0.8 for colour selected passive compact galaxies with M > 8×10¹⁰M
⊙.Gargiulo et al.
(2016) found ρ(z) ∝ (1 + z)0.3±0.8 for a sample of
morphologi-cally selected elliptical dense galaxies (Σ > 2500 M⊙pc−2) with
M >1011M
⊙in the redshift range 0 < z < 1.6, consistent with
our results.Cassata et al.(2013) found a very mild decrease of compact galaxies (1σ below the local SMR), and a mild increase in the number density of normal galaxies (consistent at 1σ with the local SMR) from z ∼ 1 to z ∼ 0.5, in qualitative agreement with our results. However, they found that the number density of ultra-compact galaxies (0.4dex smaller than local SDSS coun-terparts of the same mass) dramatically decreases. A detailed
comparison with our results is not possible given the different selection of the samples. Nonetheless, we verified that the con-stant trend for high-Σ MPGs we show in Fig. 6 is not related to the adopted cut Σ = 2000 M⊙pc−2. We estimated the number
density for the sub-sample of MPGs with Σ > 3000 M⊙pc−2and
Σ > 4000 M⊙pc−2 and found α = -0.5±1.4 and α = -1.3±1.5.
These results are consistent at 1σ with the results we found for the high-Σ sub-population.
If the global population of dense passive galaxies were to evolve in size, then in order to maintain a constant number den-sity of the compact sub-population over cosmic time, new dense galaxies would have to appear at lower redshift. In particular, the time scale of the size-growth mechanisms and that of the ap-pearance of new dense massive quiescent galaxies would need to be very similar (e.g.Carollo et al. 2013). The other possibility is that the dense MPGs passively evolve without changing their structure. One way to discriminate between these two possibili-ties is to study of the age of the stellar population as a function of the mean stellar mass density.
5. The stellar population age of MPGs as a function of the redshift and mean stellar mass density
For any individual galaxy, we constrained its stellar population age both fitting the photometric SED (ageS ED) and through the D4000nindex. The D4000nindex (Balogh et al. 1999) is an age sensitive spectral feature (Kauffmann et al. 2003) defined as the ratio between the continuum flux densities in the blue region [3850 - 3950]Å and red region [4000 - 4100]Å across the 4000Å break: D4000n= (λblue 2 − λ blue 1 ) Rλred 2 λred 1 Fνdλ (λred2 − λred 1 ) Rλblue 2 λblue 1 Fνdλ . (4)
A complete description of the D4000n measurements for VIPERS galaxies is presented in Garilli et al. (2014).
Siudek et al. (2016), using staked spectra, have already in-vestigated the star formation epoch of all of VIPERS passive galaxies through the analysis of both the D4000n and the Hδ
Lick index. The authors selected passive galaxies using an evolving cut in the rest-frame U-V colour and found that, over the full analyzed redshift and stellar mass range (0.4 < z < 1.0 and 10 < log(M/M⊙) <12, respectively), the D4000nindex increases with redshift, while Hδ gets lower. Here, instead
of looking for trends of D4000n with stellar mass and z, we focused our analysis on a given stellar mass bin, and investigate within this bin the trend of D4000n with the Σ and z. We selected MPGs with the error on D4000n smaller than 8% in order to restrict the analysis to galaxies with a highly accurate estimate of D4000n. This further criterion reduces the sample by ∼10%, but does not alter the distribution in Σ. Fig. A.1in Appendix A shows how the conversion of the D4000n into a stellar population age depends both on metallicity Z and on the time scale τ of the star formation of the galaxy (we report the trend in the case of an exponentially declining star formation history). Given the spectral coverage and resolution of our spectra, we can accurately measure D4000nfor each individual galaxy but conversely we cannot constrain either Z or the time scale. Thus, instead of assuming some values we adopted the following approach. Starting from the best-fit models of the SED, we derived the mean value of AgeSED(z,Σ), ZSED(z,Σ), and
τSED(z,Σ) for MPGs in each bin of z and Σ. Using low-resolution
(lr) BC03 models (i.e. the same as those used to perform the SED fitting), we derived the D4000n corresponding to these mean values, D4000n,S ED(z,Σ), and compared this estimate with the mean value of the distribution of D4000nof all of the MPGs in that bin of z and Σ. For simplicity we focus this part of our analysis on the two extreme Σ sub-populations, the low-Σ and high-Σ MPGs. Results for intermediate-Σ MPGs are in between. In Fig.7filled points show the mean values of AgeSEDand
the mean value of D4000n (left and right panels, respectively) of low-Σ (green filled squares) and high-Σ (dark red triangles) MPGs. Error bars indicate the error on the mean. The left panel of Fig.7shows that for high-Σ MPGs the evolution of the stel-lar population ages derived from the SED fitting is consistent with a passive evolution of the population. In fact, their AgeSED
increases by ∼2Gyr during the 1.8 Gyr of evolution between z = 0.95 and 0.6. At any redshift, the mean value of the time scale of star formation τ, as constrained by the SED fitting, is ∼ 0.4 Gyr, and the best-fit models have a mean Z ∼ 0.5±0.3Z⊙3.
Using these constraints on age/τ/Z and BC03 models, we de-rived D4000n,S ED. Actually, BC03 models provide the theoret-ical SED for discrete values of Z (e.g. Z = 0.2Z⊙, 0.4Z⊙, Z⊙).
Thus, to derive the D4000n,S EDwe interpolated the estimates of the two models which encompass the mean values of Z. The res-olution of BC03 lr models is 20Å while VIPERS spectra have a resolution of ∼ 17Å around the 4000Å break. Using the high resolution (3Å) BC03 models we verified that this difference affects the D4000nby ∼0.01 (see Appendix A). This is well be-low the typical error on D4000nand for this reason we did not correct for it. The values of D4000n,S ED are shown in the right hand panel of Fig.7with open dark red triangles. They are in good agreement with the mean value of D4000n measured on real spectra. We stress that this comparison is meaningful only between the mean values of the distributions and not for any sin-gle galaxy. Conventionally SED modeling uses a coarse grid of Z/τ, that cannot accurately reproduce the more realistic smooth distribution of metallicity nor time scale of star formation of real galaxies. Nonetheless, although the single values of stellar pop-ulation parameters could be biased, the mean values are more representative of the truth as suggested by the consistency be-tween D4000nand D4000n,S ED in Fig. 7. The results of Fig.7 and Fig.6 show that both the evolution of the number density and of the age of stellar population of dense MPGs, are coherent with passive evolution since z = 1.0.
For what concerns the low-Σ MPGs, the left-hand panel of Fig.7shows that at any redshift they are systematically younger than high-Σ MPGs. In particular their ages increase by just 0.4 Gyr in the 1.8 Gyr of time that passes between z = 0.95 and 0.6. Before comparing the observed value of D4000n with D4000n,S EDit is important to note that the D4000nwe used refers to the portion of the galaxy that falls into the 1′′ slit.
Consid-ering the different dimensions of high, intermediate, and low-Σ MPGs, the slit samples a different fraction of total light for the three sub-populations. In Fig.8, the points indicate the portion of galaxy covered by the slit in Reunit for the high-Σ and
low-Σ sub-populations, as a function of redshift. Almost all of the light from high-Σ MPGs is included in the slit, thus the D4000n provides constraints on the age of the whole galaxy, similarly to the SED fitting. For low-Σ MPGs, the slit samples the inner 0.5Re. Given the known presence of metallicity gradients in
pas-3 We caution that this value refers to the whole galaxy, not just to the
central region known to have Z > Zsun (e.g.Gallazzi et al. 2005). This
value is in agreement with the mean metallicity within Reof local
mas-sive ETGs (0.7+0.15
Fig. 7. Left panel: Mean stellar population ages of MPGs as derived from the SED fitting as a function of redshift and mean stellar mass density for
high- and low-Σ MPGs (filled points). The colour and symbols code is the same as in Fig.6. Error bars indicate the error on the mean. Points refer to the redshift bins 0.5 6 z < 0.7, 0.7 6 z < 0.9, 0.9 6 z 6 1.0. The arrows track the increase of the ages in case of passive evolution from z = 0.95 to z = 0.6. Right panel: Filled points: the mean values of D4000ndirectly measured on spectra for MPGs with different Σ (symbol/color code the
same as in the left panel). Open dark red triangles indicate the values of D4000nof high-Σ MPGs derived from a BC03 model with age/τ/Z equal
to the mean values derived from the SED fitting of this sub-population (D4000n,S ED). Open green squares are the equivalent for low-Σ MPGs,
once the aperture bias is taken into account. Actually, for high-Σ MPGs the slit aperture samples approximately the whole galaxy (see Fig.8), thus D4000nmeasured directly from the spectra and D4000n,S EDcan be fairly compared. For low-Σ MPGs Fig.8shows that the slit samples just the
region within 0.5Re. In the comparison of D4000n and D4000n,S EDhence, we have to take into account the effect of colour gradients (see more
details in Sect. 5.2). Open green circles indicate the values of D4000n,S EDof low-Σ without any correction for aperture bias.
Fig. 8. The ratio between half of the aperture of the slit and effective
radius of the galaxies as a function of the mean stellar mass density and z. The colour code is the same as in Fig.6.
sive galaxies both in local Universe and at intermediate redshift, this implies that at any redshift i) we cannot directly compare the D4000nof high- and low-Σ MPGs, and ii) for low-Σ MPGs, we cannot directly compare the results from SED fitting with those derived from the spectral features as we did for high-Σ MPGs. Although a direct comparison at fixed redshift is not straightfor-ward, we highlight that the region which is sampled by the slit is approximately constant over our redshift range (see Fig.8) and this assures us that the evolutionary trends of D4000n are not affected by aperture effects.
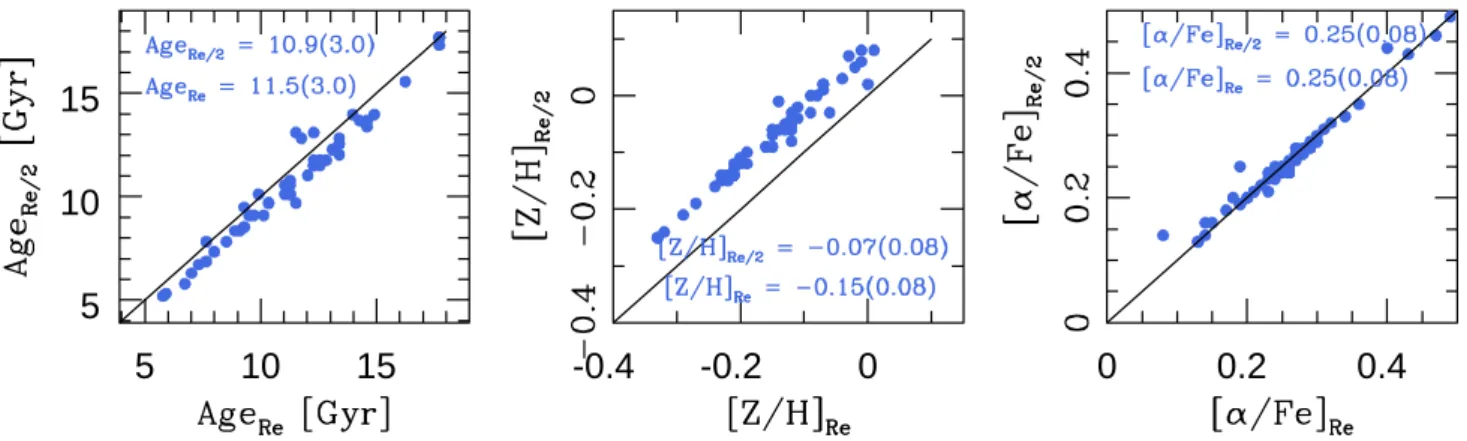
Taking advantage of the spatially resolved information on stellar population properties provided by ATLAS3D survey
(Cappellari et al. 2011) for a sample of 260 local elliptical galax-ies (ETGs), we quantified that for low-Σ local massive ETGs
the metallicity in the central (r < 0.5Re, ZRe/2) region is ∼ 20% greater than the metallicity within Re(see Appendix C). At the same time, we found that there is no significant trend with radius of the time scale of the star formation or age4. Taking this into
consideration, we derived D4000n,S ED applying the correction we derived from local Universe to the mean values of Z (note thatGallazzi et al.(2014) do not find any evolution in the metal-licities of massive quiescent galaxies since z ∼ 0.8). Results are shown as open green squares in the right panel of Fig. 7. As for high-Σ MPGs, they are in good agreement with the D4000n values measured on real spectra. Just to qualitatively show the effect of slit aperture, open circles are the values of D4000n,S ED not corrected for the aperture bias. There is clear disagreement between these values and the mean values measured from real spectra.
Summarizing, both the evolution of the number density and of the stellar population ages of low-Σ MPGs strongly support a picture in which younger low-Σ MPGs continuously appear at lower redshift. These results indicate that the increase both in number and in mean size of the population of MPGs is due to the continuous addition of larger and younger quiescent galaxies over cosmic time.
5.1. Comparison with previous work
Evidence for older ages of the densest galaxies has been found by many authors both in the local Universe and at high-z (e.g. Shankar & Bernardi 2009; Saracco et al. 2009;
Valentinuzzi et al. 2010; Williams et al. 2010; Saracco et al. 2011; Poggianti et al. 2013a; Carollo et al. 2013; Fagioli et al.
4 The population of passive galaxies and elliptical galaxies are not
co-incident (see e.g.Tamburri et al. 2014;Moresco et al. 2013). However, at first order, the two populations share the same properties.
2016). However most of these works have investigated a larger stellar mass range, not focusing their analysis on the massive end.
In the same mass range, using UV colour to date stellar pop-ulation ages of passive compact massive ellipticals,Carollo et al.
(2013) found that they are consistent with passive evolution, in agreement with our results. Using a set of Lick absorption in-dices,Onodera et al.(2015) investigated stellar population prop-erties for a sample of massive quiescent galaxies (UVJ colour selected) at hzi = 1.6. They found a mean age of 1.1+0.3−0.2Gyr. As stated by the authors, this value is in excellent agreement with the age of local counterparts, if high-z massive quiescent galaxies evolve passively. We verified that more than 80% of their sample is composed of massive passive galaxies with Σ > 2000 M⊙pc−2, thus we can reasonably compare their results with
ours. If we assume passive evolution between z = 1.6 and z = 0.95, the mean age of their massive quiescent galaxies rises to 3.1+0.3
−0.2Gyr. This is in fair agreement with the mean age
of high-Σ MPGs we find at z = 0.95 (3.7±0.2 Gyr) (see also
Whitaker et al. 2013).
Different conclusions were reached by F16. Using stacked spectra, the authors constrained the stellar population ages for dense and less dense passive galaxies in the zCOSMOS sample from z = 0.8 to z = 0.2. They found that the age of dense mas-sive quiescent galaxies increases less than would be expected from passive evolution alone. Moreover, they found no corre-lation between the age of stellar popucorre-lation and the dimension of the source. The present analysis differs from the F16 analy-sis in a number of ways: the selection of passive galaxies (no emission lines+no MIPS vs NUVrK colour); the selection of the dense sub-population (cut at fixed Reor along the SMR vs. cut at fixed Σ); and the procedure adopted to constrain the stellar population age. Unfortunately we cannot exactly reproduce their analysis with our data set. In Appendix B, we checked how our results change if we adopt the same criteria to select dense/less dense galaxies. We found that the mean age of dense MPGs is consistent with passive evolution and that less dense MPGs are younger than dense MPGs, independently of the criteria used to divide the sub-populations. However, as stated above, we stress that the previous checks rely on a sample of MPGs selected in a different way and adopt different techniques to constrain the stellar population age. In fact, we cannot repeat the same analy-sis with our data set, so we cannot fully account for the effect of these two factors on the results.
6. Where do new large MPGs come from?
The evidence that the new MPGs are systematically younger contrasts with the hypothesis that massive galaxies are assem-bled mostly through dry mergers (e.g. Hopkins et al. 2009;
Cappellari et al. 2012). In fact, dry mergers should dilute any trend between stellar population age and time of appearance by mixing up the stellar population of pre-existing systems. Actu-ally, more recently new evidence has come to light supporting a scenario in which PGs are mostly the final evolutionary stage of star-forming galaxies (SFGs) that progressively halt their star formation until they become quiescent (e.g.Lilly & Carollo 2016; Driver et al. 2013). In fact, at any z and at fixed stellar mass, star-forming galaxies are larger than passive ones (e.g.
van der Wel et al. 2014). Thus, if passive galaxies are just the quenched counterpart of star-forming galaxies, we should ex-pect a correlation between the stellar population age of PGs and their mean stellar mass density in the direction of younger age for less dense systems. This is exactly what we have shown in
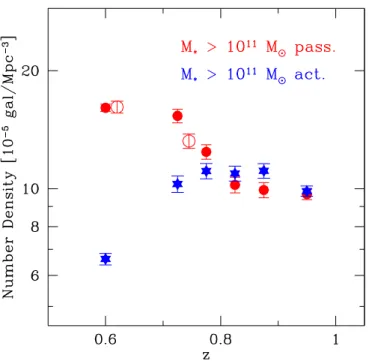
Fig.7. In this case, however, further evidence is expected: the number of PGs that appear at any time, has to be similar to the number of SFGs that disappear. To test this simple hypothesis, in Fig.9we compare the number density of the whole population of MPGs (red filled points), with the number density of massive star-forming galaxies (MSFGs) (blue filled stars). We considered all non passive massive galaxies to be MSFGs. The figure shows that the number densities of the two populations start to deviate at z < 0.8, i.e. when the Universe becomes efficient at producing low-Σ MPGs. In particular, the number density of MSFGs is al-most flat at z> 0.8 and then drops by a factor ∼2 at lower z. The declining trend does not depend on the selection criterion used to identify MSFGs. Haines et al.(2016) found the same trend studying the number density of M > 1011M
⊙VIPERS galaxies
with D4000n <1.55. Starting from the very simple assumption that all the MSFGs that disappear at z < 0.8, must necessarily migrate in the population of MPGs, we derived the number den-sity of MPGs expected at z < 0.8 by considering their denden-sity at z = 0.8 and the observed decrement of MSFGs at z < 0.8. Open red symbols report the results. In fact, they are in excel-lent agreement with the observed number density of MPGs. In this basic test we did not take into account the fact that some star-forming galaxies with M < 1011M
⊙can enter into our
sam-ple at a later time. Nevertheless, the comparison shown in Fig.
9 shows that, to first order, the migration of MSFGs to MPGs fully accounts for the increase in the number density of MPGs with cosmic time. In particular the h Rei of MSFGs at z ∼ 0.8 is
∼ 5.7kpc, in agreement with the value h Rei = 6.3±3kpc of low-and intermediate-Σ MPGs at h z i = 0.5. If a portion of low-Σ MPGs assembled its stellar mass inside-out, i.e. starting from a compact passive core, we should add the number of these size-evolved MPGs to the open circles in Fig.9, since the "progeni-tor" compact core is not included in the population of MSFGs. In fact, including other channels for MPG production in the model would overestimate the number density of the population. We can therefore exclude the possibility that the inside-out accretion scenario is the main channel for the build up of MPG population. This evidence confirms in an independent way the results we found in Fig.6and Fig.7and that we summarize in the cartoon of Fig.10. In the ∼ 2.5 Gyr of time from z = 1.0 to z = 0.5, the number density of high-Σ MPGs does not evolve, and the ages of their stellar populations are consistent with a passive evolu-tion. In the same time, the number density of low-Σ MPGs in-creases by a factor 4. This increase is in fully consistent with the decrement we observe in the number density of MSFGs. If the new low-Σ MPGs are the direct descendants of MSFGs, we should expect to find that the new low-Σ MPGs would have to be younger than low-Σ MPGs and high-Σ MPGs already in place, that is what we found in Fig.7.
7. Summary and Conclusions
We used the VIPERS data set to investigate how the population of massive passive galaxies (MPGs) has been built up over cos-mic time.
We looked at the evolution of both the number density and the mean age of the stellar population of MPGs as a function of redshift, and of the mean surface stellar mass density. From the VIPERS data set, we selected a sample of ∼ 2000 MPGs over the redshift range 0.5 6 z 6 1.0. We divided this sample into three sub-populations according to their value of Σ: high-Σ MPGs, intermediate-Σ MPGs, and low-Σ MPGs.
We studied the evolution of the number density for the three sub-populations of MPGs and found that it depends on Σ: the
nu
mb
er
redshift
sp
ec
ifi
c
S
FR
stellar mass density
z=1
z=0.8
quenching
z=0.6
nu
mb
er
redshift
nu
mb
er
redshift
4x
sp
ec
ifi
c
S
FR
stellar mass density
sp
ec
ifi
c
S
FR
stellar mass density
quenching
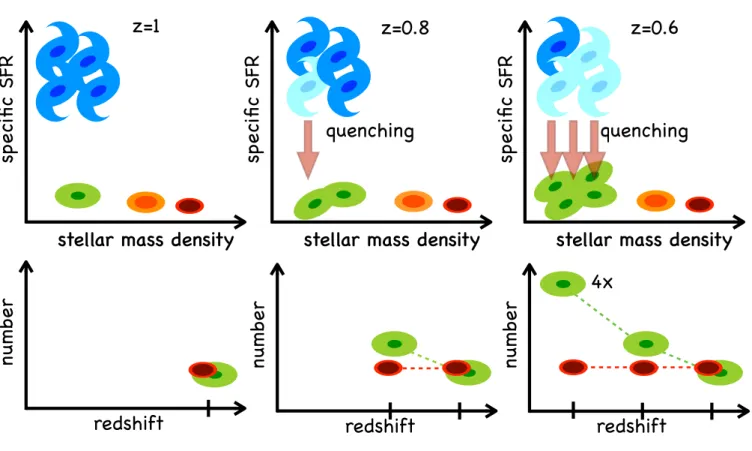
Fig. 10. A schematic view of our results and findings. In the lower panels we plot the evolution of number density for low- and high-Σ MPGs
(large green and small red dark spheroids, respectively). From z = 1.0 to z = 0.5 the number density of high-Σ MPGs does not increase, while over the same time period, the number of low-Σ MPGs increases by a factor 4. These new low-Σ MPGs are plausibly the direct descendants of MSFGs (blue spirals) that progressively halt their star formation until they become passive (see upper panels). In fact, we found that the observed increase in the number density of MPGs is totally accounted for by the observed decrease in the number density of MSFGs.
lower Σ the faster the evolution (see Fig. 6). In particular, we found that the number of dense galaxies per unit volume does not increase from z = 1.0 to z = 0.5. In fact, over the same time interval, the number density of less dense MPGs increases by a factor 4. This different evolution changes the composition of the population of MPGs with time. At z > 0.8, high-, intermediate-and low-Σ MPGs contribute equally to the population. At z < 0.8, the number density of low-Σ MPGs progressively increases and this sub-population starts to dominate over the other two classes. We then investigated the evolution of the stellar population ages as a function of Σ (see Fig.7). We constrained the ages both using photometry, i.e. fitting the spectral energy distribution, and spectroscopy, through the D4000n index (Balogh et al. 1999). The two independent estimates are in agreement and show that:
– The evolution of the age of high-Σ MPGs is fully consistent
with a passive ageing of their stellar population.
– The evolution of the age of low-Σ MPGs is slower than
would be expected in the case of passive evolution, i.e. new low-Σ MPGs are younger than existing ones.
– At any redshift, dense MPGs are older than less dense MPGs.
Both the evolution of the number density and of the age of the stellar population of high-Σ MPGs are consistent with
pas-sive evolution for this sub-population. On the other hand, the re-sults we found for low-Σ MPGs show that their number density continuously increases with decreasing redshift, i.e. new low-Σ galaxies join the population of MPGs as time goes by. The study of stellar population age shows that these new galaxies are sys-tematically younger than the low-Σ MPGs already in place.
These results indicate that the increase both in number den-sity and in typical radial size observed for the population of MPGs is mostly due to the addition of less dense and younger galaxies at later times. Taking the results for low- and high-Σ MPGs together we found that the population of MPGs was built by the continuous addition of less dense MPGs: on top of pas-sively evolving dense MPGs already in place at z = 1.0, new, larger and younger quiescent galaxies continuously join the pop-ulation of MPGs at later times.
We find evidence that these new MPGs are the direct descen-dants of massive star-forming galaxies (MSFGs) that quenched their star formation. In fact, in Fig.9we show that the observed increase in the number density of MPGs is totally accounted for by the decrease in the number density of MSFGs. This not only provides constraints on the origin of MPGs, but also rules out inside-out accretion as the main channel for their build up,
con-Fig. 9. The evolution of the number density of MPGs (filled red circles)
and of star forming massive galaxies (MSFGs, blue filled stars). Open circles show the expected growth in the abundance of MPGs below z < 0.8, assuming that this is fully due to the observed decline of MSFGs. Solid and open circles have been shifted for visualisation purposes.
firming in an independent way our conclusions based on the evo-lution of number density and stellar population age.
Acknowledgements. We acknowledge the crucial contribution of the ESO staff for the management of service observations. In particular, we are deeply grateful to M. Hilker for his constant help and support of this program. Italian partic-ipation to VIPERS has been funded by INAF through PRIN 2008, 2010, and 2014 programs. LG, AJH, and BRG acknowledge support from the European Research Council through grant n. 291521. OLF acknowledges support from the European Research Council through grant n. 268107. TM and SA acknowledge financial support from the ANR Spin(e) through the french grant ANR-13-BS05-0005. AP, KM, and JK have been supported by the National Science Centre (grants UMO-2012/07/B/ST9/04425 and UMO-2013/09/D/ST9/04030). WJP is also grateful for support from the UK Science and Technology Facilities Council through the grant ST/I001204/1. EB, FM and LM acknowledge the support from grants ASI-INAF I/023/12/0 and PRIN MIUR 2010-2011. LM also acknowl-edges financial support from PRIN INAF 2012. SDLT acknowlacknowl-edges the support of the OCEVU Labex 11-LABX-0060) and the A*MIDEX project (ANR-11-IDEX-0001-02) funded by the "Investissements d’Avenir" French govern-ment program managed by the ANR. and the Programme National Galaxies et Cosmologie (PNCG). Research conducted within the scope of the HECOLS In-ternational Associated Laboratory, supported in part by the Polish NCN grant DEC-2013/08/M/ST9/00664.
References
Arnouts, S., Le Floc’h, E., Chevallard, J., et al. 2013, A&A, 558, A67 Balogh, M. L., Morris, S. L., Yee, H. K. C., Carlberg, R. G., & Ellingson, E.
1999, ApJ, 527, 54
Belli, S., Newman, A. B., & Ellis, R. S. 2014, ApJ, 783, 117 Bezanson, R., van Dokkum, P. G., Tal, T., et al. 2009, ApJ, 697, 1290 Bolzonella, M., Miralles, J.-M., & Pelló, R. 2000, A&A, 363, 476
Brammer, G. B., Whitaker, K. E., van Dokkum, P. G., et al. 2011, ApJ, 739, 24 Bruzual, G. & Charlot, S. 2003, MNRAS, 344, 1000
Calzetti, D., Armus, L., Bohlin, R. C., et al. 2000, ApJ, 533, 682
Cappellari, M., Emsellem, E., Krajnovi´c, D., et al. 2011, MNRAS, 413, 813 Cappellari, M., McDermid, R. M., Alatalo, K., et al. 2012, Nature, 484, 485 Cappellari, M., Scott, N., Alatalo, K., et al. 2013, MNRAS, 432, 1709
Carollo, C. M., Bschorr, T. J., Renzini, A., et al. 2013, ApJ, 773, 112 Cassata, P., Giavalisco, M., Guo, Y., et al. 2010, ApJ, 714, L79 Cassata, P., Giavalisco, M., Guo, Y., et al. 2011, ApJ, 743, 96 Cassata, P., Giavalisco, M., Williams, C. C., et al. 2013, ApJ, 775, 106 Chabrier, G. 2003, PASP, 115, 763
Cimatti, A., Cassata, P., Pozzetti, L., et al. 2008, A&A, 482, 21 Daddi, E., Renzini, A., Pirzkal, N., et al. 2005, ApJ, 626, 680
Damjanov, I., Abraham, R. G., Glazebrook, K., et al. 2011, ApJL, 739, L44 Damjanov, I., Geller, M. J., Zahid, H. J., & Hwang, H. S. 2015, ApJ, 806, 158 Damjanov, I., Hwang, H. S., Geller, M. J., & Chilingarian, I. 2014, ApJ, 793, 39 Davidzon, I., Bolzonella, M., Coupon, J., et al. 2013, A&A, 558, A23 Davidzon, I., Cucciati, O., Bolzonella, M., et al. 2016, A&A, 586, A23 De Lucia, G. & Blaizot, J. 2007, MNRAS, 375, 2
Dekel, A., Birnboim, Y., Engel, G., et al. 2009, Nature, 457, 451
Driver, S. P., Robotham, A. S. G., Bland-Hawthorn, J., et al. 2013, MNRAS, 430, 2622
Fagioli, M., Carollo, C. M., Renzini, A., et al. 2016, ApJ, 831, 173
Franx, M. & van Dokkum, P. G. 1996, in IAU Symposium, Vol. 171, New Light on Galaxy Evolution, ed. R. Bender & R. L. Davies, 233
Fritz, A., Scodeggio, M., Ilbert, O., et al. 2014, A&A, 563, A92
Gallazzi, A., Bell, E. F., Zibetti, S., Brinchmann, J., & Kelson, D. D. 2014, ApJ, 788, 72
Gallazzi, A., Charlot, S., Brinchmann, J., White, S. D. M., & Tremonti, C. A. 2005, MNRAS, 362, 41
Gargiulo, A., Saracco, P., Longhetti, M., La Barbera, F., & Tamburri, S. 2012, MNRAS, 425, 2698
Gargiulo, A., Saracco, P., Tamburri, S., Lonoce, I., & Ciocca, F. 2016, A&A, 592, A132
Garilli, B., Guzzo, L., Scodeggio, M., et al. 2014, A&A, 562, A23 Guo, Y., Giavalisco, M., Cassata, P., et al. 2011, ApJ, 735, 18 Guzzo, L., Scodeggio, M., Garilli, B., et al. 2014, A&A, 566, A108 Haines, C. et al. 2016, A&A submitted
Hilz, M., Naab, T., & Ostriker, J. P. 2013, MNRAS, 429, 2924 Hopkins, P. F., Bundy, K., Murray, N., et al. 2009, MNRAS, 398, 898 Hopkins, P. F., Cox, T. J., & Hernquist, L. 2008, ApJ, 689, 17 Ilbert, O., Salvato, M., Le Floc’h, E., et al. 2010, ApJ, 709, 644
Jarvis, M. J., Bonfield, D. G., Bruce, V. A., et al. 2013, MNRAS, 428, 1281 Kauffmann, G., Heckman, T. M., White, S. D. M., et al. 2003, MNRAS, 341, 33 Kereš, D., Katz, N., Weinberg, D. H., & Davé, R. 2005, MNRAS, 363, 2 Krywult, J., Tasca, L. A. M., Pollo, A., et al. 2016, ArXiv e-prints
[arXiv:1605.05502]
La Barbera, F. & de Carvalho, R. R. 2009, ApJ, 699, L76
Lilly, S. J. & Carollo, C. M. 2016, ArXiv e-prints [arXiv:1604.06459] Lilly, S. J., Le Fèvre, O., Renzini, A., et al. 2007, ApJS, 172, 70 Longhetti, M., Saracco, P., Severgnini, P., et al. 2007, MNRAS, 374, 614 McDermid, R. M., Alatalo, K., Blitz, L., et al. 2015, MNRAS, 448, 3484 Moresco, M., Pozzetti, L., Cimatti, A., et al. 2013, A&A, 558, A61 Moutard, T., Arnouts, S., Ilbert, O., et al. 2016a, A&A, 590, A103 Moutard, T., Arnouts, S., Ilbert, O., et al. 2016b, A&A, 590, A103 Naab, T., Johansson, P. H., & Ostriker, J. P. 2009, ApJ, 699, L178
Naab, T., Johansson, P. H., Ostriker, J. P., & Efstathiou, G. 2007, ApJ, 658, 710 Onodera, M., Carollo, C. M., Renzini, A., et al. 2015, ApJ, 808, 161
Peng, C. Y., Ho, L. C., Impey, C. D., & Rix, H. 2002, AJ, 124, 266 Poggianti, B. M., Calvi, R., Bindoni, D., et al. 2013a, ApJ, 762, 77 Poggianti, B. M., Moretti, A., Calvi, R., et al. 2013b, ApJ, 777, 125 Pozzetti, L., Bolzonella, M., Zucca, E., et al. 2010, A&A, 523, A13
Prevot, M. L., Lequeux, J., Prevot, L., Maurice, E., & Rocca-Volmerange, B. 1984, A&A, 132, 389
Saglia, R. P., Fabricius, M., Bender, R., et al. 2010, A&A, 509, A61 Saracco, P., Longhetti, M., & Andreon, S. 2009, MNRAS, 392, 718 Saracco, P., Longhetti, M., & Gargiulo, A. 2010, MNRAS, L115+ Saracco, P., Longhetti, M., & Gargiulo, A. 2011, MNRAS, 412, 2707 Scodeggio, M., e. a. 2016, A&A submitted
Scoville, N., Aussel, H., Brusa, M., et al. 2007, ApJS, 172, 1 Shankar, F. & Bernardi, M. 2009, MNRAS, 396, L76
Shen, S., Mo, H. J., White, S. D. M., et al. 2003, MNRAS, 343, 978
Siudek, M., Małek, K., Scodeggio, M., et al. 2016, ArXiv e-prints [arXiv:1605.05503]
Spolaor, M., Kobayashi, C., Forbes, D. A., Couch, W. J., & Hau, G. K. T. 2010, MNRAS, 408, 272
Tamburri, S., Saracco, P., Longhetti, M., et al. 2014, A&A, 570, A102 Trujillo, I., Feulner, G., Goranova, Y., et al. 2006, MNRAS, 373, L36 Valentinuzzi, T., Fritz, J., Poggianti, B. M., et al. 2010, ApJ, 712, 226 van der Wel, A., Franx, M., van Dokkum, P. G., et al. 2014, ApJ, 788, 28 van der Wel, A., Holden, B. P., Zirm, A. W., et al. 2008, ApJ, 688, 48 van Dokkum, P. G., Franx, M., Kriek, M., et al. 2008, ApJ, 677, L5
Whitaker, K. E., van Dokkum, P. G., Brammer, G., et al. 2013, ApJL, 770, L39 Williams, R. J., Quadri, R. F., Franx, M., van Dokkum, P., & Labbé, I. 2009,
ApJ, 691, 1879
Zahid, H. J., Baeza Hochmuth, N., Geller, M. J., et al. 2016, ArXiv e-prints [arXiv:1605.09734]
1 INAF - Istituto di Astrofisica Spaziale e Fisica Cosmica Milano, via
Bassini 15, 20133 Milano, Italy
2 INAF - Osservatorio Astronomico di Bologna, via Ranzani 1,
I-40127, Bologna, Italy
3 Institute of Physics, Jan Kochanowski University, ul. Swietokrzyska
15, 25-406 Kielce, Poland
4 INAF - Osservatorio Astronomico di Trieste, via G. B. Tiepolo 11,
34143 Trieste, Italy
5 INAF - Osservatorio Astronomico di Brera, Via Brera 28, 20122
Milano – via E. Bianchi 46, 23807 Merate, Italy
6 Università degli Studi di Milano, via G. Celoria 16, 20133 Milano,
Italy
7 Aix Marseille Univ, CNRS, LAM, Laboratoire d’Astrophysique de
Marseille, Marseille, France
8 INAF - Osservatorio Astrofisico di Torino, 10025 Pino Torinese,
Italy
9 Laboratoire Lagrange, UMR7293, Université de Nice Sophia
An-tipolis, CNRS, Observatoire de la Côte d’Azur, 06300 Nice, France
10 Dipartimento di Fisica e Astronomia - Alma Mater Studiorum
Uni-versità di Bologna, viale Berti Pichat 6/2, I-40127 Bologna, Italy
11 National Centre for Nuclear Research, ul. Hoza 69, 00-681
Warszawa, Poland
12 INFN, Sezione di Bologna, viale Berti Pichat 6/2, I-40127 Bologna,
Italy
13 Department of Astronomy & Physics, Saint Mary’s University, 923
Robie Street, Halifax, Nova Scotia, B3H 3C3, Canada
14 Aix-Marseille Università c , Jardin du Pharo, 58 bd Charles Livon,
F-13284 Marseille cedex 7, France
15 IRAP, 9 av. du colonel Roche, BP 44346, F-31028 Toulouse cedex
4, France
16 Astronomical Observatory of the Jagiellonian University, Orla 171,
30-001 Cracow, Poland
17 School of Physics and Astronomy, University of St Andrews, St
An-drews KY16 9SS, UK
18 INAF - Istituto di Astrofisica Spaziale e Fisica Cosmica Bologna,
via Gobetti 101, I-40129 Bologna, Italy
19 INAF - Istituto di Radioastronomia, via Gobetti 101, I-40129,
Bologna, Italy
20 Canada-France-Hawaii Telescope, 65–1238 Mamalahoa Highway,
Kamuela, HI 96743, USA
21 Aix Marseille Univ, Univ Toulon, CNRS, CPT, Marseille, France 22 Dipartimento di Matematica e Fisica, Università degli Studi Roma
Tre, via della Vasca Navale 84, 00146 Roma, Italy
23 INFN, Sezione di Roma Tre, via della Vasca Navale 84, I-00146
Roma, Italy
24 INAF - Osservatorio Astronomico di Roma, via Frascati 33, I-00040
Monte Porzio Catone (RM), Italy
25 Department of Astronomy, University of Geneva, ch. d’Ecogia 16,
1290 Versoix, Switzerland
Appendix A: The dependence of D4000non metallicity, timescale of star formation and resolution.
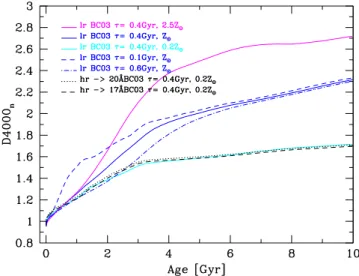
In Fig.A.1we report D4000nfor different BC03 models in order to show the dependence of this quantity on metallicity, timescale of star formation and spectral resolution. Cyan, blue and ma-genta solid lines track the evolution of D4000nwith stellar popu-lation age for BC03 low resolution (lr) models with the same star formation timescale (τ = 0.4 Gyr) and sub-solar (0.2Z⊙)
metal-licity, solar metalmetal-licity, and super-solar (2.5Z⊙) metallicity
re-spectively. Dashed and dot-dashed blue lines show the evolution
Fig. A.1. The D4000n index as a function of the age for BC03 low
resolution models with exponentially declining star formation history and different tau and Z. Magenta, blue and cyan lines correspond to models with τ = 0.4 Gyr and Z = 2Z⊙, Z⊙, and 0.2Z⊙. Dashed and
dot-dashed blue lines indicate models with Z = Z⊙and tau = 0.1 Gyr
and tau = 0.6 Gyr, respectively. Dotted and dashed black lines indicate models with Z = 02Z⊙, τ = 0.4 Gyr and resolution 20AA and 17AA
respectively.
of D4000nfor models with solar metallicity and τ = 0.1 Gyr and
τ =0.6 Gyr, respectively. Finally, dotted and dashed black lines show the D4000nfor two models with the same τ and metallicity but different resolution. In particular, starting from a high resolu-tion BC03 model with τ = 0.4 Gyr and Z = 0.2Z⊙we downgrade
it to 20Å (dotted line) and to 17Å (dashed line), the typical res-olution of VIPERS spectra.
Appendix B: Comparison with the analysis by Fagioli et al.
In this section we repeat the analysis shown in Sect. 5 assum-ing the same definition for dense and less dense passive galax-ies adopted byFagioli et al.(2016). As stated in Sect. 5, Fagioli et al. adopted two criteria to select dense/non dense galaxies: i) cuts at constant Re(i.e. Re<4.5 kpc for dense galaxies and Re> 7.5 kpc for less dense galaxies), and ii) cuts parallel to the SMR. In this second case, the authors fixed the slope to 0.63 and, in any redshift bin, varied the zero-point such to split the sample in three sub-populations which account for the 35 : 30 : 35 % of the total number of galaxies in the redshift bin under consideration. In the upper panels of Fig.B.1the selection criteria are shown for the two extreme redshift bins (0.5 6 z < 0.7 in the left panel and 0.9 6 z 6 1.0 in the right panel).
In the middle left panel of Fig. B.1 we plot the evolution of ageS ED for MPGs with Re <4.5kpc and with Re >7.5kpc (red and green filled points, respectively). The solid arrows track the evolution for the pure aging of the stellar populations from z = 0.95 to z = 0.6. The figure shows that the ageS ED of MPGs with Re <4.5kpc are consistent with a passive evo-lution, and that at any z, less dense galaxies are younger. The middle right panel shows the evolution of the mean D4000nfor the two sub-populations. Open symbols in the right panel indi-cate the D4000nvalues expected from the results of the SED fit-ting (D4000n,S ED, see Sect. 5 for more details on the procedure).