HAL Id: hal-00919493
https://hal.archives-ouvertes.fr/hal-00919493
Submitted on 17 Dec 2013HAL is a multi-disciplinary open access archive for the deposit and dissemination of sci-entific research documents, whether they are pub-lished or not. The documents may come from teaching and research institutions in France or abroad, or from public or private research centers.
L’archive ouverte pluridisciplinaire HAL, est destinée au dépôt et à la diffusion de documents scientifiques de niveau recherche, publiés ou non, émanant des établissements d’enseignement et de recherche français ou étrangers, des laboratoires publics ou privés.
Alaedin Kossi, Jacques Persello, Bernard Cabane
To cite this version:
Alaedin Kossi, Jacques Persello, Bernard Cabane. Acetylacetone stimulus effect on electrorheological properties of TiO2 aggregated nanoparticles.. Journal of Materials Science, Springer Verlag, 2014, 49 (2), pp.811-818. �10.1007/s10853-013-7764-0�. �hal-00919493�
1
Acetylacetone stimulus effect on electrorheological
properties of TiO
2aggregated nanoparticles
Alaedine KossiΏ, Jacques PerselloΏ and Bernard Cabaneΐ
LPMC, CNRS UMR 7336, Université de Nice-Sophia Antipolis, Parc Valrose 06108 Nice, France PMMH, ESPCI, 10 rue Vauquelin, 75231 Paris, Franc
ABSTRACT
We present experimental results on electrorheological behavior under an ac electric field, and dielectric properties of colloidal suspensions composed of aggregated titanium dioxide nanoparticles dispersed in insulating PDMS silicon oil, as a function of adsorbed acetylacetone (Acac) dipolar molecules on TiO2su fa e. The esults sho that the elasti odulus G’ of TiO2-Acac/PDMS ER fluid decreases when the electric field frequency is increased gradually from 10 Hz to 104 Hz. In the range of tested electric field frequencies, we observe that the dielectric properties are given essentially by a i te fa ial pola izatio hi h is a i al at lo f e ue . At lo f e ue = Hz , G’ increases with the increasing Acac/TiO2 su fa e o e age θ f o to . , due to the high polarization of the particles caused by the increase of the charge carriers that move to the interface between TiO2 particles and the insulating medium. For θ = . , G’ ea hes . MPa hi h is . time greater than that of pure TiO2/PDMS ER fluid. Ho e e , G’ de eases i easi g θ e o d 0.45; in such cases, the mismatch on dielectric constant and conductivity between dispersed phase (TiO2) and insulating ediu PDMS egi s to fall as θ i eases because of the increase of Acac dipoles remaining free in PDMS. The performance of TiO2-Acac/PDMS ER fluid at low frequency was alidated a e e si ilit test he e elasti odulus G’ i eases d a ati all and returns to its initial state as soon as several cycles of a switching electric field were applied between 0 and 1 kV/mm successively.
INTRODUCTION
Electrorheological (ER) fluids are made by suspending particles in a liquid dielectric constant and conductivity of which are mismatched to create dipolar particle interactions in the presence of an ac or dc electric field [1]. The ER phenomenon is related to changes in rheology of dispersions. Indeed, in response to an applied electric field, ER fluids increase their resistance to flow, and in some cases, they manifest in the conversion of fluid into solid behavior [2]. The main cause inducing this phenomenon is the polarization of particles which can be aligned in the direction of an applied electric field. For this reason, the ER effect, besides the nature of dispersed particles and insulating liquid, is sensitive to the electric field and its frequency and all additives concentration that can affect the dielectric properties of the fluid. Several authors have shown that the ER response decreases with the increasing frequency of the electric field beyond a frequency of 100 Hz [3]. Other workers have studied the effects of additives such as water, urea, or other polar molecules [4-9] on performance of an ER fluid. These studies have shown that these additives improve the ER response of ER fluids in terms of shear stress or elastic modulus.
2
In this study, our aim is to investigate the influences of adsorbed acetylacetone (Acac), as polar molecules, and electric field frequency, on the dielectric properties and their impacts on the ER espo se of tita iu dio ide ER fluid, i te s of elasti odulus G’ a d loss odulus G”. The hoi e of Acac is motivated by its dielectric and polarizing properties (Acac has a high dielectric constant r ≈
. a d a dipole o e t µ ≈ . D (1D = 3.33564 10-30
C.m)), and because its good affinity with TiO2 surface, we expect that the adsorbed Acac can enhance the ER response of the TiO2 ER fluids.
The system consists of aggregated nanoparticles of titanium dioxide dispersed in silicone oil. In order to control the polarization forces, the dielectric constants of the titanium dioxide particles are modified by adsorbing different Acac concentrations on titanium dioxide surface. We use a Scanning Electron Microscopy, X-Ray diffraction and small-angle neutrons scattering to characterize titanium dioxide morphology, and UV spectroscopy to determine the adsorption isotherm of Acac on titanium dioxide surface. The dielectric properties of titanium dioxide dispersed in silicone oil are measured using impedance spectroscopy. We analyze the ER response under ac electric field depending in adsorbed Acac amount onto TiO2 surface and in electric field frequency.
EXPERIMENTAL SECTION
Synthesis of nanoporous TiO2 powder
Nanosized TiO2 powder was synthesized via a sol–gel method [10], using titanium tetraisopropoxide (Sigma-Aldrich, 98%, solution), 2-Propanol (Sigma-Ald i h, ACS eage t, . % , aluminum isopropoxide (Aldrich, 99.99%), ammonium hydroxide (Sigma-Aldrich,28% NH3 in H2O), Acac (Sigma-Ald i h, Reage tPlus®, % , it i a id Sig a-Aldrich, ACS reagent, 70%), acetic acid (Sigma-Ald i h, ACS eage t, . % a d ult apu e ate M .cm) as starting materials.
In a typical procedure, titanium (IV) tetraisopropoxide (0.388 mol), was rapidly added to ultrapure water (640 ml) and then stirred for 30 min. A white precipitate formed immediately upon addition of the titanium (IV) isopropoxide. The resultant colloid was recovered by centrifugation (10,000 x g for 30 min). The centrifugation cake was added into a jacketed three-necked flask reactor equipped with a mechanical stirring containing 750 ml of an aqueous solution, of molar composition ; 0.36 M nitric acid, 1 M acetic acid and 0.05 M aluminium isopropoxide. The pH of the colloidal solution after addition of the cake was measured to be between 1 and 2.
Peptization occurred after heating the product at 80 °C for 1 h under medium stirring, whereupon the slurry became a stable sol. Then, the sol was cooled down to room temperature, and 17 M ammonium hydroxide solution was added drop wise into the TiO2 sol under mild stirring to form a white gel. The pH of the resultant colloidal suspension was measured to be close to 7. The gel was then collected by centrifugation (10,000 x g for 30 min) and dried at 110°C over night. The powder was crushed and ground into fine powder using a mortar and pestle and was further calcined in air at 500°C for 4 h.
3 Characterization of the nano-porous TiO2 particles
Electron Microscopy was performed on the CCMA EM Core Facility (University of Nice Sophia Antipolis) using a Scanning Electron Microscopy apparatus (JEOL 6700F) to characterize the TiO2 obtained after heat treatment at 500°C. The crystal structure of the obtained TiO2 powder was analyzed using an X-ray diffractometer (CPS120/Cu) (XRD KαCu, λ= , .
Morphological characteristics of aggregated particles can be deduced from the small angle neutron scattering [11] spectra realized on a TiO2 heat-treated at 500°C and dispersed in silicone oil. The SANS experiments of a concentrated TiO2/PDMS suspension are realized at the ILL institute using the D11 instrument. In a typical signal of concentrated dispersions where isotropic interactions between identical particles are considered, the average distance between the nearest neighbors is given by = / 0 where q0 corresponds to the maximum in scattered intensity Imax(q0). In the case of two-phase system, at large q vectors, the interface between particles and solvent is observed at small scale. The Porod limit can be used for a sharp interface (in the normal direction but smooth in any parallel direction) where the scattered intensity decreases as q-4 does at large q. the Porod limit in this case reaches a constant at large q values and is related to the specific area of particles (independently of the shape of the two phase) as [12]:
V S cste I q q qlim 2 ( ) / 2 4 (1) Whe e Δ 2
, given in m-4, is a constant related to the difference in contrast between the TiO2 and PDMS [13], and S/V is the surface per volume unit ratio. The specific area denoted SS (given in m
2 /g) is connected to S/V through the relation:
V S d S TiO s . 1 0 2 (2)
where d0TiO2 is the TiO2 density. q
q
I q4
lim (q.a>10) is determined experimentally by plotting q4Iq
versus q.
For porous systems (aggregates formed from nano-particles assembling), in some cases, the two length scales: nanopores (or nano-particles) of few nanometer on one hand, and micronic grains on the other are largely separated. A typical signal may be obtained where three different regimes a e o se ed o all sa ples: I a Po od’s egi e at lo alues < 1) due to the envelope of the g ai s, II a t a sitio egi e i et ee , a d III a se o d Po od’s egi e at high alues > 2) due to the inner pores of the grains [14]. Solvent PDMS is present in the inner pores and intergrain porosity. Introducing Ve as the total volume of the envelopes of the grains, being the total inner surface of the solid grains, and Se as the total surface of the envelopes of the grains, one gets:
- from high- Po od’s la :
2 2 4 2 1
)
(
2
)
(
)
(
m
q
I
q
V
e (3)4
- from low- Po od’s la :
2 1 4 1 1
)
(
2
)
(
)
(
m
q
I
q
V
S
e e (4)Fi all , o i i g the t o Po od’s la e o tai :
e
S
q
I
q
q
I
q
)
(
)
(
1 4 1 2 4 2 (5) Preparation of ER fluidsIn a typical procedure, several solutions of various amounts of Acac [15] in PDMS oil silicone (Dow Corning Corporation XIAMETER® PMX-200 silicone fluid, viscosity 10 cSt at 25°C) were prepared (in the range of 0 -3.215 wt%). The final ER fluids were obtained by dispersing 5 g of TiO2 powder in 5 g of Acac silicone oil solutions by means of a Sonifier Vibra-cell (75041) ultrasonic apparatus operating at 30% amplitude for 4 min, to have a volume fraction of 0.2 of TiO2 in PDMS. Then the ER fluid was out-gassed at room temperature and at 10-3 Pa for 1 h. Afterward, dry N2 was introduced into the bowl up to a pressure of 1 atm to avoid any contamination by the humidity of the air. The ER fluids were stored in desiccators before use.
Adsorption isotherms of Acac onto TiO2 dispersed in PDMS
Various amounts of Acac were added to TiO2 – PDMS dispersions, and the part of Acac that had reacted with TiO2 in each sample was determined through the depletion method: after 48 h of equilibration, the TiO2 particles were separated through centrifugation, and the concentration of Acac in the supernatants was measured through UV spectroscopy after filtration of the samples through 0.22 µm filters.
We defi e su fa e o e age, θ, as the fraction of the adsorption sites of TiO2 occupied by Acac molecules; at equilibrium we have:
2 2
.
.
TiO TiO Acac a Acac ads AcacS
m
A
N
M
m
(6)where, A°Acac is the area occupied by one molecule of Acac, MAcac is the Acac molar mass, Na is the Avogadro number, mTiO2 is the TiO2 weight and STiO2 is the TiO2 specific area.
The experimental surface coverage can be compared with θ being calculated from the Langmuir equation [16, 17], it is given as follows:
équil Acac équil Acac Langmuir
b
b
1
(7)5
where, equilAcac is the volume fraction of unadsorbed Acac in equilibrium with the dispersion. b is adsorption/desorption equilibrium constant of Acac on TiO2, it is given by following:
kT acac Acac
e
a
kT
m
h
b
/ 3 2 / 3 2.
4
3
.
.
2
(8)where : mAcac Acac aAcac3 2,156.10 25Kg
3 4
is the mass of one Acac molecule, h is the
Pla k o sta t, k is the Boltz a o sta t, T≈ K is the te pe atu e a d is the i te a tio energy between TiO2 and Acac.
Electrorheological measurements
The dynamic properties of electrorheological fluids were measured by means of a Rheometrics Dynamic Analyzer II (RDA II, Rheometrics, Inc., NJ) in time sweeps mode. These measures consist of applying an alternating electric field (Trek Model 609E-5 High Voltage amplifier and Hameg function generator HM 8030-5 on a sample placed between two parallel plane-plane geometry electrodes and measuring moduli as a function of time until a stationary state is reached. The diameter of plane electrode was 25 mm, and the gap between electrodes was 1 mm. The moduli are measured at low shear strains, where dynamic properties are independent of shear strain amplitude. The mobile ele t ode uppe ele t ode applies a os illato shea st ai ith m=0.2% of amplitude, at constant te pe atu e of °C a d ith a a gula elo it of ω= ad/s. A a ete TENMA -7735 Multimeter) is used to measure the electrical current passing through the sample during rheological measurements under applied electric field.
Complex relative permittivity measurement
We use an HP 4192A LF impedance analyzer to measure the dielectric properties of the prepared ER fluids. The frequency range of the applied alternating field was between 5Hz and 1MHz. The dielectric cell consists of parallel stainless steel electrodes separated by a distance l that we can change. The electric circuit can be represented by a parallel equivalent schema (Fig. 1) where we consider the contribution, in total measured impedance (G, C), an impedance (Gk, Ck) due to the sample polarization, a stray impedance (Ge, Ce) due to electrode polarization, and a residual capacitance (Cr) due to the field lines that are not located in the sample. We can determine Ge and Ce by measuring the total impedances at different electrode distances for a given frequency. To calculate Cr, we measure capacitance C of an empty cell as a function of the inverse of distance between electrodes, C is given by:
l S C
6 he e 0 is the vacuum permittivity, S
*
is the electrode effective surface, and l is the distance between parallel electrodes.
Henceforth, once these corrections are made, we can determine the samples impedance (Gk, Ck) [18, 19] that can be related to the complex relative permittivity by:
0 , C Ck rk and 0 , , C Gk rk (10)
where C0 is the vacuum capacitance, a d ω is the a ele t i field a gula f e ue .
Experimental measurements of (εrk’) and (εrk”) obtained from Eq. (10) are fitted by using the Maxwell-Wagner equations [20], yielding εrk’ and εrk” as:
) ' ( 1 ) ' ( ) ' ( ' 2 rk rk s rk rk (11) 0 2 2
'
1
)
'
(
)
'
(
''
rk s rk k rk (12)where, (εrk’)s and (εrk’)∞ are, respectively, the stati alue he ω te ds to a d the opti alue he ω te ds to ∞ of elati e pe itti it , σk’ is the sample conductivity, a d is the ela atio
time of the dielectric function.
7 RESULTS AND DISCUSSION
Morphology and structure of TiO2 aggregated nanoparticles
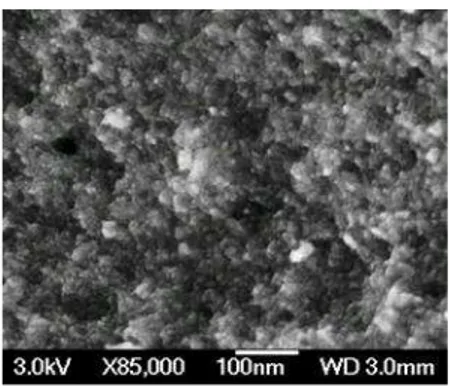
SEM performed on TiO2 after heat treatment at 500 °C (Fig. 2) shows nanosized particles (between 10 and 20nm) highly aggregated forming a porous system. The x-ray spectra (Fig. 3) show that the obtained TiO2 powder had an anatase crystalline structure. The density of TiO2 was determined using a standard flask pycnometer of 5 cm3, and we found a value of 3.84g/cm3 that is close to the TiO2 anatase density (3.89g/cm
3 ).
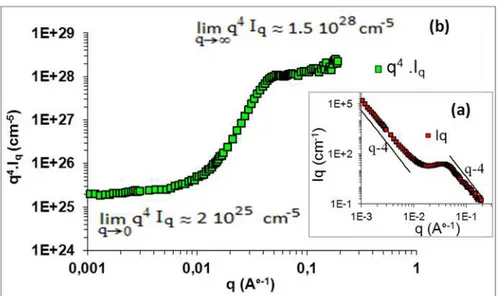
The SANS curve giving the scattered intensity Iq versus wave vector q is shown in (Fig. 4a). A a i u of the s atte ed i te sit is o se ed fo a i te ediate alue of a e e to I a ≈ 3.56.10-1nm-1, hi h ha a te izes the a e age i te pa ti le dista e = / max, in our case (adhesive particles heat treated at 500°C) we can confuse r with the average size of the nanoparticles. We obtain the average radius of the TiO2 a opa ti les a out a ≈ . hi h is i the sa e a ge as that observed in the SEM picture. From the Porod plot (Fig. 4b) at very high value of q (where Iq is proportional to q-4 and q.a>10), we can use the Porod limit (Eqs. (1) and (2)) to calculate the specific area of TiO2 particles. We obtain a specific area SS≈
2
/g. (Fig. 4b) shows also two porod’s regimes: the first for q < q1 = 0.09 nm
-1
which characterizes the interface of the envelope of the grains Se, the second for q > q2 = 0.53 nm-1 which can be attributed to the surface of inner porous structure σ. Usi g Eq. (5), a high atio σ/ Se) = 263 was obtained indicating that the porosity of the system is dominated by inner nanoporous structure.
Fig. 2: SEM picture of TiO2 particles calcined at 500°C/4h.
Fig. 3: X-Ray spectra (XRD KαCu, λ= , pe fo ed o TiO2 particles after calcination at 500°C/4h, black line for synthesized TiO2 calcined at 500°C/4h and red lines for pure TiO2 anatase I41amd.
8
Fig. 4: The SANS spectra of the heat treated TiO2 dispersed in PDMS: (a) giving the scattered intensity Iq (cm-1) versus wave vector q (A°-1); (b) giving the Porod representation q-4Iq (cm-5) as a function of wave vector q
(A°-1)
Influences of electric field and its frequency on electrorheological properties
The elastic modulus G’ a d loss odulus G” fo TiO2-Acac/PDMS ER fluid measured in the applied electric field range 0-4 kV/mm versus electric field frequency are shown in (Fig. 5a, b).
We ote that G’ a d G” de ease ith the increasing electric field frequency, and this occurs whatever be the applied electric field supportable by the sample. We also note that the increase in electric field frequency is accompanied by a decrease in the maximum of electric field Emax supportable by the apparatus. This limitation of applied electric field is due to the appearance of an electric current density which is insignificant at low frequency, but becomes increasingly important as soon as the frequency increases.
Fig. 5: Elasti odulus G’ (a), a d loss odulus G” (b) versus electric field frequency at various applied electric
9
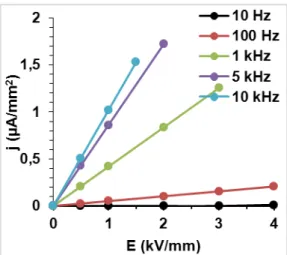
Fig. 6: Variation of the current density with respect to the applied ac electric field at various frequencies.
(Figure 6) illustrates this situation where at lo f e ue = Hz Emax can be up to 4kV/mm, and the electric current density in the sample is very low (j(Emax) =0.01µA/mm
2
), while at high f e ue = kHz Emax is limited to 1.5kV/mm (j(Emax)≈ . µA/ 2); beyond this limit, the measurement is interrupted because of the high conduction in the sample.
Dielectric properties of TiO2-Acac/PDMS ER fluid
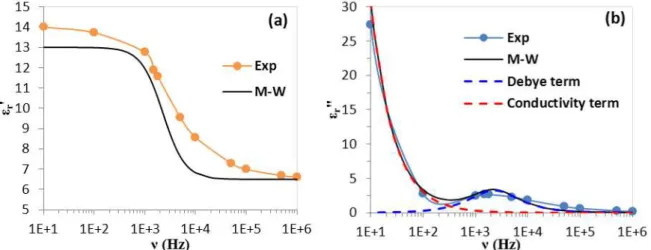
To understand the link between the ER behavior depending on the frequency and the dielectric properties, we have made measurements of the complex impedance versus frequency for TiO2-Acac/PDMS ER fluid. Figure 7 shows the experimental and the calculated results (using the Maxwell-Wagner equations) of the real part of elati e pe itti it r’ Fig. 7a) and imaginary part
r” of elati e pe itti it Fig. e sus f e ue ν fo TiO2-Acac/PDMS ER fluid.
We observe that at low frequency we have a macroscopic polarization due essentially to an interfacial polarization where its contribution to dielectric constant is maximal because the motions of the charge carriers that are accumulated at the interface between TiO2 and insulating medium. At high frequency, the electric field alternates so fast such that the interfacial polarization cannot increase, and there is no contribution to the dielectric constant. However, between these two limits (low and high frequency), at intermediate frequencies, the interfacial polarization begins to lag behind the electric field causing dissipative losses [21]. This energy dissipation is maximal when the loss ta ge t tg = r”/ r’ ea hes a a i u alue at a a gula f e ue ωm thatcan be related to the ha a te isti ela atio ti e as follo s:
m m 1 2 1 (13)
For TiO2-A a /PDMS ER fluid, e fou d ≈ .
-5s, o espo di g to
m about 2.3 kHz. The f e ue elo m determines the range in which charge carriers are mobile on long distances. At f e ue a o e m, the charge carriers are confined to potential wells being mobile on short distance.
10
The influence of frequency on the polarization in terms of dielectric losses caused by the e e g dissipatio i the sa ple a e plai the ER eha io he e the elasti odulus G’ de eases as the electric field frequency increases between 10 Hz and 10 kHz.
Figure 7: TiO2-Acac/PDMS ER fluid dielectric properties, (a) eal pa t of elati e pe itti ity εr’ e sus f e ue y;
(b)i agi a y pa t of elati e pe itti ity εr” e sus f e ue y o pa ed to the al ulated εr’ a d εr” usi g Maxwell-Wagner equations (M-W).
The ER results and dielectric characterization clearly show that ER effect is optimal at low frequency. The following ER experiences will be investigated with a fixed applied electric field E = kV/ a d ith a f e ue = Hz to ha e a ER effect satisfactory without the occurrence of a current strong enough, energy consumer and disruptive of ER measurement.
Influence of the added Acac on electrorheological properties
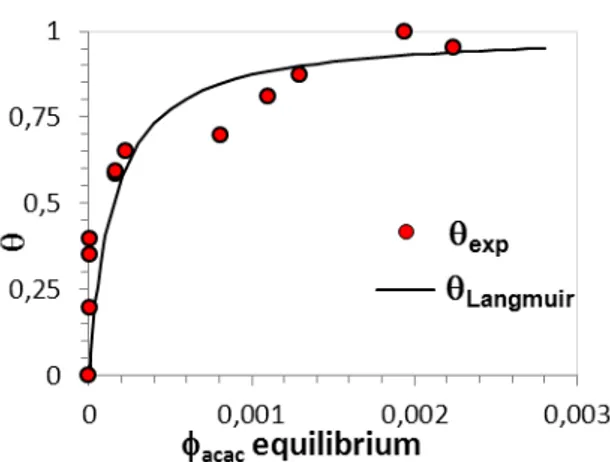
To quantify the role of Acac on the TiO2/PDMS ER properties, the Acac onto TiO2 surface adsorption isotherm is shown in (Fig. . The e pe i e tal esults gi i g the su fa e o e age θ as a function of the volume fraction of free Acac in equilibrium with the dispersion are compared to those calculated from Langmuir equation. The best fit between experiment and Langmuir equation was o tai ed usi g a i te a tio e e g =-8.85 10-20
J (-21.5kT) and an adsorption/desorption equilibrium constant b=6.88 103 where the adsorption of Acac onto TiO2 surface reaches a plateau for θ ≈ . 0 corresponding to a maximum adsorption about 2Acac/nm2
. However, a discrepancy was observed between the calculated and the e pe i e tal esults fo θ > . suggesti g that A a is adsorbed onto TiO2 surface in a multilayer manner. The results show also that the Acac adsorption onto TiO2 su fa e is i tuall total fo θ . , while beyond this limit, the Acac remaining free in PDMS e o es sig ifi a t a d i eases ith su fa e o e age θ.
11
Fig. 8: A a /TiO i PDMS adso ptio isothe gi i g su fa e o e age θ e sus the f ee A a olu e f a tio
at equilibrium in PDMS compared to that calculated trough Langmuir equation.
Fig. 9: Elasti odulus G’ a d loss odulus G” e sus A a /TiO2 surface coverage θ. The ha a te isti s of the applied electric field and the shear strain are, respectively: E=1kV/ νE =10Hz γm = . % a d ωγ = 100 rad/s.
According to the Acac onto TiO2 surface adsorption isotherm, four ER fluids samples were investigated where different situations are represented: pure TiO2/PDMS ER fluid θ= , total A a adsorption onto TiO2 su fa e θ= . , and two samples with partial Acac adsorption onto TiO2 surface, respectively: θ= . a d θ= . . I all sa ples, ΦV (TiO2/PDMS) = 0.2. We carried out
easu e e ts of elasti odulus G’ a d loss odulus G” o the four samples prepared above. Figure 9 ep ese ts the e pe i e tal esults of G’ a d G” o tai ed f o the a ious sa ples prepared according to surface coverage ate, θ, of A a adso ed o to TiO2.
Figure 9 shows that the intrinsic ER properties of TiO2ER fluid ithout addi g A a θ= a e e o e t a d ea h a elasti odulus G’ of a out kPa a d G” of a out kPa ith a applied ac electric field of 1kV/mm and 10Hz of frequency. It also shows that, for the same electric field and dynamic shear rheology conditions, the increase of adsorbed Acac onto TiO2 surface leads to a i ease of G’ u til it reaches a a i u G’max≈ , MPa hi h is . ti es greater than that for pure TiO2/PDMS ER fluid. This maximum corresponds to the su fa e o e age θ≈ .45 (about 1Acac/nm2 . Be o d this li it G’ decreases. As observed in (Fig.8), we can attribute this behavior to the TiO2/Acac/PDMS adsorption equilibrium that may affect the dielectric properties of ER fluid. I deed fo θ . the a ou t of Acac, remaining free in the dispersing medium is negligible. Hence, the increase in surface coverage, from 0 to 0.45, results in an increase of interaction energy between particles due to the improvement of the interfacial polarization of the particles, by increasing the number of charge carriers that move to the interface between the TiO2 particles and the insulating
12
ediu . While fo θ > . , the is at h o diele t i o sta t a d o du ti it et ee dispe sed phase (TiO2) and insulating medium (PDMS) begins to fall as θ i eases due to the increase of Acac dipoles remaining free in PDMS. Therefore, the part of the interaction energy that is dissipated through the insulating medium becomes significant leadi g to a de ease i G’. Figu e shows also, that loss modulus G” e ai s irtually constant over the entire θ a ge. This ea s that adso i g Acac dipoles on TiO2 su fa e, o l the elasti it depe de e of G’ o the i te a tio e e g as influenced by adding Acac, a d i this d a i os illatio o ditio s = . % a d ω =100rad/s) there are no restructuring (no change on viscosity) and the deformation of the aligned structures developed by the applied electric field that still remains unchanged.
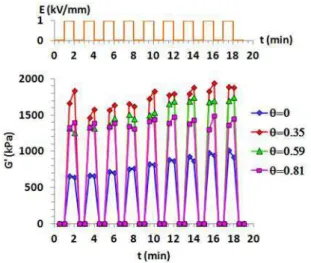
To validate the TiO2-Acac/PDMS ER performance, we carried out measurements of elastic modulus (Fig. he e the applied a ele t i field = Hz s it hes et ee a d kV/ su essi el . We fi d that the elasti odulus G’ i eases d a ati all ith the ele t i field and returns to its initial state as soon as the electric field is removed, and this is reproducible over several cycles where E switches between 0 and 1kV/mm successively. This result confirm that at low f e ue = Hz the studied s ste s a e e e si le.
Fig. 10: Reversibility test; Elasti odulus G’ e sus the s it hi g ele t i field et ee a d kV/ υ= Hz
successively, for different amount of Acac adsorbed on TiO2 surface.
CONCLUSION
ER fluids have been prepared by suspending porous aggregates of TiO2 nanoparticles in PDMS silicone oil. The porous nature of TiO2 aggregates is exploited to adsorb dipolar molecules of Acac onto TiO2 surface. The TiO2 olu e f a tio Φ i PDMS as a out .2. Electrorheological properties of ER fluids are investigated under ac electric field. The esults sho that the elasti odulus G’ of TiO2-Acac/PDMS ER fluid decreases with the gradually increasing electric field frequency from 10 to 104Hz. In the range of the tested electric field frequencies, we observe that the dielectric properties are given essentially by an interfacial polarization which is maximal at low frequency. We studied the influence of the adsorbed Acac in terms of su fa e o e age θ o ER response of TiO2 ER fluids, the applied ac electric field, and its frequency are, respectively: E= kV/ a d = Hz. The result shows that G’ i eases with the i easi g su fa e o e age θ, f o to . , because of the high polarization of the particles caused by the increase of the charge carriers that move to the interface
13
between TiO2 particles and the insulating medium. For θ = . , G’ ea hes . MPa hi h is . times greater than that of pure TiO2/PDMS ER fluid. Ho e e , G’ de eases i easi g θ e o d 0.45; in such cases, the mismatch on dielectric constant and conductivity between dispersed phase (TiO2 a d i sulati g ediu PDMS egi s to fall as θ i eases because of the increase of Acac dipoles remaining free in PDMS. The performance of TiO2-Acac/PDMS ER fluid at low frequency was alidated a e e si ilit test he e elasti odulus G’ i eases d a ati all a d etu s to its initial state as soon as several cycles of a switching electric field were applied between 0 and 1 kV/mm successively.
Acknowledgments
The authors wish to thank Ralph Schweins from the Institut Laue-Langevin (ILL) for technical assistance in SANS experiments. The authors also gratefully acknowledge the financial support from the ANR CNRS.
References
[1] W. M. Winslow, Induced fibration of suspensions, J. Appl. Phys. 1949, 20, 1137-1140 [2] H. Block, J. P. Kelly, Electro-rheology, J. Phys. D: Appl. Phys. 1988, 21, 1661-1677
[3] Hongru Ma, Weijia Wen, Wing Yim Tam and Ping Sheng, Frequency dependent electrorheological properties: origin and bounds, Phys. Rev. Lett. 1996, 77, 2499-2502
[4] F. Ikazaki, A. Kawai, K. Uchida, T. Kawakami, K. Edamura, K. Sakurai, H. Anzai and Y. Asako,
Mechanisms of electrorheology: the effect of the dielectric property, J. Phys. D: Appl. Phys. 1998, 31, 336-347 [5] W. Wen, X. Huang, S. Yang, K. Lu and Ping Sheng, The giant electrorheological effect in suspensions of nanoparticles, Nature Materials, 2003, 2, 727-730
[6] Lu et al. United States Patent, US 7, 981, 315, B2 2011
[7] Min S.Cho, Hyoung J. Choi and Wha-Seung Ahn, Enhanced electrorheology of conducting polyaniline confined in MCM-41 channels, Langmuir, 2004, 20, 202-207
[8] Ying Dan Liu and Hyoung Jin Choi, Electrorheological fluids: smart soft matter and characteristics, Soft Matter, 2012, 8, 11961-11978
[9] Ying Dan Liu, Fei Fei Fang and Hyoung Jin Choi, Silica nanoparticle decorated polyaniline nanofiber and its electrorheological response, Soft Matter, 2011, 7, 2782-2789
[10] S. Music`, M. Gotic`, M. Ivanda et al, Chemical and microstructural properties of TiO2 synthesized by
sol-gel procedure, Science and Engineering, 1997, B 47, 33-40 [11] A. Guinier, Ann. Phys. Paris, 1939, 12, 161-237
[12] D. Marchal, C. Bourdillon and B. Demé, Langmuir, Small-angle neutron scattering by highly oriented hybrid bilayer membranes confined in anisotropic porous alumina, 2001, 17, 8313-8320
[13] J. Schweizer, Neutrons et matériaux: introduction, J. Phys. IV (France), 2003, 103
[14] L. Girard, M. Arab, O. Spalla, Time resolved alteration process of oxide glasses, Journal of Colloid and Interface Science, 2008, 319, 214-225
[15] G. Buemi, C. Gandolfo, Malondialdehyde and acetylacetone. An AM1 study of their molecular structures and keto–enol tautomerism, J. Chem. Soc., Faraday Trans. 2, 1989, 85 (3), 215-227
14
[16] I. Langmuir, The constitution and fundamental properties of solids and liquids, JACS, 1917, 39, 1848-1906 [17] Y. Liu, J. I. Dadap, D. Zimdars, and K. B. Eisenthal, Study of interfacial charge-transfer complex on TiO2
particles in aqueous suspension by second-harmonic generation, J. Phys. Chem. B, 1999, 103, 2480-2486 [18] Z. Mimouni, Ph.D Thesis, University of Nice Sophia-Antipolis, France (1990)
[19] Q. Wu, B. Yuan Zhao, C. Fang and K. Ao Hu, An enhanced polarization mechanism for the metal cations modified amorphous TiO2 based electrorheological materials, Eur. Phys. J. E, 2005, 17, 63-67
[20] L. M. Dudley, S. Bialkowski, D. Or and C. Junkermeier, Low frequency impedance behavior of
montmorillonite suspensions: Polarization mechanisms in the low frequency domain, Soil Sci. Soc. Am. J. 2003, 67, 518-526