Science Arts & Métiers (SAM)
is an open access repository that collects the work of Arts et Métiers Institute of
Technology researchers and makes it freely available over the web where possible.
This is an author-deposited version published in:
https://sam.ensam.eu
Handle ID: .
http://hdl.handle.net/10985/11876
To cite this version :
Artem GERASIMENKO, Mikhail GUSKOV, Philippe LORONG, Jérôme DUCHEMIN, Alexander
GOUSKOV - Experimental Investigation of Chatter Dynamics in Thin-walled Tubular Parts
Turning - In: Thirteenth International Conference on HIGH SPEED MACHINING, France, 2016-10
- Thirteenth International Conference on HIGH SPEED MACHINING - 2016
Any correspondence concerning this service should be sent to the repository
Administrator :
archiveouverte@ensam.eu
Experimental Investigation of Chatter Dynamics in Thin-walled Tubular Parts Turning
A. Gerasimenko1,2, M. Guskov1, P. Lorong1, J. Duchemin1, A. Gouskov21 PIMM Laboratory, Arts et Metiers ParisTech, CNRS, CNAM, Paris, France 2 Bauman Moscow State Technical University, Moscow, Russia
Abstract
Chatter prediction is nowadays frequently carried out for machining operations involving deformable parts or tools. These analyses are commonly based on the uncoupled elements of the system: frequency response of the deformable parts under non-rotating conditions and cutting law. The present investigation puts forward the dynamics of a thin-walled tubular part during straight axial turning undergoing chatter instability. Studied system’s peculiarities include quasi-static nominal cutting conditions and twin flexural modes featuring strong variation of modal characteristics along the pass.
The measurement records, based mainly on fixed-frame non-contact eddy-current displacement probes, are performed during the machining operation. Additional hammer modal analysis tests are also carried out. As can be observed from time and spectral analysis of the records, the system's response features several characteristic phenomena as, for example, twin mode separation. The influence of different factors, such as the additional stiffness due to the tool presence, gyroscopic effects and the fixed sensors measurement on rotating part is investigated.
Keywords:
Turning, Chatter, Thin-walled parts, Experiment, Variable frequencies
1 INTRODUCTION
Machining of thin-walled parts, due to the workpiece compliance, is prone to vibrations. A particularity of thin-walled structures machining is the variation of the dynamical properties coming from matter removal. One of the first detailed accounts of chatter occurring during the turning thin-walled cylindrical parts was provided by Arnold in 1961 [1], Thin-walled structures elastodynamics have since been addressed in detail, but few works since then have investigated the machining-induced vibrations of such structures in case of turning. In 2002 Mehdi et al. [2, 3] have reported results of investigations on thin-walled tubular parts turning with chatter, principally arguing the damping aspect. Lorong et al. in 2011 [4] have presented a time domain numerical simulation approach, qualitatively reproducing experimentally observed chatter-induced vibrations.
Among various causes of vibrations induced in machining, an important one is regenerative mechanism, leading to chatter. This phenomenon, first explained in years 1950 by Tobias [5] and Tlusty [6], based on a delay term due to the previous turn’s influence on the current tool-workpiece interaction, has given place to a now classical analysis approach involving stability lobe diagrams [7]. Gerasimenko et al. have carried out an application of this approach to thin-walled tube under turning in 2015 [8].
One of the limitations in experimental investigations of chatter vibrations is the frequency range of classical cutting dynamometers, disabling valid dynamic force assessment for some configurations, such as the one studied by [4,8], with vibrations above 1.5 kHz. Thus, partial or indirect measurements are mostly used, non-rotating part and non-cutting tool modal analysis, tool-workpiece interaction dynamometry on stiff part etc. The purpose of the present work is to go further in the detail of the complexity of measured displacement response during a turning pass on a tubular part involving chatter. The issue is addressed via time-frequency
analysis of measured signals as well as by numerical and analytical investigations.
The paper is composed as follows. The experimental setup is presented as well as the studied turning operation in section 2 alongside a finite element model of the workpiece. Global time-frequency post-processing of the measured signals with FEM analysis of matter removal influence are exposed in section 3. Finally, the influence of different factors related to the rotation and to the tool presence on the measured response spectrum is then carried out in section 4.
2 EXPERIMENTAL SETUP
2.1 Instrumented tubular part experiment
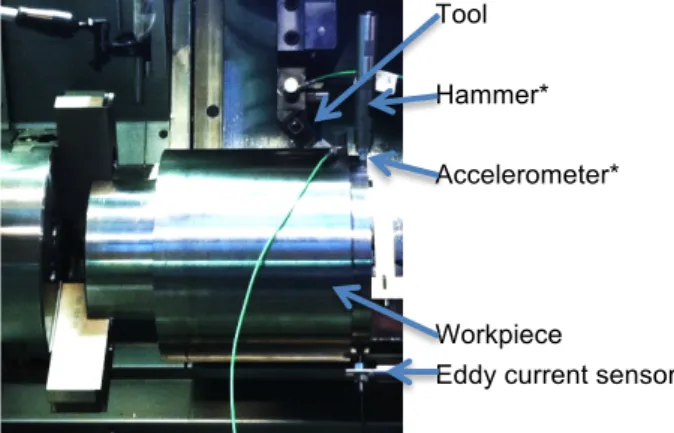
The addressed case consists in turning a clamped-free tubular part (Figure 1, Table 1). A photograph of the workpiece, tool and instrumentation is shown on Figure 2. The present investigation is based on the non-contact measurement of displacement on the outer surface at the free end of the part (eddy current probe). Hammer tests are also carried out before and after the machining pass. After machining, the remaining thickness of the tube is e=4.4 mm.
Feed (axial) f = 0.25 mm/turn Penetration (radial) Ap = 1 mm
Rotation period T = 79.14 ms Outer diameter (final) D = 158.3 mm
Inner diameter d = 149.5 mm Workpiece material C38 steel
Tool holder reference Sandvik MS SNR 2525 M12 Tool insert reference SCMT 432-PR
Figure 1: Workpiece and turning operation schematic. Tool
Hammer* Accelerometer*
Workpiece
Eddy current sensor
Figure 2: Workpiece, tool and instrumentation (* hammer and accelerometer absent during turning).
2.2 Finite element model
In order to better analyze the frequency contents of the measured signal we have elaborated a finite element model of the tube and its fixture (the 3 jaws of the chuck). This model uses 10 nodes parabolic tetrahedrons. Material data are: Young modulus 2.1∙1011Pa, density 7800 kg/m3, Poisson ratio 0.3.
The model takes into account the effect of the tool progression. This can be seen on Figure 3 (with noticeable exaggeration on this figure in order to render it clearly visible). This taking into account is necessary as matter removal modifies the thickness of the workpiece, and thus its mass and stiffness. That implies a variation of the computed eigenfrequencies (modal analysis) of the system.
Figure 3: Finite element model. Left: workpiece mesh for a machining evolution with tool location at the middle of
workpiece. Right: 3 lobes eigenmode
Due to the cyclic symmetry of the system (tube and fixture) non-axial or torsional modes are twin modes. The convergence of this FE model has been checked (with more refine meshes than on Figure 3) and the relative errors of all numerical eigenfrequencies plotted on Figure 5 are estimated lower than 0.5 %.
The discrepancies between eigenfrequencies obtained by the hammer tests (before and after the machining) and computed eigenfrequencies are less than 1.1 % (for a
frequency up to 5500 Hz). Thanks to this very close agreement between experimental and numerical eigenfrequencies we can associate modal shapes to experimental frequency data.
3 GENERAL OBSERVATIONS
During the above-described pass, the following raw time signal (Figure 4) has been recorded:
Figure 4: Raw time signal from displacement sensor. On this plot, one can notice the following features:
• beginning of the cut (step-shaped offset) at t=16.7 s, • chatter bursts at t>45 s,
• strong distance increase due to the matter removal under the sensor at t>66.7 s.
The time-frequency analysis of this signal is presented on Figure 5 as a spectrogram.
Figure 5: Spectrogram of the time signal from displacement sensor (color plot: FFT,
o – eigenfrequencies from hammer tests,
+ – eigenfrequencies from FEM,
x – multiples of 1661 Hz).
It is important to notice that the choice of size of time blocks used in the Fourier analysis is subject to antagonistic arguments:
• longer blocks provide higher frequency resolution and higher signal-to-noise ratio
• shorter blocks provide better time resolution in the context of fast variations, such as encountered in the end of the experiment
Thus, for the plot on Figure 5 the blocksize covers 8 spindle revolutions, which enables readable spectrogram (relatively low noise) over a wide frequency range. One can observe from this plot that the signal is mainly composed of two contributions: invariant wideband contribution mostly present in lower frequency range (f<1kHz) and several narrowband higher frequency components (f>1kHz). The former can be mainly attributed to the cutting process itself while the latter
Tool
Axial position eddy current probe Spindle axis 165 mm 8 mm P(t) Feed direction e Jaw Cut section 158.3 mm
follows the eigenfrequency evolution due to the matter removal. This eigenmode-based nature is confirmed by the values of the eigenfrequencies issued from the hammer tests before and after the pass, superimposed on the spectrogram with circle marks: they correspond clearly to the ends of the respective curves visible on Figure 5. Further insight is provided by the finite-element analysis presented below.
One can also notice that these curves occur by pairs, like ski tracks, spaced by 50…120 Hz.
Finally, it appears clearly that the dominant component, especially starting from t=35 s, is provided by the mode for which the frequency evolves from 1900 to 1660 Hz. The intensity of the response on this mode causes the presence of multiples (2x and 3x), can be observed in the final quarter of the pass (highlighted by cross marks on the right side of the plot). This is likely caused by the nonlinearity of the tool-workpiece interaction, excited by the large magnitude of the response of this mode. A zoom on this frequency range is shown on Figure 6 (here the FFT was performed on 4xT time segments). The time plot shows that the measured displacement signal is principally composed by this component (the black line represents the signal filtered in the band of 300 Hz around this main eigenmode). One can see in more detail that, as mentioned above, there exists more than one line along which the eigenfrequency varies. Two main branches vary are spaced by 60—70 Hz.
Figure 6: Measured displacement signal: Zoom on the principal frequency component (top: displacement signal filtered in the 300 Hz frequency band
surrounding the principal resonance; bottom: zoomed spectrogram).
Another characteristic feature for the response of this eigenmode is that the frequency is not varying continuously, but rather by discrete steps, causing a stair-type evolution. This aspect is in very good agreement with the assumption of regenerative-chatter-induced mechanism, involving several instability zones. Thus, the observed bursts (higher magnitude segments of the time plot, corresponding to the passage of the respective red spots on the spectrogram) are caused by the regenerative chatter mechanism, as described in [8]: in different instability zones, the chatter frequency would be close to a different multiple of the delay (spindle revolution period).
In the presented context, the subject of the present work is to analyze the interpretation of feature these modal components of the response: the frequency variation and the double branch (“ski track”) shape.
4 UNSTABLE MODE RESPONSE SPECTRUM
The principal phenomena that are examined here in search of possible explanation of the qualitative difference between the modal analysis of the non-rotating part (twin modes with equal eigenfrequencies) and the measurements (split into “ski tracks”), are the following
- Coriolis effects,
- stiffness asymmetry due to the tool presence, - measurements in the fixed frame of the
vibrations of the rotating part. These aspects are illustrated on Figure 7.
Figure 7: Considered factors for observed frequencies dynamics: rotating part, fixed sensor, apparent cutting
stiffness.
For the purpose of the analytical description of the contribution of a shell bending mode, represented by a pair of generalized degrees of freedom (q1 and q2), we
approximate the displacement field as follows:
ur (t, x,θ) = φ(x) (q1(t)ψ1(θ) + q2(t)ψ2(θ)) (1)
with ur radial displacement, x and φ(x) axial coordinate
and shape function respectively, θ and ψi(θ)
circum-ferential coordinate and shape functions respectively. In the case of the eigenmode of interest, φ(x) is obtained from a polynomial interpolation of the FEM modal analysis results (mass-normalized) while the functions reflect the
mth circumferential harmonics
ψ1(θ) = cos mθ; ψ2(θ) = sin mθ (2)
with m = 3, as shown on Figure 8.
The matrix equation of motion for this pair of DOF can be written as follows:
M q!! + C q! + K q = f (3)
Here q = [q1, q2]T is the vector of dynamical variables, f is
the vector of modal excitations, M, C and K are respectively mass, generalized damping and stiffness matrix.
For the non-rotating, non-machined structure, we have the following unperturbed values for the system’s matrices:
Here ωo is the double mode eigenfrequency, ζ modal damping factor, I identity matrix. In these conditions, the eigenfrequencies are equal to the reference value:
ω1,2 = ωo. (5)
Figure 8: Shape approximation functions for the mode of interest. (top: axial, φ(x); bottom: circumferential, ψ1,2(θ)).
4.1 Coriolis effect
Under rotation, the Coriolis effect would modify the damping term:,
C = Co + ΩG, G = Γ 𝟎 −𝟏
𝟏 𝟎 . (6)
with Ω spindle rotation velocity, Γ modal gyroscopic factor. The latter is computed for mass normalized eigenmode shapes, under assumption of constant shell thickness h: Γ = 𝜋 ! ! m ρ h 3 φ2 dx = mh2/3D2 (7) 3 D!!𝜋 D ρ hφ2 dx
The perturbation of the eigenvalues can be estimated by direct numerical computation from the polynomial eigenproblem:
(λ2M + λC + K) ϕ = 0. (8)
At small values of γ, the presence of gyroscopic terms leads to a quasi-symmetric split frequencies
ω1,2 ωo ΔωG. (9)
In our case of Ω and γ, eigenfrequencies of the system with gyroscopic terms would only very slightly differ from ω ( ΔωG<0,01 Hz). Thus, the Coriolis effects are negligible
in our case.
4.2 Additional stiffness due to cutting
The presence of the tool would bring about an additional
stiffness in the zone of the tool-workpiece interaction.
The tangent slope of the cutting law in radial direction defines this stiffness. For the cutting conditions at hand, this value is kr = 527 N/mm.
The value of kr is extracted from the cutting law [8]. For a
given local radial displacement ur of the machined surface
of the tube under the tool, the chip thickness h and the chip width b are given by (see Figure 9):
h = f sin κr + ur cos κr (10)
b = (ap + ur) / sin κr
Figure 9: Chip thickness and width taking into account a radial motion coming from the deformation of the part For cutting force F expressed in the basis (n, a, g) associated to the cutting edge, F= Fn n + Fa a + Fg g,
where we use a Kienzle cutting law [9][10] for each component:
Fj = Kj 𝑏 ℎ!" with 𝑏 =!!
!, and ℎ =
!
!!, 𝑗 ∈ {𝑛, 𝑎, 𝑔} (10)
where h0= 1 mm is a reference length (dimensionless
form), Kj and nj parameters depending on the tool/matter
couple and cutting condition (Table 2).
Component Kj (N) nj
Fn 1278. 0.5843
Fa 0.0 0.0
Fg 402.8 0.3405
Table 2: Kienzle cutting law parameters The stiffness kr is then defined by:
kr =!!! !!!= !!! !! !! !!!+ !!! !" !" !!!= kg 𝑏ℎ !" !!!"# !! ! ! + ! ! !"# !! (11)
Given the tool axial and angular location (xT = ft /T, θT =
0), the modal stiffness matrix would be modified as follows
K = Ko + Kc, Kc = kr φ2(xT) 𝟏 𝟎𝟎 𝟎. (12)
This stiffness term would induce the perturbation of the eigenfrequecy related to the first DOF:
ω1 = ωo +ΔωC , ω2 = ωo. (13) To the first order, this perturbation can be estimated as follows:
ΔωC kc φ2(xT)/2ωo, (14)
which corresponds to a variation that increases from 0 to 10 Hz along the pass.
4.3 Fixed frame measurement
We now consider the influence of the rotation on the measurement by a fixed sensor, on an example of harmonic vibration with an m-lobe shape, in the rotating frame attached to the workpiece. The displacement field can be written in a way that is similar to (1):
Hence, the displacement ws, measured by a sensor
located at (xs, θs), would read
ur s(t)= ur (t,xs,θs)= φ(xs)
(
cos(mθs + (ω−mΩ)t)+ cos(-mθs + (ω+mΩ)t)
)
/2,(16) thus yielding two frequency components
ωs1,2 ω Δωs, (17)
centred on the vibration frequency and spaced by 2Δωs =
2mΩ.
In the case (m = 3) of the considered mode, it would lead to 75.6 Hz difference between these two components. This value corresponds to the observed distance between the principal response and another branch visible on Figure 6.
4.4 High vibration behavior
It should be noted though that, at high vibration magnitudes (for t>50s), the response is significantly enriched. This is most probably due to the nonlinear character or the tool-workpiece interaction. This nonlinear aspect is corroborated by the presence of multiple frequency components in this area, visible on Figure 4. Although the resulting surface features interrupted cut track, similar to that observed by Arnold [1], actual cutting is not discontinuous. This is due to vibration magnitude limitation at the flank face. Indeed, the vibration-induced relative radial motion of the workpiece surface w.r.t. tool, shown on Figure 10, would lead to a variation of apparent instantaneous clearance angle:
Δγ = atan ( ur! cos κr / Vc ) (18)
On Figure 10, this motion is shown in the section normal to the primary cutting edge (A—A , also indicated on Figure 9),
Figure 10: Actual clearance angle under vibration (section normal to the primary cutting edge; 1: nominal clearance
angle γ, 2: clearance angle perturbation Δγ due to vibration).
Under harmonic vibration assumption, an estimation of the radial velocity ur! can be made based on the
displacement magnitude:
ur!
max (xT,θT) ur max(xT,θT) ω (19)
Thus, based on the tool insert clearance angle γ, the maximum possible magnitude for the displacement magnitude can be deduced:
urmax (xT,θT) < Vc tan γ / ω cos κr (20)
Given the tool manufacturer’s data (nominal value of the clearance angle γ = 7°), the value of ur max (xT,θT) would
not exceed 0.1 mm. This order of magnitude is consistent with the observed displacement signals and is considerably below 0.25 mm necessary for the overall cut interruption.
So, under high vibrations, the cut would remain continuous. Nevertheless, the process would involve intermittent ploughing which would bring about highly nonlinear interaction accompanied with the observed complex spectrum.
5 CONCLUSION
A numerical model based on the finite element analysis contributes to a detailed interpretation of the matter removal effect on the dynamical characteristics of the workpiece. These results enable an analysis of several factors potentially intervening in the spectral contents of the response: Coriolis effects, additional stiffness due to the tool-workpiece interaction, measurement on rotating part from fixed frame. One particular mode is considered, the one involved in regenerative chatter.
Among these phenomena, the following hierarchy has been found: the Coriolis effects have no visible impact on system’s frequencies; the cutting zone stiffness could shift the eigenfrequency by up to 10 Hz on considered mode; the frequency split induced by the measurement in the fixed frame is, alongside the matter removal, the main factor shaping the spectrum of the response.
Finally, a kinematic analysis in the high vibration part of the experience has shown that although the cut would remain continuous thanks to ploughing, this very ploughing would be likely to produce complex spectrum.
6 REFERENCES
[1] Arnold, R.N., 1961. Chatter Patterns Formed on the Surface of Thin Cylindrical Tubes during Machining.
Journal of Mechanical Engineering Science, 3(1):7–
14.
[2] Mehdi, K., Rigal, J.F. & Play, D., 2002a. Dynamic behavior of a thin-walled cylindrical workpiece during the turning process, Part 1: Cutting process simulation. Journal of manufacturing science and
engineering, 124(3):562–568.
[3] Mehdi, K., Rigal, J.F. & Play, D., 2002b. Dynamic behavior of a thin-walled cylindrical workpiece during the turning process, Part 2: Experimental approach and validation. Journal of manufacturing science and
engineering, 124(3:569–580.
[4] Lorong, P., Larue, A. & Perez Duarte, A., 2011. Dynamic Study of Thin Wall Part Turning. Advanced
Materials Research, 223:591–599.
[5] Tobias, S. & Fishwick, W., 1958. Theory of regenerative machine tool chatter. The Engineer, 205:199–203.
[6] Tlusty, J. & Polacek, M., 1957. Beispiele der behandlung der selbsterregten Schwingung der Werkzeugmaschinen. FoKoMa, Hanser Verlag,
Munchen.
[7] Cheng, K., 2008. Machining Dynamics: Fundamentals, Applications and Practices, Springer.
[8] Gerasimenko, A., Guskov, M., Duchemin, J., Lorong, P., Gouskov, A., 2015. Variable Compliance-related Aspects of Chatter in Turning Thin-walled Tubular Parts. Procedia CIRP, 31:58–63.
[9] Jayaram, S., Kapoor, S.G., and Devor, R.E., 2001. Estimation of the specific cutting pressures for mechanistic cutting force models. Int. J. Mach. Tools
& Manufacturing, 41/2 :265–281.
[10] Kienzle, O., 1951. Die Bestimmung von Kräften und Leistungen an spänenden Werkzeugen und Werkzeugmaschinen. Z-VDI, 94 :299–305.