A comparison of aircraft trajectory-based and
aggregate queue-based control of airport taxi processes
The MIT Faculty has made this article openly available.
Please share
how this access benefits you. Your story matters.
Citation
Hanbong Lee, I. Simaiakis, and H. Balakrishnan. “A comparison
of aircraft trajectory-based and aggregate queue-based control of
airport taxi processes.” Digital Avionics Systems Conference (DASC),
2010 IEEE/AIAA 29th. 2010. 1.B.3-1-1.B.3-15. Copyright © 2010,
IEEE
As Published
http://dx.doi.org/10.1109/DASC.2010.5655526
Publisher
Institute of Electrical and Electronics Engineers / American Institute
of Aeronautics and Astronautics / IEEE Aerospace and Electronic
Systems Society
Version
Final published version
Citable link
http://hdl.handle.net/1721.1/65943
Terms of Use
Article is made available in accordance with the publisher's
policy and may be subject to US copyright law. Please refer to the
publisher's site for terms of use.
A COMPARISON OF AIRCRAFT TRAJECTORY-BASED AND AGGREGATE
QUEUE-BASED CONTROL OF AIRPORT TAXI PROCESSES
Hanbong Lee, Ioannis Simaiakis, and Hamsa Balakrishnan, Massachusetts Institute of Technology,
Cambridge, MA
Abstract
There is significant potential to decrease fuel burn, emissions, and delays of aircraft at airports by optimizing surface operations. A simple surface traffic optimization approach is to hold aircraft back at the gates based on aggregate information on surface queues. Depending on the level of surface surveillance and onboard equipage, it may also be possible to use a more complex approach, namely, to simultaneously optimize the surface trajectories of all taxiing aircraft. Using data from the Detroit Metropolitan Wayne County airport (DTW), this paper compares the benefits of the two approaches, and finds that at a relatively uncongested airport such as DTW, the aggregate queue-based approach only yields modest improvements in taxi-out time, while the trajectory-based approach yields a nearly 23% decrease in average taxi-out time (achieving the average unimpeded taxi-out time).
Introduction
Aircraft taxiing on the surface contribute significantly to taxi delays, fuel burn and emissions at busy airports. A promising approach to making airports more efficient is to optimize the taxiway operations with the objective of minimizing the taxi times, and thereby the associated fuel burn and emissions. Departing flights are held back at their gates during congested time periods, thereby reducing taxi times without impacting the airport throughput or the average flight delays. This tactical scheduling method is called gate-holding.
In this paper, we investigate two different approaches for implementing the gate-holding strategy. The first method manages the traffic flow in an aggregate manner by keeping track of the departing aircraft on the ground or the demand rate at the runways. The second method optimizes the departing traffic taxi times on a flight-by-flight basis using a detailed node-link model of the airport and an integer programming-based optimization to decide the optimal dispatching times. The two methods
differ in their modeling fidelity, and also in the cost and complexity of preparation and implementation. They also differ in the design philosophy as the individual aircraft-based approach assumes more equipage and control authority than the aggregate approach. However, both of them are implemented as tactical tools aiming at mitigating the impact of congestion, and not as strategic scheduling tools.
The remainder of this paper is organized as following. First, we describe an aggregate queue-based control approach. Then, we describe an individual aircraft trajectory-based control approach, which uses integer programming. The benefits of the individual aircraft-based (integer programming) and the aggregate queue-based approaches are evaluated and compared, in order to assess the benefits of automating taxi processes, and of increasing the level of control authority by establishing required times of arrivals at multiple intersections on the airport surface. The two methods are evaluated through a simulation study using a day of schedule data from Detroit Metropolitan Wayne County airport (DTW).
Background
There have been several prior efforts focused on improving the efficiency of airport surface operations, and reducing taxi times and emissions. As part of the development of the Departure Planner, there was a comprehensive discussion about the air traffic flow restrictions in the terminal area and potential control points for surface operations [1]. Based on the discussion, runways were considered as the limiting factor for airport capacity [2], and taxi-out times were estimated using a queuing model [3, 4]. Such aggregate queue-based approaches can be considered Eulerian models of surface operations. Simaiakis and Balakrishnan developed a predictive queuing model to estimate the travel times of aircraft from gates to the departure runways by including the effect of taxiway interactions. They also used this model to evaluate the potential reduction in taxi times, fuel burn and emissions from queue management strategies [5].
There have also been several prior approaches to optimizing surface operations for surface trajectory-based operations. These approaches are typically aimed at determining the optimal times for each aircraft to reach significant control points along its taxi route, while considering the movements of the other flights on the ground. Such individual aircraft-based (or Lagrangian) approaches include Dynamic Programming-based taxi route optimization using Dijkstra's algorithm [6], Time-Dependent Shortest Path techniques [7], and Mixed Integer Linear Programming (MILP) formulations ([8-13]).
The integer programming model used in this paper for the trajectory-based optimization of taxiway operations proposed in this paper is derived from prior work by the authors, using data from DTW airport [13].
Aggregate Queue-Based Approach
This section builds on and extends earlier work on queuing modeling of the airport departure process [5], by considering the case of airports for which the runways are best modeled as independent servers. The taxi-out time of an aircraft is represented as the sum of three components, namely, the unimpeded taxi-out time, the time spent in the departure queue, and the congestion delay due to ramp and taxiway interactions. This representation attempts to model the main characteristics of the departure process, namely: Aircraft pushback from their gates according to the pushback schedule, enter the ramp and then the taxiway system, and taxi to the departure queue, which is formed at the threshold of the departure runway(s). As they taxi from the gate to the runway, aircraft interact with each other. For example, aircraft queue to gain access to a confined part of the ramp, to cross an active runway, to enter a taxiway segment in which another aircraft is taxiing, or they get redirected through longer routes to avoid congested areas. We cumulatively denote these spatially distributed queues and delays, which occur while aircraft traverse the airport surface from their gates towards the departure queue, as ramp and taxiway interactions. After the aircraft reach the departure queue, they line up to await takeoff. We model the departure process as a server, with the departure runways “serving” the departing aircraft in a First-Come-First-Serve (FCFS) manner. A schematic of the departure process is depicted in Figure 1.
Figure 1. Conceptual Queuing Model of the Departure Process
Mathematically, the taxi-out time (τ) can be very simply represented as the sum of three terms:
τ
=τ
unimped+τ
taxiway+τ
dep.queueIn prior work [5,14], we showed how the three terms comprising the taxi-out time, namely the unimpeded taxi-out time (τunimped), the taxiway-related delay (τtaxiway), and the queuing at the runways (τdep.queue) could be determined for Boston Logan International Airport (BOS) and Newark Liberty International Airport (EWR). While we showed that the runway service process at both BOS and EWR could be modeled as a single-server process, DTW typically uses two runways for departures 21R (or 3L), and 22L (or 4R) under VMC. They are operationally independent; and have distinct departure queues. The runway demand tends to be unbalanced, and the two runways tend to serve aircraft of different weight categories. For these reasons, the fidelity of the model is enhanced by modeling them as two separate servers and not as a single one with capacity the sum of the capacities of two single runways, as shown in Figure 2.
Figure 2. Queuing Model of DTW Departure Process.
Model Inputs and Outputs
We define the following quantities:
• P(t): the number of aircraft pushing back during time period t, which is obtained from the pushback schedule.
• N(t): the number of departing aircraft on the surface at the beginning of period t.
N(t) reflects the congestion from departing
aircraft on the ground.
• N1(t): the number of departing aircraft on
the surface at the beginning of period t departing from runway 21R. N1(t) reflects
the departure demand of runway 21R. • N2(t): the number of departing aircraft on
the surface at the beginning of period t departing from runway 22L. N2(t) reflects
the departure demand of runway 22L. • Q1(t), Q2(t): the number of aircraft waiting
in the departure queue of runway 21R and 22L, respectively, at the beginning of period t. The departure queue is defined as the queue, which is formed at the threshold of the departure runway, where the aircraft queue for takeoff.
• R(t): the number of departing aircraft taxiing in the ramp and the taxiways at the beginning of period t (i.e., the number of departures on the surface that have not reached the departure queues).
• R1(t), R2(t): the number of departing aircraft taxiing in the ramp and the taxiways at the beginning of period t with destination runway 21R and 22L, respectively.
• C1(t), C2(t): the (departure) capacity of departure runway 21R and 22L respectively, in period t.
• T(t): the total number of takeoffs during period t.
• T1(t), T2(t): the number of takeoffs during period t from runway 21R and 22L, respectively.
Using the above notation, the following relations are satisfied: N(t) = Q(t) + R(t) N(t) = N(t −1) + P(t −1) − T(t −1) N(t) = N1(t) + N2(t) R(t) = R1(t) + R2(t) Ni(t) = Qi(t) + Ri(t) Ti(t) = min(Ci(t),Qi(t)),i ∈ 1,2
{ }
Unimpeded Taxi Time Estimation
The unimpeded taxi-out time is defined as the taxi-out time under optimal operating conditions, when neither congestion, weather, nor other factors delay the aircraft during its movement from gate to takeoff [15]. In other words the unimpeded taxi time consists of the free-flow travel time of the aircraft from its gate until its takeoff roll, in addition to other events necessary for a departure, such as towing from the gate, engine-start, communications with the ATC, etc., under optimal operating conditions. The unimpeded taxi time therefore depends primarily on the start and the end points of each aircraft’s taxi route, but also on the airline (due to differences in procedures, etc.) It can also depend on the stuffing of the ATC, the pilot and the aircraft. In order to account for the most significant factors impacting the unimpeded taxi time, the unimpeded taxi time is usually calculated as a function of:
• The airline ([4], [5] and [15]) which reflects the starting point (gate location) of each aircraft at most airports in the US, since most major airlines own/lease a group of gates at an airport.
• The runway configuration ([4], [5]) reflects differences between the location and the number of the departure runways. • The weather conditions ([4], [5]), since
visual vs. instrumental weather conditions can significantly impact the speed of the flow of aircraft through the airport.
In the case of DTW, we have to modify the set of explanatory variables, since the airline information does not entirely capture the gate location (Delta/ Northwest operates out of all gates of McNamara terminal, which is one mile long). We therefore use the gate as a surrogate for the start point of each taxi route. Gates are separated in 17 groups of 3-20 gates, depending on their traffic density, location and airline, and unimpeded taxi times are calculated for each gate group. In order to represent the end point of the taxi route of an aircraft, we use the runway assignment information. For runway configurations comprising more than one runway for departures, we calculate two unimpeded taxi times for each gate group: one for each departure runway. In this paper, we focus on the most frequently used runway configuration in 2007 (22R, 27L | 21R, 22L), which has two departure runways (22L, 21R). We estimate
two unimpeded taxi times for each gate group, estimating 34 unimpeded taxi times for this runway configuration under VMC.
For each aircraft in the set (gate group, runway), the taxi-out time is represented as a function of the takeoff queue of the particular runway, where the takeoff queue is defined as the number of aircraft taking off from the same runway while the flight is taxiing. The unimpeded taxi time is the estimated value of this function when the takeoff queue is zero, that is, when there are no other aircraft taking off from the same runway.
Runway Service Process Model
Of central importance for queuing models of the departure process is a model of the runway service process, since the runway is the main bottleneck of the departure process ([2]). In prior work, we demonstrated the use of two runway models for the prediction of taxi-out times ([5], [14]). These models aimed at deriving the statistical characteristics of the runway departure process from operational data, through the observation of runway performance under heavy loading.
In this work, we take a different approach and we use a runway service model based on the aircraft type separation requirements, as listed in Table 1. The main reason for this modeling choice is that the airport of DTW is very rarely heavily congested [16] and this makes it difficult to use the techniques of [5], [14] to infer the runway service process characteristics.
Table 1. Minimum Time Separations (in Seconds) Between Departures on the Same Runway
Leading
Aircraft Heavy Trailing Aircraft B757 Large Small
Heavy 120 120 120 120
B757 90 60 90 90
Large 90 60 60 60
Small 60 60 60 60
Figure 3 shows the 15-minute throughput of runway 21R as a function of the number of taxiing departures assigned to depart from runway 21R (i.e.,
N1(t)). We observe that there is no area of the throughput saturation, which would allow us to observe the capacity of the runway. In contrast, the throughput of runway 22L seems to saturate at around 13 aircraft/15 minutes (Figure 4).
We can use the separation requirements listed in Table 1 the fleet mix of the departures using runways 21R and 22L, and the method outlined in [17]1 to
calculate the capacity of the two runways. This would result in the capacities listed in Table 2, which are consistent with Figure 3 and Figure 4: Runway 22L is calculated to have the same capacity as the one that can be inferred from Figure 3. The calculated capacity of runway 21R (14 AC/ 15 min) stands slightly higher from the red line. It is plausible that is close to the actual capacity of runway 21R, but is not achieved under the current demand levels. Therefore, the separation requirements of Table 1 appear to adequately model the DTW runway service process.
Figure 3. Departure Throughput of Runway 21R (in Takeoffs/15 Min) as a Function of Departure
Demand
Figure 4. Departure Throughput of Runway 22L (in Takeoffs/15 Min) as a Function of Departure
Demand
1 The calculation routine is applied assuming zero buffer time and departure-only scenarios.
Table 2. Expected Capacity from Fleet Mix and Separation Requirements
Runway Capacity (departures/ 15 min)
21 R 14
22 L 13
Taxiway Delay Model
The last component of the airport model depicted in Figure 2 represents ramp and taxiway interactions. For modeling this delay, we follow the same approach as in [5]. The delay incurred because of the aircraft interacting on the ramp and taxiways,
τtaxiway, is proportional to the number of aircraft in the
ramp and taxiway area, R(t).
τ
taxiway =α
⋅R(t)The parameter α is empirically estimated from the available data, validated and tested as described in [5]. Its value is estimated to be 0.265.
Departure Queue-Based Control Protocol
The departure queue-based control protocol is an extension of the idea of N-Control, which was described in [5]. It is based on controlling the demand of every runway, Ni(t), at any time, t, so that it never exceeds the number (denoted Ni*) that is necessary to sustain the capacity of the runway. The pushback times are modified so as to achieve, and not exceed,
Ni* departures on the surface bound for runway i. If the number of aircraft requesting to push back would increase Ni(t) further, those aircraft are held at their gate and form a virtual departure queue, Vi. Therefore, at each time t and for each runway i:
• If Ni(t) ≤ Ni*,
o If the virtual departure queue (set of aircraft that have requested clearance to pushback), Vi, is not empty, clear aircraft in the queue for pushback in FCFS order.
• If Ni(t) > Ni*, for any aircraft that requests pushback,
o If there is another aircraft (arrival) waiting to use the gate, clear departure for pushback, in FCFS order
o Else add the aircraft to the virtual departure queue.
In other words, when Ni(t) > Ni*, we regulate the pushback time of an aircraft unless it may delay an arrival that is waiting to use the gate. In order to maintain fairness, aircraft that request pushback clearance and are not cleared immediately form a FCFS-virtual departure queue. When the congestion eases and Ni(t)≤Ni*, we allow the aircraft in the virtual departure queue to pushback in the order that they requested pushback clearance. This approach enables reductions in fuel burn and emissions, without decreasing departure throughput.
We note that the parameter Ni* may differ for each runway, it depends on the throughput of the runway and the average delay that aircraft incur on their way to the runway i. If, for example, aircraft that are bound for one runway take much longer to reach the runway threshold than the ones using the other runway, the demand (Ni(t)) for the former could
reach high numbers without necessarily implying congestion. On the other hand, if the runway threshold is close to the gates, then a high Ni(t) would
imply a long departure queue. Analogously, there are two virtual departure queues, one for each departure runway. Each of them gets populated with aircraft held at the gate when the demand for the runway they are heading toward exceeds Ni*.
A more integrated approach would be to coordinate the utilization of the runways to maximize the efficiency of the departure runway process. However, runway assignments are a complicated function of the aircraft’s route, airspace restrictions, airline preferences, aircraft type, etc., and are beyond the scope of this paper.
The proposed queue-based control approach reflects a tactical response to the accumulation of departures on the surface, and requires minimal modifications to current procedures. In the next section, we investigate a more complex approach that seeks to regulate the exact trajectory of each aircraft on the surface, by simultaneously considering the trajectories of all other flights.
Taxi Trajectory Optimization
In this section, we describe an Integer Programming formulation to control individual flights on the airport surface and determine the
optimal surface trajectories for them. Details of the formulation can be found in [13].
The airport taxiway system is modeled as a network of links and nodes. In the node-link model, nodes represent significant control points on the airport surface, such as gate locations, runway entry and exit points, intersections of taxiways, and holding spots for clearance. The model also includes links that connect adjacent nodes, representing taxiway segments between two points on the surface. Time is initially discretized into 5 sec intervals [13]. A 5 sec time interval ensures that every intersection in the taxi route is captured without missing any significant events. Using the node-link model, the taxiway operations planning procedure can be formulated as an integer programming formulation.
Consider a set of arrivals, Fa, and a set of departures, Fd. It is assumed that every aircraft f has a preferred taxi route Pf, consisting of a sequence of the segments P(f,i) for a node i on the route. The first segment of a departing aircraft's path begins at its gate; the last segment terminates at the departure runway. That is, for any departing flight f ∈Fd, P(f,
1) and P(f,Nf) represent a gate and a departure runway queue, respectively. In contrast, the taxi route for an arriving aircraft starts at the exit point of the arrival runway and ends at the assigned gate. Each flight also has a set of feasible times to arrive at link j,
] , [ j f j f j f T T T = , for all
j ∈
P
f. Decision VariablesThe binary decision variable wjf,t is used to decide if flight f arrives at link (or node) j by time t. It is defined as
wf ,tj =
1, if flight f arrives at link (or node) j by time t; 0, otherwise.
Objective Function
The objective of taxiway operations optimization is to determine the pushback times of departure flights and to control the taxiway movements of all flights on the surface such that the total delay cost is minimized. A large penalty is imposed on the delay cost either if a departing flight misses its scheduled runway departure time, or if the flight is cancelled for that time period.
Given a set of scheduled pushback times (the earliest times that flights can leave the gate) and
scheduled times of arrival at the departure runway (rf) for departing aircraft, the objective is to find surface trajectories and pushback times for all flights such that the total taxi-out cost is minimized, where cfon is the unit operating cost on the ground when the engines of flight f are running. In addition, a large penalty (P1) is enforced when the aircraft does not
arrive at the runway before its scheduled departure time. In addition, if a departing flight arrives at the assigned runway earlier than the scheduled takeoff time, this can cause congestion in the departure runway queue, increasing congestion at the runway threshold. It is therefore desirable that aircraft arrive at the runway as close as possible to their scheduled times of runway arrival. The cost function for departures can be written as follows:
Q(Departures)= cfqueuemax[rf − t(wf ,tk −wf ,t−1k ), 0 t ∈Tfk,k= P( f ,Nf)
∑
] f ∈Fd∑
+cfon rf− t(wf ,tk −wf ,t−1k ) t ∈Tfk,k= P( f ,2)∑
+P1*max[ t(wf ,tk −wf ,t−1k ) − rf, 0] t ∈Tfk,k= P( f ,Nf)∑
In the function above, cfqueue is the cost per unit time when flight f arrives at the departure runway queue earlier than its scheduled departure time. It is assumed that cfqueue = cfon.
The taxi cost function for arrivals is simpler. The taxi-in time is defined as the time between landing on the runway and reaching the assigned gate. In this model, the cost per unit taxi time for arrivals is assumed to be twice that of departures ( on
f on
fa cd
c =2 ),
reflecting a greater sense of urgency for arrivals. The total cost for arrivals is expressed as
Q(Arrivals) = conf { t(wkf ,t−wf ,t−1k ) − df t ∈Tfk,k= P( f ,Nf)
∑
}f ∈Fa
∑
where df represents the time when arriving flight f exits the runway after landing.
We also consider the case in which a flight is “cancelled” for that time interval, i.e., moved to the next planning horizon. This concept is incorporated in the problem formulation by adopting additional variables xf and adding another term to the objective function, as shown below.
= otherwise. 0, cancelled; is flight if 1, f xf
∑
∈ = a d F F f f x * P tions) Q(Cancella 2where P2 is a penalty when flight f is cancelled. The
magnitude of the penalty is determined by the total cost generated by cancelling the flight for that planning period, and is much higher than the cost of taxi delays.
The overall objective of the IP model is to minimize the total cost for departures, arrivals, and temporarily cancelled flights subject to several operational constraints, as described below [12].
Operational Constraints
First, we have to meet the flight schedules while optimizing the taxiway operations. These include scheduled takeoff times for departures and landing times for arrivals. While the takeoff times of departures are relaxed by applying a penalty in the objective function, arrivals touch down at the scheduled landing times and exit the runway as scheduled. Next, the arrivals should reach the gates within a reasonable taxi-in time range. On the other hand, departing aircraft should leave the gate before the latest allowable time of gate-occupancy, considering the gate utilization of the next flight. Taxiing aircraft are constrained to move forward to the next link along their routes within a reasonable amount of time in order to avoid gridlock situations.
Because of the tactical nature of the operations, the taxiway schedule is typically updated every 15 to 30 minutes using a rolling horizon. Therefore, after
the first time horizon of optimization, each subsequent time horizon needs to consider the flights of which schedules were already optimized in the previous time frame. We assume that the taxi schedules of the flights planned in an earlier iteration (denoted frozen flights) are fixed in the current optimization. To ensure that each aircraft does not conflict with others on the taxiways, the IP constrains the feasible trajectories of aircraft by taking into account the trajectories of the frozen flights, by adding an additional parameter j
t g
y ,, defined as:
yg,tj =
1, if a frozen flight g travels on link j at time t; 0, otherwise.
One of the strategies to restrict overtaking flights (which is infeasible in reality) is to limit the link capacities to a single aircraft. Long links having capacities of greater than one aircraft are divided into several pieces by dummy nodes. However, this change increases the number of nodes and links in the model, thereby increasing the number of variables and constraints. Maximum and minimum taxi speed limits are taken into account in the model in the form of the minimum and maximum travel times on each link. Additional constraints are introduced to prevent head-on collisions at intersection points [13].
Problem Formulation
Incorporating these objective terms and constraints described above, the IP formulation for flight-by-flight taxiway operations optimization can be expressed as follows.
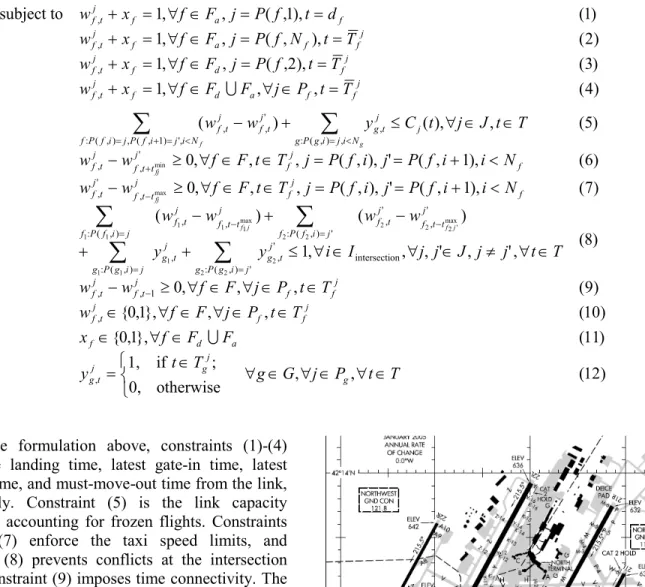
) 12 ( , , otherwise 0, ; if 1, ) 11 ( }, 1 , 0 { ) 10 ( , , }, 1 , 0 { ) 9 ( , , , 0 ) 8 ( ,' , ' , , , 1 ) ( ) ( ) 7 ( ), 1 , ( ' ), , ( , , , 0 ) 6 ( ), 1 , ( ' ), , ( , , , 0 ) 5 ( , ), ( ) ( ) 4 ( , , , 1 ) 3 ( ), 2 , ( , , 1 ) 2 ( ), , ( , , 1 ) 1 ( ), 1 , ( , , 1 subject to tions) Q(Cancella ) Q(Arrivals es) Q(Departur minimize , , 1 , , on intersecti ' ) , ( : ' , ) , ( : , ' ) , ( : ' , ' , ) , ( : , , , ' , ' , , , ) , ( : , ', ) 1 , ( , ) , ( : ' , , , , , , 2 2 2 1 1 1 2 2 max ' 2 2 2 1 1 max 1 1 1 max min ∈ ∀ ∈ ∀ ∈ ∀ ∈ = ∈ ∀ ∈ ∈ ∈ ∀ ∈ ∀ ∈ ∈ ∈ ∀ ∈ ∀ ≥ − ∈ ∀ ≠ ∈ ∀ ∈ ∀ ≤ + + − + − < + = = ∈ ∈ ∀ ≥ − < + = = ∈ ∈ ∀ ≥ − ∈ ∈ ∀ ≤ + − = ∈ ∀ ∈ ∀ = + = = ∈ ∀ = + = = ∈ ∀ = + = = ∈ ∀ = + + + − = = = − = − − + < = < = + =
∑
∑
∑
∑
∑
∑
T t P j G g T t y F F f x T t P j F f w T t P j F f w w T t j j J j j I i y y w w w w N i i f P j i f P j T t F f w w N i i f P j i f P j T t F f w w T t J j t C y w w T t P j F F f x w T t f P j F f x w T t N f P j F f x w d t f P j F f x w g j g j t g a d f j f f j t f j f f j t f j t f j i g P g j t g j i g P g j t g j i f P f j t t f j t f j i f P f j t t f j t f f j f j t t f j t f f j f j t t f j t f j N i j i g P g j t g N i j i f P j i f P f j t f j t f j f f a d f j t f j f d f j t f j f f a f j t f f a f j t f j f j f fj fj g f In the formulation above, constraints (1)-(4) define the landing time, latest gate-in time, latest gate-out time, and must-move-out time from the link, respectively. Constraint (5) is the link capacity constraint, accounting for frozen flights. Constraints (6) and (7) enforce the taxi speed limits, and constraint (8) prevents conflicts at the intersection nodes. Constraint (9) imposes time connectivity. The decision variables for taxiing flights and for cancelled flights are defined in (10) and (11), respectively. The binary parameter yg,tj in (12) is used for to denote
frozen flights.
Simulations
We apply these two different approaches for the taxiway operations to compare and evaluate the benefits of using them to determine gate-holding strategies. For these simulations, actual flight schedule data from DTW were used.
DTW Airport
The Detroit Metropolitan Wayne County Airport (DTW) has 6 runways (3L/21R, 3R/21L, 4L/22R, 4R/22L, 9L/27R, and 9R/27L) and 3 terminals (McNamara, Smith, and Berry), as shown in Figure 5.
Figure 5. DTW Airport Layout
We consider the surface traffic operations under the most frequently used runway configuration, consisting of two departure runways (21R and 22L) and two arrival runways (22R and 27L).
For the comparison of the two approaches, we optimized an entire day’s schedule at DTW (August
1, 2007). On this date, there were 675 departures and 661 arrivals, respectively. Overnight hours between midnight and 5:45AM were excluded because most flights during this period were cargo flights, and traffic demand was low. 656 departures and 638 arrivals between 5:45AM and midnight were considered in the optimization. The average taxi-out time (from BTS) was 18.4 minutes.
Simulation Environment for Trajectory-Based
Optimization
As mentioned above, the integer programming approach requires a node-link model that mimics the actual airport taxiway layout for the optimization. The node-link model (Figure 6) consists of 715 nodes that represent significant control points on the airport surface and 863 links that connect adjacent nodes, in addition to 101 dummy nodes. The model contains 158 gates utilized by 46 airlines, and parking areas for general aviation and cargo flights.
Figure 6. Node-Link Model for DTW
Based on surface surveillance data from DTW, the maximum taxi speed is limited to 7 knots on the ramp area and to 18 knots on taxiways. When crossing an active runway, a flight is constrained to wait for at least one minute for clearance; in addition, if there is a flight arriving or departing on that runway, a taxiing aircraft waits for at least two minutes before crossing the runway. Taxi routes between gates and runways on the surface are also defined based on surface movement observations and NOTAMs at DTW.
A departure flight can stay at its gate for a while, although it is ready to start taxiing. We assume that this gate-holding is allowed to be up to 25 minutes,
taking gate utilization into consideration. It is also assumed that the time needed to complete all the events for preparing taxiing between brake release and actual movement with its own power is 5 minutes, as evidenced by our observations at BOS.
The data set for the simulations includes flight call signs, aircraft types, pushback times, takeoff times, runways, and gates, which are used as inputs in the integer programming based optimization. The pushback times from BTS are used as the earliest pushback times for departing flights. The arrival time at the departure runway is computed using the travel time (τtravel) from the gate to the runway threshold, as derived from the queing model:
τ
travel=τ
unimped+τ
taxiwayFor departure runway operations, appropriate inter-departure times are enforced for safety, depending on the weight classes of the successive departures, while maintaining the come, first-served (FCFS) order of departing flights. The minimum separation requirements to avoid the wake turbulence are given in Table 1. The takeoff times are adjusted from the runway arrival times of the aircraft, considering these separation rules. For arrivals, the landing times from BTS are used to take the interaction with departures on the surface into account.
Simulation Environment for Queue-Based
Control
The simulation environment for the aggregate queuing control is much simpler, but consistent with that of the trajectory-based optimization. The module, implemented in MATLAB, runs in discrete time increments of 10 seconds and processes all flights as described previously. The pushback times from BTS are used as the earliest pushback times for departing flights. The pushback schedule is the same times as the ones used for the trajectory-based optimization.
Simulation of Current Operations
The model of Figure 2 was built and calibrated for the purposes of demonstrating the expected benefits from controlling the runways demand N1(t)
and N2(t). Before we show the results of this queue
management technique, we compare the results of simulating the operations of August 1, 2007 as they took place. The simulation results yield the same
average taxi-out time (18.4 min) as the BTS data. Figure 7 and Figure 8 show the results of making predictions using the pushback schedule from August 1, 2007, along with observed data for the two departure runways. The top subplot shows the observed and predicted number of takeoffs in a 15-minute interval, and the bottom one shows the average taxi-out times of the flights that depart in the corresponding 15-minute interval.
Figure 7. Prediction of Departure Throughput and Average Taxi-Out Times (in Min) for Runway
21R
Figure 8. Prediction of Departure Throughput and Average Taxi-Out Times (in Min) for Runway
22L
We note that the model predictions match the observations reasonably well. We also compute the root mean square error (RMSE), the root mean square percentage error (RMSPE), the mean error (ME), and the mean percentage error (MPE) between the observed measurements and the average of the results (see Table 3).
Table 3. Evaluation of Model Predictions
RMS
Error RMS % Error Mean Error Mean % Error 21R Departures 1.63 0.55 1.09 0.309 22L Departures 1.72 0.65 1.21 0.371 21R Taxi-out times 6.03 0.30 3.58 0.184 22L Taxi-out times 4.58 0.26 3.17 0.178
Implementation of the Aggregate Queue-Based
Control
The model of departure operations developed so far allow us to estimate the potential benefits of the proposed queue-based control. We modify the simulation so as to ensure that N1(t) and N2(t) stay within N1*and N2*, provided there is gate availability. Critical to the results of the simulation is the choice of the design parameters N1*and N2*: If they are too high, they will result in non-significant taxi-out time reductions. If they are too low they will imply significant delays ([5]). Here, N1*and N2* were chosen after simulating the results of different choices and combinations. First, we define:
• Δdj : the additional delay because of gate-holding for flight j. It is calculated as the sum of taxi time and the gate hold time,
ghj, in the controlled case minus the taxi time of flight j at the base case
• Δτj : the taxi time reduction for flight j. It is calculated as the taxi time of flight j in the base case minus the taxi time in the controlled case.
The decision criterion here was formulated as an optimization problem: min (∆dj− ∆τj) j=1 M
∑
s.t ∆dj≤5,∀j ∈ M ghj≤25,∀j ∈ MThe decision variables are N1*and N2*. M is the set of flights. The constraint Δdj ≤ 5 ensures that no flight will get an additional delay of more than 5 minutes because of this control scheme. Analogously
the constraint ghj ≤ 25 ensures that no flight is held at the gate for longer than 25 minutes, in line with the individual trajectory-based optimization. The decision criteria are listed in Table 4.
Table 4. Queue Control Parameters.
Runway Ni*
21 R 15
22 L 17
Using the design parameters listed in Table 4 for
N1*and N2*, we use the surface model to simulate the expected taxi-time reductions, delays and gate holding times resulting from the queue control protocol.
Results
In the simulation results, the taxi-out time of a flight is defined as the difference between the controlled pushback time at the gate and the actual wheels-off time on the departure runway. The gate-holding time is defined as the controlled pushback time obtained by the control method minus the earliest (scheduled) pushback time. The time interval used for the simulations was August 1 2007, 5:45AM to midnight. We first report the results of the aircraft trajectory-based optimization. Then, we report the results of aggregate queue-based control and subsequently, we compare the results of the two methods.
Trajectory-Based Optimization
The proposed integer programming method computes the optimal pushback times and the required time of arrivals (RTAs) at significant control points on the taxiways to minimize the taxi-out times of the aircraft and meet the scheduled takeoff times. This optimization model also determines the gate arrival times for arriving aircraft to minimize the taxi-in times of arrivals, although they are not compared with the aggregate queue approach, which does not co-optimize taxiing-in flights.
Benefit of Gate Holding Strategy
The simulation results show an average gate-holding time of 4.1 min and an average taxi-out time of 14.3 min. This result can be compared with the current operations, where aircraft push back when ready: The average observed taxi-out time was 18.4 min. By deploying trajectory-based optimization the taxi-out time can be reduced by 23% on average.
Figure 9 shows the average taxi-out times (on the left y-axis) and the corresponding number of flights on the surface (on the right y-axis) during 15 min time intervals for the cases of the current operations (light color bar) and the trajectory-based optimization simulation (dark color bar). In the graph, we observe that the amount of taxi time savings is large when the traffic density is high as in a peak period such as 1:30PM~2:15PM, 3:14PM~3:45PM, 7PM~7:45PM, and 9PM~10PM. The gate holding strategy is more effective under congestion, as expected.
Aggregate Queue-Based Control
The simulation results of the queue-based control show a much smaller gate-holding time and a much smaller reduction in taxi-out time. In summary, the average taxi-out time gets reduced by 0.1 minute. The average gate-hold time is 0.15 minutes. The average additional delay because of this gate holding scheme is 0.04 minutes.
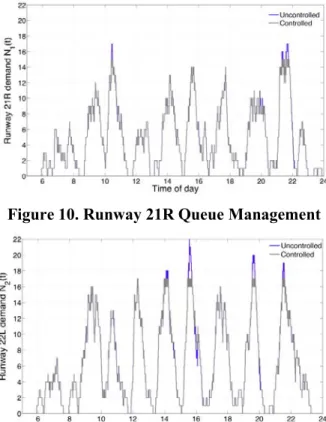
We observe the operational impact of the control strategy in Figures 10 and 11, which show the demand of the two runways, N1(t) and N2(t), in the baseline and the controlled case, as simulated. We note that for the time periods in which N1(t) and N2(t) take values lower than the specified thresholds in Table 4, the base case and the controlled case are identical. One such time period is 6 AM until 10 AM. Queue-based control is not applied, and the pilots are free to push back and taxi as usually.
Benefit of Gate Holding Strategy
When congestion on the ground builds up, demand for the two runways builds up and eventually exceeds the specified threshold Ni*. The times periods when this happens are 10 to 10.30 am, 2 to 2.15 pm, 3.30 to 3.45 pm, 7.30 to 8pm and 9.15 pm to 9.45 pm, as can be seen in Figures 10 and 11.
Figure 10. Runway 21R Queue Management
Figure 11. Runway 22L Queue Management
They are essentially all the high demand periods. During these time periods, the total number of flights that get held at their gates is 37. For these flights, the average gate hold time is 2.6 minutes. The additional delay for these flights is 1.5 minutes.
Flights incur additional delay for two reasons: • As taxi speeds and routes are not
controlled, their time of arrival at the runway is not specified. Thus, they may arrive at the runway after the runway server becomes available.
• The aircraft that get held at their gate may get overtaken by other aircraft. In this way, they get behind in the departure queue.
Comparison of the Two Approaches
The aggregate queue based approach attempts to avoid congestion and thus the long taxi times that excessive queuing would cause. On the other hand, the taxi trajectory optimization attempts to optimize all flights with the objective of achieving free flow of aircraft on the ground (unimpeded taxi times). The two methods are fundamentally very different: They have different objectives, which lead to different results. That was part of the reason that we built two different models in order to evaluate them.
Consistency of the Models
For a meaningful results comparison, we need the two models to be consistent in their assumptions. This consistency is ensured in the following ways:
• The runway server component is identical in the two models.
• The unimpeded taxi time results are consistent with the derived speeds of aircraft in the ramp and the taxiways. This ensures that in both models, the free flow speed is the same.
• For both control strategies, the maximum gate holding time is fixed at 25 minutes. • The expected runway arrival time used in
the trajectory-based optimization was derived using the travel time from gate to runway of the queuing model. This, in combination with the identical separation requirements, ensures that both models aim at adhering to the same runway schedule.
• For both simulations, we consider the 656 departures between 5:45 AM and midnight of August 1, 2007. The earliest pushback
times of the flights are the actual pushback times of this day.
• Finally, arriving traffic on the ground is regarded as a fixed source of delay in the aggregate queue based control model. In contrast, the taxi time of arriving traffic is an explicit objective in the integer optimization model.
One important difference between the assumptions of two control methods is that the trajectory-based optimization assumes knowledge of the pushback schedule in every fifteen-minute interval, and also assumes the ability to control RTAs at every node on the airport surface. This means that the aircraft must give exact “ready-to-push” times at the beginning of the fifteen-minute interval that they plan to pushback. This renders this method much more proactive, as the optimizer can optimize all the flights of the fifteen minute interval together. On the other hand, the queue based control method does not make any assumption about the “ready-to-push” time of a departure.
Overall Results
With the aircraft trajectory based approach, 585 flights, or 89% of all departures, are held back at the gates. The IP model tends to get the maximum benefit of the gate-holding strategy, since it can control the trajectory of each flight in detail (see Table 5). The average gate holding time of flights that experience gate holding is 4.9 min, whereas the average gate holding time is 4.1 min. For the aggregate queue-based control, the total number of flights that get held at the gate is only 37. For these flights, the gate average holding time is only 2.6 minutes on average. The longest gate-holding time is 8.2 minutes.
Table 5. Comparison of the Simulation Results
Aircraft Trajectory Optimization Queue Based Control Avg. gate-holding time (min) 4.1 0.2
Avg. taxi-out time (min) 14.3 18.3 Avg. taxi-in time (min) 10.5 - Avg. additional delay (min) 0 0.04 Number of flights held at the gate 585 37
Avg. gate-holding time of flights
held (min) 4.9 2.6
The discrepancy between the results of the two strategies stems from their different objectives: The taxi trajectory optimization brings taxi times down to the unimpeded ones by coordinating all the traffic simultaneously, and by controlling RTAs at all nodes, whereas the queue control simply reduces taxi times by stopping the build-up of excessive queues. DTW is though a relatively uncongested airport, the demand for the runways rarely saturate, as it can be seen in Figure 3 and Figure 4, and therefore queue-based control has very little impact [18]. Interestingly, if all departures taxied with their unimpeded taxi times in the queue control model (τ=τunimped), the average taxi out time would be 14.3 minutes. This would be the lower bound of the average taxi-out time of this control strategy. It is worth noting (but not unexpected) that the taxi trajectory optimization achieves the lower bound of the queue based control: The airport is relatively uncongested, so all taxiway conflicts are resolved without aircraft incurring delays.
Congested Periods
Since the aggregate queue based control strategy is effective only during the congested periods, we also compare the taxi-out times and gate hold times from the two approaches during these periods. We focus on two time periods: 3:15~3:29 PM and 9:15~9:29 PM, the two most congested periods of the simulation date. During these 15 min periods, the number of flights that are scheduled to push back was 24 and 25 flights respectively.
During both time intervals, the aircraft trajectory based optimization holds the departures back at the gate, and releases them one by one so as to avoid unnecessary delays. In contrast, for the aggregate queue-based approach, the control protocol is reactive rather than proactive. Most of the flights requesting push back at these intervals are released at their requested pushback time. This results in congestion building up on the ground; N1(t) and N2(t) exceeding the control thresholds N1* and N2*; and flights getting held at their gate during the following time periods, 3:30~3:44 PM and 9:30~9:44PM.
During the 3:15~3:29 PM period, with aircraft trajectory-based optimization, all the flights except for one flight getting rerouted to a long taxi route are held at their gates between 100 seconds and 10 minutes. The average gate-holding time for these flights is 5.7 min, and this is equal to the average taxi
time reduction for them. With queue-based control, none of the flights get held back during the 3:15~3:29 PM period and all push back at their requested time. However, 9 flights get held at their gate during the 3:30~3:44PM for 3.9 minutes in average.
During the 9:15~9:29PM period, with aircraft trajectory-based optimization, all flights are held at their gates. The gate holding times range from 30 seconds to 11 minutes. The average taxi-out time reduction for these flights is 6.3 min, which equals the average gate-holding time. This reduction is 2 min larger than the average taxi time reduction of the whole time interval. With queue based control, only 4 flights get held back during the 9:15PM~9:29PM period for 1.3 minutes in average. However, 9 flights get held at their gate during the 9:30PM~9:44PM for 2.6 minutes in average.
Optimization without Taxi Conformance
We also consider an operational environment in which the pushback schedule is designed assuming the ability to control surface trajectories, but where the aircraft do not have the equipment and the requirement to meet RTAs at nodes on the surface. One could argue that there may be still some benefit from such a scenario, since the optimization may present better a better schedule, even if the pilots do not fully adhere to its implementation.
In order to explore this scenario, we use the taxiway-based optimized pushback schedule as the input to the queuing model. The results of the simulation show that the suggested gate-holds (on average 4.1 min) would achieve an average taxi-out time reduction of only 0.4 min, but at the cost of an average additional delay of 4.17 min. Similar delays would result from very aggressive queue control: Choosing N1*and N2* at 8 and 10 respectively, would result in average additional delay of 4.17 min. However, the average gate-holding time (for such aggressive queue control) would be 4.97 min, and the average taxi-out time reduction 0.85 min.
As already mentioned, taxiway-based optimization achieves free flow taxi times. This corresponds to having very few aircraft on the ground, which are being routed to the runway at speeds necessary to meet the runway schedule. The rest can wait at their gates. However, if the aircraft do not have to conform to the given taxi speeds, they will end arriving at the runways at non-scheduled times and the runway will occasionally get starved.
The runways will be under-utilized and the aircraft will end up getting delayed. On the other hand, implementing aggregate queue based control with appropriately chosen N1*and N2* values will maintain pressure on the runways.
Conclusions
Aggregate queue-based control is a simple strategy that can be implemented with minor modifications of the current operational procedures and very little automation equipment. It has been shown that it can achieve significant emissions reductions in congested airports. However, the example of DTW shows that modest taxi times cannot be reduced with such aggregate reactive tools.
On the other hand, trajectory-based optimization requires significant computing infrastructure and automation, and careful model preparation and data processing, to successfully design, implement and optimize a network model of an airport. More significantly, it requires significant modifications of current procedures: in a potential implementation, ATC would require exact “ready-to-push” times from pilots at the beginning of each 15-minute interval. In addition, pilots would be required to adhere to taxi speeds and given arrival times at different control points (taxi conformance), otherwise trajectory-based optimization (without the required actuation) could have adverse effects. The results from this work show that for an uncongested airport the aircraft trajectory-based optimization can achieve free flow of aircraft, thereby minimizing taxi-out times.
The next steps for this research would include a comparison of the two methods at a more congested airport, and the modification of the queue-based control so as to account for near-future demand when making decisions. This would allow us to compare such hybrid control strategies and generalize our results to other airports.
References
[1] Feron, Eric, R. John Hansman, Amedeo R. Odoni, Ruben B. Cots, Bertrand Delcaire, Xiaodan Feng, William D. Hall, Husni R. Idris, Alp Muharremoglu, and Nicolas Pujet, December 1997, The Departure Planner: A conceptual discussion, Technical report, Cambridge, MA, Massachusetts Institute of Technology.
[2] Idris, Husni R., Bertrand Delcaire, Ioannis Anagnostakis, William D. Hall, Nicolas Pujet, Eric Feron, R. John Hansman, John-Paul Clarke, and Amedeo R. Odoni, August 1998, Identification of flow constraint and control points in departure operations at airport systems, AIAA Guidance, Navigation, and Control Conference and Exhibit. [3] Idris, Husni R., John-Paul Clarke, Rani Bhuva, and Laura Kang, September 2001, Queuing Model for Taxi-Out Time Estimation, ATC Quarterly. [4] Pujet, Nicolas, Bertrand Delcaire, and Eric Feron, 1999, Input-output modeling and control of the departure process of congested airports, Portland, OR, AIAA Guidance, Navigation, and Control Conference and Exhibit, pp. 1835-1852.
[5] Simaiakis, Ioannis, Hamsa Balakrishnan, August 2009, Queuing Models of Airport Departure Processes for Emissions Reduction, AIAA Guidance, Navigation, and Control Conference.
[6] Cheng, Victor H. L., August 2003, Airport Surface Operation Collaborative Automation Concept, Austin, TX, Proceedings of the AIAA Guidance, Navigation, and Control.
[7] Trani, Antonio A., Hojong Baik, Julio Martinez, and Vineet Kamat, November 2000, A New Paradigm to Model Aircraft Operations at Airports: The Virginia Tech Airport SIMulation Model (VTASIM), FAA Headquarters Auditorium, NEXTOR Fourth Annual Research Symposium. [8] Visser, H. G., P. C. Roling, 2003, Optimal Airport Surface Traffic Planning Using Mixed Integer Linear Programming, AIAA Aviation Technology, Integration and Operations (ATIO) Conference.
[9] Smeltink, J. W., M. J. Soomer, P. R. de Waal, and R. D. van der Mei, January 2005, An Optimisation Model for Airport Taxi Scheduling, Lunteren, The Netherlands, Thirtieth Conference on the Mathematics of Operations Research.
[10] Rathinam, Sivakumar, Justin Montoya, and Yoon C. Jung, September 16, 2008, An Optimization Model for Reducing Aircraft Taxi Times at the Dallas
Fort Worth International Airport, Anchorage, AK, 26th International Congress of the Aeronautical Sciences.
[11] Gupta, Gautam, Waqar Malik, and Yoon C. Jung, September 2009, A Mixed Integer Linear Program for Airport Departure Scheduling, Hilton Head, SC, AIAA Aviation Technology, Integration, and Operations (ATIO) Conference.
[12] Balakrishnan, Hamsa, Yoon C. Jung, August 2007, A Framework for Coordinated Surface Operations Planning at Dallas-Fort Worth International Airport, AIAA Guidance, Navigation, and Control Conference.
[13] Lee, Hanbong, Hamsa Balakrishnan, September 2010, Optimization of Airport Taxiway Operations at Detroit Metropolitan Airport (DTW), AIAA Aviation Technology, Integration and Operations (ATIO) Conference.
[14] Office of Aviation Policy and Plans, May 2002, Documentation for the Aviation System Performance Metrics (ASPM), Federal Aviation Administration. [15] Simaiakis, Ioannis, Nikolas Pyrgiotis, September 2010, An Analytical Queuing Model of Airport Departure Processes for Taxi Out Time Prediction, AIAA Aviation Technology, Integration and Operations (ATIO) Conference.
[16] Federal Aviation Administration, 2004, Airport capacity benchmark report, US Department of Transportation.
[17] de Neufville, Richard, Amedeo Odoni, 2003, Airport Systems: Planning, Design and Management, McGraw-Hill.
[18] Simaiakis, Ioannis, Hamsa Balakrishnan, 2010, Impact of Congestion on Taxi times, Fuel Burn and Emissions at Major Airports, Transportation Research Record.