HAL Id: hal-02945610
https://hal-amu.archives-ouvertes.fr/hal-02945610
Submitted on 22 Sep 2020
HAL is a multi-disciplinary open access
archive for the deposit and dissemination of
sci-entific research documents, whether they are
pub-lished or not. The documents may come from
teaching and research institutions in France or
abroad, or from public or private research centers.
L’archive ouverte pluridisciplinaire HAL, est
destinée au dépôt et à la diffusion de documents
scientifiques de niveau recherche, publiés ou non,
émanant des établissements d’enseignement et de
recherche français ou étrangers, des laboratoires
publics ou privés.
Distributed under a Creative Commons Attribution| 4.0 International License
signature defines human core DNA replication origins
Ildem Akerman, Bahar Kasaai, Alina Bazarova, Pau Sang, Isabelle Peiffer,
Marie Artufel, Romain Derelle, Gabrielle Smith, Marta Rodriguez-Martinez,
Manuela Romano, et al.
To cite this version:
Ildem Akerman, Bahar Kasaai, Alina Bazarova, Pau Sang, Isabelle Peiffer, et al.. A predictable
conserved DNA base composition signature defines human core DNA replication origins. Nature
Communications, Nature Publishing Group, 2020, �10.1038/s41467-020-18527-0�. �hal-02945610�
A predictable conserved DNA base composition
signature de
fines human core DNA replication
origins
Ildem Akerman
1,2,10,11
✉
, Bahar Kasaai
1,10
, Alina Bazarova
3,4,10
, Pau Biak Sang
1
, Isabelle Peiffer
1
,
Marie Artufel
5
, Romain Derelle
6
, Gabrielle Smith
2
, Marta Rodriguez-Martinez
1
, Manuela Romano
7
,
Sandrina Kinet
7
, Peter Tino
3
, Charles Theillet
8
, Naomi Taylor
7,9
, Benoit Ballester
5
&
Marcel Méchali
1,11
✉
DNA replication initiates from multiple genomic locations called replication origins. In
metazoa, DNA sequence elements involved in origin speci
fication remain elusive. Here, we
examine pluripotent, primary, differentiating, and immortalized human cells, and demonstrate
that a class of origins, termed core origins, is shared by different cell types and host ~80% of
all DNA replication initiation events in any cell population. We detect a shared G-rich DNA
sequence signature that coincides with most core origins in both human and mouse
gen-omes. Transcription and G-rich elements can independently associate with replication origin
activity. Computational algorithms show that core origins can be predicted, based solely on
DNA sequence patterns but not on consensus motifs. Our results demonstrate that, despite
an attributed stochasticity, core origins are chosen from a limited pool of genomic regions.
Immortalization through oncogenic gene expression, but not normal cellular differentiation,
results in increased stochastic
firing from heterochromatin and decreased origin density at
TAD borders.
https://doi.org/10.1038/s41467-020-18527-0
OPEN
1Institute of Human Genetics, CNRS - University of Montpellier, Montpellier, France.2Institute of Metabolism and Systems Research (IMSR), University of
Birmingham, Birmingham, UK.3Centre for Computational Biology (CCB), University of Birmingham, Birmingham, UK.4Institute for Biological Physics, University of Cologne, Cologne, Germany.5Aix-Marseille University, INSERM, TAGC, UMR S1090, Marseille, France.6Life and Environmental Sciences (LES), University of Birmingham, Birmingham, UK.7Institut de Génétique Moléculaire de Montpellier (IGMM), University of Montpellier, CNRS,
Montpellier, France.8Institut de Recherche en Cancérologie de Montpellier (IRCM), Montpellier, France.9Pediatric Oncology Branch, NCI, CCR, NIH,
Bethesda, MD, USA.10These authors contributed equally: Ildem Akerman, Bahar Kasaai, Alina Bazarova.11These authors jointly supervised this work: Ildem
Akerman, Marcel Méchali. Jointfirst authorship: Ildem Akerman, Bahar Kasaai, Alina Bazarova. ✉email:[email protected];[email protected]
123456789
D
uring each cell division, a human cell will replicate ~2 m
of DNA within the S-phase time constraints. To achieve
this, DNA replication initiates from thousands of regions
that are called DNA replication origins and are spread across the
genome. The positioning of DNA replication initiation sites (IS)
in the genome (origin specification) is poorly understood in
metazoans. In prokaryotes and viruses, usually a single,
sequence-specific origin exists, while in the eukaryote Saccharomyces
cere-visiae, DNA replication initiates from AT-rich consensus
sequences that are bound by the yeast origin recognition complex
(ORC)
1. By contrast, in fruit
fly and mouse cells, the presence of a
G-rich DNA sequence element, (Origin G-rich Repeated Element,
OGRE), 300 bp upstream of the IS has been reported in more
than 60% of origins
2–7. CA/GT-rich motifs
2and poly-A/T tracks
8have also been detected at IS in mouse cells. OGRE elements may
contain CpG islands (CpGi)
4,9–12and potential G-quadruplex
(G4) elements
3,13,14, in a nucleosome-free region
2. However, only
a fraction of all putative G4 elements in the genome host a nearby
origin, and CpGi are present only in a fraction of origins. This
indicates that other features contribute to replication origin
selection or activation. Here, we identify origins in human cells
using a Short Nascent Strand isolation protocol
4,10,13,15–17cou-pled with next-generation sequencing (SNS-seq) that minimises
the false-positive rates (FPR; see Methods section). This allows
characterisation of human DNA replication origins in human
stem cells and during normal cellular differentiation, as well as
after immortalisation upon oncogene mis-expression. This lets us
define a subset of origins, which we call core origins, from which
80% of replication initiation takes place in all the tested human
cell types. We also show that origin activity can be modulated by
the transcriptional landscape. Although, we do not detect strict
consensus sequences, we were able to predict the position of most
core origins in the human and mouse genomes using
computa-tional algorithms based only on the DNA sequence. Cell
immortalisation results in an increased stochasticity of origin
positioning, especially in heterochromatin regions, as well as an
alteration of their distribution along TAD domains.
Results
The landscape of DNA replication origins in the human
gen-ome. Using an optimised SNS-seq protocol (see Methods section
and Supplementary Fig. 1a), we identified DNA replication IS
from 19 human cell samples, representing three untransformed
(human embryonic stem cells, hESC; cord blood CD34(+)
hematopoietic cells, HC; primary human mammary epithelial
cells, HMEC) and three immortalised cell types derived from the
HMEC line (ImM-1, ImM-2, and ImM-3; Fig.
1
a). Owing to the
high number of cell samples investigated, a total of 320,748 IS
were identified, the overwhelming majority of which were
low-activity IS belonging to immortalised cell types (Supplementary
Data 1a, b, see following section). The IS repertoire included the
previously identified human LaminB2
18, MYC
19, MCM4
20and
HSP70
21origins (Fig.
1
b and Supplementary Data 1c). As the raw
data clearly exhibited variations in replication origin activity, we
classified origins in 10 quantiles, based on their average activity
(i.e., mean normalised SNS-seq signal): from quantile 1 (Q1) that
contained the top 10% (highest average activity) to quantile
10 (Q10) that included the bottom 10% (lowest average activity)
of origins (Fig.
1
c, Supplementary Fig. 1b). Origins in each
quantile displayed similar mappability, which is a measure of the
ability of SNS-seq reads to be matched to the human genome.
Therefore, the variation in SNS-seq signal at origins belonging to
different quantiles were not due to the technical differences in our
ability to map them (Supplementary Fig. 1c).
Strikingly, our classification revealed that 70–85% of the origin
SNS-seq signal originated from Q1 and Q2 origins in all cell types
analysed (Fig.
1
d and Supplementary Data 1b). In addition,
we observe that almost all the enrichment of the SNS-seq
signal across the genome comes from regions that are defined as
origins in our study, suggesting that broad and diffuse initiation
outside origin regions is not substantial (Supplementary Fig. 1d,
see Methods section). As the SNS-seq signal represents the
amount of DNA replication initiation events that take place in
a cell population, we concluded that Q1 and Q2 origins host
the majority of the initiation events, highlighting these 64,148
regions, termed
“core origins”, as replication initiation hotspots,
irrespective of the cell type.
The remaining 80% of IS (Q3–Q10, 256,600 regions), hereby
termed
“stochastic origins”, had low mean activity across
19 samples and only hosted ~15–30% of total SNS-seq signal in
each cell type (Fig.
1
d and Supplementary Data 1b).
Most core origins were clustered together, because the distance
to the nearest origin was shorter for core origins compared with
stochastic origins or random distribution (Fig.
1
e and
Supple-mentary Fig. 1b, e). This is consistent with a previously observed
community effect whereby clustered origins have higher activity
than isolated origins
4,10,22(Supplementary Fig. 1e). Remarkably,
a similar number of core origins in Mus musculus host 69% of all
initiation events detectable by SNS-seq, suggesting that the core
origins are a feature not specific to the human genome
(Supple-mentary Fig. 1f).
The position of core origins is consistent. Origin activity was
highly correlated in the different cell types (Fig.
2
a, average
Pearson’s r = 0.69, P-value <2E-16 for all comparisons),
sug-gesting that a given origin has similar levels of initiation in
dif-ferent cell types. About 77% of origins shared by the difdif-ferent cell
types were core origins (Supplementary Data 1b). Conversely,
stochastic origins were less shared (Fig.
2
b and Supplementary
Fig. 2a). In support of our
findings that core origins are more
ubiquitously active in different cell types, 72% of core origins
were identified by an independent SNS-seq study
12using
differ-ent cell types (Fig.
2
c and Supplementary Fig. 2b). Moreover, 49%
of regions identified by a different origin mapping method
(INI-seq
7) in a different cell line overlapped our origins, majority of
which were core origins (Fig.
2
d). Early
firing core origins were
more likely to be identified by INI-seq, which maps early firing
origins (Supplementary Fig. 2c). In addition, almost all (87%)
regions identified by OK-seq
23, overlapped origins identified in
this study (Fig.
2
e). However, as this method only maps
5000–10,000 bp regions, with an average size of 34 kb; this
over-lap was not statistically significant. Nevertheless, core origins and
core origins found in tight clusters (see Methods), which resemble
initiation zones similar in size to those identified by OK-seq,
overlapped significantly with regions identified by OK-seq
(49.7%, Supplementary Fig. 2d, e).
Core origins also coincided with regions previously shown to
be bound by the pre-replication complex (pre-RC) components
ORC1
24, ORC2
25and MCM7
26. Specifically, 28% and 39% of
core origins overlapped with ORC2 or MCM7-bound regions
(Fig.
2
f and Supplementary Fig. 2f). Clustered core origins
(initiation zones) overlapped with pre-RC component-bound
regions more often (40% with ORC2 and 60% with MCM7,
Fig.
2
g). Given that only about half of all core origins is active in
any one cell type, the amount of overlap is suggestive that most
active core origins are associated with pre-RC components ORC2
and MCM7. Reciprocally, 57% of ORC1- and 55% of
ORC2-bound regions overlapped at least with one origin identified by
SNS-seq (Fig.
2
h). Broader ORC1- or ORC2-bound regions,
which might represent regions with multiple ORC1/2 binding
events as suggested in S. pombe
27, were more likely to host an
origin, and mostly a core origin (Supplementary Fig. 2g, h).
In summary, our analysis identified core origins that represent
bona
fide IS in different cell types, which are also identified by
alternative origin mapping methods. On average, core origins
represent ~40% of all origins identified in a single cell type,
representing on average ~30,000 regions (Fig.
2
i). It is worth
noting that core origins are different from
“constitutive/common
origins” previously observed with SNS-seq data
12,13. Our analysis
has the highest number of samples amongst these studies and
based on our data, we infrequently observe origins that are active
in every sample (Supplementary Data 1d).
Human and mouse genomes share a G-rich sequence signature.
We next investigated whether DNA replication initiation sites are
placed in homologous regions across mouse and human genomes.
We
find that only a small fraction (8%) of human origins have
homologous regions in the mouse genome and only 2% are also
identified as origins in mouse cells (Fig.
2
k, left panel). We
find a
comparable level of homology for randomised genomic regions
(7% conserved, 0.8% overlapping mouse origins, Fig.
2
k, right
panel) suggesting that the majority of DNA replication initiation
sites are not located in homologous regions in the mouse and
human genomes. In accordance, we observed a low level of
sequence conservation of the origin DNA sequence compared to
promoters and exonic regions across 20 mammalian species,
reinforcing the idea that these sequences have appeared
inde-pendently in the different lineages during evolution (Fig.
2
l).
Interestingly, Phastcon20way scores of regions
flanking the
ori-gins (±5 Kb of origin summits), display moderately conserved
regions 0.5–3 Kb upstream of the IS region for core origins, which
are mostly attributable to regulatory elements/exonic sequences
(Supplementary Fig. 2i, j).
Despite lacking sequence homology, functional regions of the
genome may contain sequence elements that are shared between
species. Thus, we next examined sequence elements that might be
shared across replication origins of different species. To identify
DNA sequence elements that coincide with origins, we examined
the relationship between the IS and G-rich putative G4 structures,
which are helical DNA configurations that contain one or more
guanine tetrads. 83% of core and 34% of stochastic origins
5 kb
MYC
a
b
c
d
e
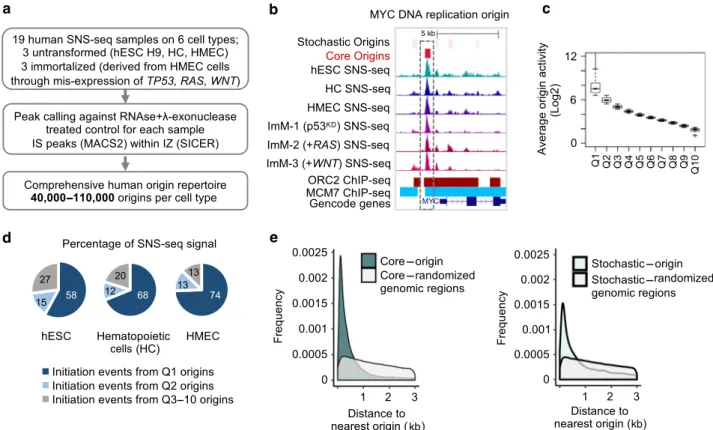
Fig. 1 Human origin repertoire. a Experimental workflow. SNS-seq was performed on three untransformed (hESC H9, patient derived hematopoietic cells (HC), and patient derived Human Mammary Epithelial Cells (HMEC), and three immortalised cell types (totaln = 19). Immortalised cells were obtained through a reduction ofTP53 mRNA levels (ImM-1, p53KD) or further expression of oncogenesRAS (ImM-2, +RAS) or WNT (ImM-3, +WNT) in HMEC
cells.b UCSC genome browser snapshot of the human replication origin (MYC origin) captured by SNS-seq. Representative SNS-seq read-profiles, published positions of ORC2- (red) and MCM7-bound (blue) regions and the GENCODE genes (v25) are shown. The positions of origins defined in this study are shown on top; red: high-activity origins (core origins), light pink: low-activity origins (stochastic origins).c Boxplot showing the average origin activity (normalised SNS-seq counts across all samples, in Log2) per each quantile (x-axis represents Q1-Q10 origins). Line within the boxplot represents median, whereas the bounds of the box define the first and third quartiles. Bottom and top of whiskers represent minimum and maximum numbers respectively for each boxplot.d Q1 and Q2 origins host the overwhelming majority of initiation events in untransformed cell types. Pie chart representing the percentage of DNA replication initiation events (normalised SNS-seq counts) that originate from Q1, Q2 or Q3-10 origins in the indicated untransformed cell types.e Density plots showing the distribution of the distances to nearest origin (x-axis, in Kb) for core origins (left panel) and stochastic origins (right panel). In grey are control density plots that show the distribution of the distances between core/stochastic origins to the nearest randomised genomic region of the same size and number as origins. Both frequency plots were significantly different from randomised distributions (p ≤ 2.2E-16, Chi-square Goodness-of-Fit test in R with observed and expected values for frequency).
contained at least one putative G4 element defined by two
different methods
28,29(Fig.
3
a and Supplementary Fig. 3a). A
large number of putative G4 elements has been predicted in
human and mouse genomes, but as previously noted, only a
fraction of them hosts an origin
2–4,12. Hence, the presence of a
putative G4 element is not, on its own, a strong predictor of
origin placement, but most core origins indeed contain a G4
element.
Similar to previous
findings in mouse
2, a number of G-rich
motifs upstream of the IS were evident (Supplementary 3b) and
p=1E–307 p=1E–307 p=1E–307 p=1E–307 p=1E–307 p<1E–105 Human Origins Control regions Refseq exons Refseq promoters Refseq introns p=1E–307
k
l
j
i
f
g
h
e
d
c
a
b
were enriched in origin sequences even after C/G and CpG
content normalisation of the control regions (Supplementary 3c).
Analysis of the base composition of human origins within ±1.5
Kb of the oriented IS summit confirmed that core origins were
enriched in G-rich sequences with an asymmetrical enrichment
up to 1.5 Kb upstream of the IS centre (Fig.
3
b).
We further asked how the replication origins determined in
this study position relative to the placement of pre-RC factors on
the genome. When we aligned the positions of the pre-RC
components ORC1
24, ORC2
25and MCM7
26relative to the IS, we
found that they were preferentially positioned upstream of the IS,
near the G-rich region in both core and stochastic origins (Fig.
3
c,
d). In addition, the distances between the IS and these pre-RC
factors recapitulated independent biochemical methods
measur-ing positionmeasur-ing of pre-RC factor bindmeasur-ing sites
30–32, such that the
median distances between core IS (peak summit) and ORC1,
ORC2 and MCM7 binding sites (peak centre) were 512, 446 and
302 bp, respectively. This positioned the peak of MCM complex
downstream of the ORC subunits, at 300 bp from the IS (Fig.
3
e).
Indeed, the MCM complex sits on at least 68 bp and binds to a
neighbouring nucleosome, increasing the size of the protected
DNA up to 210 bp
33. In addition, the MCM helicase must
unwind the DNA over a minimum length in order to allow the
DNA polymerase to bind to the unwound DNA. We believe that
this result, linking the IS determined by SNS-seq and pre-RC
binding sites determined by ChIP-seq, is a clear independent
demonstration that the SNS-seq method accurately maps the
initiation sites of DNA replication. Furthermore, our results show
that the relative in vivo positioning of Pre-RC components and IS
are similar to those determined by biochemical methods
30.
Origin positioning can be predicted based on DNA sequence.
As strong origins display a G-rich profile (a putative sequence
signature), we asked whether DNA replication origins could be
predicted from the DNA sequence alone. Classical motif search
algorithms are designed to detect enrichment of short, but highly
similar stretches of DNA, typically bound by transcription
fac-tors. Given the core origin size (average 716 bp), we hypothesised
that they may be specified by hyper-motifs
34, which are
dis-criminatory DNA sequence patterns that are typically longer than
classical transcription factor binding sites. To do this, we
mod-elled the asymmetrical base composition of the core origin and its
flanking sequences and scanned the human genome for similar
DNA sequence patterns (Supplementary Fig. 3d, see Methods
section). The genome scanning (GS) algorithm identified 228,442
non-overlapping regions which located 83% of core origins and
33% of stochastic origins with FPR of 66% (Fig.
3
f). The
pre-dictive ability of the GS algorithm decreased in parallel with the
mean origin activity, suggesting that origins with higher activity
(core) are more likely to contain discernible G-rich sequence
elements (Fig.
3
g). Our GS algorithm also predicted 76% of core
and 54% of all origins in the mouse genome (Fig.
3
h), which
display a similar G-rich sequence signature at core origins
(Supplementary Fig. 3e). Asymmetrical base composition at
ori-gin sequences has previously been observed
2–4,12. Interestingly
however, only the modelling of core origins, but not of stochastic
or previously published origins
2,12led to high predictive power
with the GS algorithm (see Methods section). In conclusion,
despite lack of evolutionary sequence conservation of DNA
replication origins in these two mammalian species (Fig.
2
k, l),
our data suggests that most human and mouse core DNA
repli-cation origin positions can be predicted using DNA sequence
alone based on the same G-rich DNA hyper-motif, suggesting
that a conserved mechanism(s) governs origin selection in these
vertebrate species.
To improve the predictive power and reduce FPR, we modelled
the DNA sequences around the predicted regions and used two
different machine-learning (ML) algorithms (see Methods section)
to better differentiate true origins in our predictions. Modelling of
the DNA sequences included using information, such as the
density of di-, tri- and multi-nucleotides (CC, CG, GG, CGCG,
etc.), inter-prediction distances, and the base composition
varia-tions (A, T, G, and C) of the DNA across a 4-kb region (see
Methods). Remarkably, GS algorithm coupled with a ML algorithm
(logistic regression with greedy feature selection, LR) identified
67,297 non-overlapping regions and predicted 67% of core origins
with a total FPR 27.8% (Fig.
3
i and Supplementary Fig. 3f). In other
words, a large proportion (67%) of core origins contain discernible
DNA sequence patterns, and when these patterns are present in the
genome, they are associated with an origin 72.2% of the time, in at
least one cell type. Importantly, when we employed a completely
independent ML approach (SVM), this resulted in vastly
over-lapping predictions (Fig.
3
i and Supplementary Fig. 3g) with an
FPR of 23.4% (Supplementary Fig. 3f). Coupling of GS and ML
algorithms thus allowed the prediction of origin positions in a
genome as large as the human genome.
Both SVM and LR approaches identified the upstream G density
as critical parameters for predictions (Fig.
3
j and Supplementary
Fig. 3h). This is in accordance with the presence of an origin G-rich
Repeated Element (OGRE)
2or tandemly arranged multiple (up to
6–12) G4 structures as well as ultra-short C/G-rich nucleotide
motifs found at human, mouse and chicken origins
35.
Cell differentiation alters origin positioning and activity. We
observed that in the human genome, core origins were
pre-ferentially placed near promoter regions and depleted from
Fig. 2 Higher activity origins are ubiquitously present across replicates and cell types. a Pearson’s correlation coefficient (r) of origin activities between cell types.b Euler diagrams showing the fraction of core and stochastic origins shared by the untransformed cell types. c Bar plots show the percentage of core origins that were identified as origin regions by another SNS-seq study12(black), and the expected amount of overlap with control regions (white,
dotted line). Control regions in thisfigure are regions of equal size to core origins that are located in randomised coordinates of the human genome. P-value obtained by Chi-square Goodness-of-Fit test.d Bar plot representing the percentage of regions identified by INI-seq7(in black) that overlap origins
identified in this study. Dotted bar represents the expected amount of overlap with control regions. P-value obtained by Chi-square Goodness-of-Fit test. e As in d for OK-seq23regions.f Percentage of core origins that overlap with pre-RC components ORC2 (within ± 2Kb; in red) and MCM7 (direct overlap,
in blue). Dotted bars represent the expected amount of overlap with control regions.P-values obtained by Chi-square Goodness-of-Fit test. g As in f for core origins found in clusters.h Bar plots show the percentage of ORC1- (~13,000) and ORC2-bound (~55,000) sites that host DNA replication initiation within 2 Kb. Dotted bars represent overlap with control regions.P-values obtained by Chi-square Goodness-of-Fit test. i Schematic summary of origin activity in a single cell type.j Schematic summary of origin activity in the different cell types. k Bar plots showing the percentage of all, hESC, hESC-specific, and Q1 human origins with homology to mouse (light green). Also indicated are regions in the human genome with a homologous region in the mouse (light green). Regions that are also origins in mouse are dark green. On the right, are bar plots showing the percentage of the corresponding shuffled genomic regions.l Cumulative Phastcon20way scores plotted for human DNA replication initiation sites (blue), similar-sized control regions (dotted, grey), Refseq exons (green), promoters (defined as 500 bp upstream of TSS regions, in purple) and introns (mustard).
intergenic regions (Fig.
4
a–c). This is in agreement with a number
of studies suggested that transcription is a predictive factor for
DNA replication origin specification with varying degrees of
correlation
10,24,36–40. Our data also suggests that in hematopoietic
cells, genes with higher transcriptional activity were more likely to
host an origin in their promoter region (Supplementary Fig. 4a).
Both the number and activity of origins within promoter regions
increased with the promoter transcriptional output
(Supple-mentary Fig. 4b, c). Either RNA synthesis activity per se, or open
chromatin induced by transcription complex assembly might
favour pre-RC formation
14. However, the correlation between the
position of core origins at promoter and intergenic regions
(Fig.
4
a, b) is not observed for gene bodies (Fig.
4
c). This
finding
suggests an impact of the chromatin environment of the
pro-moter, rather than RNA synthesis per se, in the preferential
localisation of origins at promoter regions.
We next used hematopoietic cells undergoing erythropoiesis to
examine the impact of changing transcriptional landscape on
in vitro G4 in vitro G4 shuffled (CTL) in silico G4 (G4H) in silico G4 shuffled (CTL) p=1E–307 p=1E–307 p=1E–307 p=1E–307 p=1E–307 p =1E–47 p=1E–307h
i
j
e
f
g
c
d
b
a
origin specification. CD34(+) hematopoietic cells were isolated
from human cord blood and differentiated towards erythropoietic
linage using erythropoietin (EPO; Supplementary Fig. 4d). Gene
ontology analysis (GREAT
41) revealed a single enriched set of
genes with origin activity increased upon erythrocyte
differentia-tion (Supplementary Fig. 4e) suggesting that DNA replicadifferentia-tion
origins are recruited to gene domains undergoing transcriptional
and epigenetic changes.
G-rich and transcription impact on origin activity. In HCs, 89%
of highly expressed genes hosted a CpGi (a G-rich region) in their
promoter, whereas only 48% of silent gene promoters hosted
CpGi (Supplementary
figure Fig. 4f). Therefore, we asked whether
the concomitant presence of a CpGi (or a G-rich stretch) and
high transcription activity was required for high origin activity in
hematopoietic cells. We did not observe a profound impact of
transcription on origin numbers, clustering or activity near CpGi
(+) promoters (Fig.
4
d–f). In addition, DNA replication initiation
activity from CpGi(+) TSS did not correlate with transcriptional
activity (Pearson’s r < 0.01, Fig.
4
g).
In contrast, there is a clear increase in origin positioning at
CpGi(−) promoters when the level of transcription is increased
(Fig.
4
h). Moreover, the number of clustered origins increased
proportionally with the transcriptional activity, and the total
origin activity was higher with increasing transcriptional activity
(Pearson’s correlation r = 0.25 Fig.
4
i–k). We observed similar
trends for gene promoters that contained a G-rich stretch of DNA
instead of a CpGi (Supplementary Fig. 4g).
Altogether, these data suggest that the presence of either a
CpGi/G-rich stretch or transcription is sufficient to recruit origin
activity. In highly active promoters, CpGi or G-rich elements are
not correlated with replication origin activity. Conversely, at
inactive promoters CpGi/G-rich motifs are clearly associated with
replication origin activity (summarised in Fig.
4
l). This result is
also in line with the presence of G-rich elements at most
replication origins.
Immortalisation results in increased origin positioning
sto-chasticity. As aberrant DNA replication is a hallmark of many
cancer cells, we next asked whether the origin repertoire was
disturbed after cell immortalisation, a key step in cancer
devel-opment leading to uncontrolled cell proliferation. To this aim, we
used three previously described immortalised cell lines obtained
by mis-expression of oncogenes
42of the parental Human
Mammary Epithelial Cell (HMEC) cell line: (i) ImM-1 in which
p53 levels was reduced by at least 50% (ΔTP53), (ii) ImM-2 in
which the oncogene RAS is overexpressed and (iii) ImM-3 in
which WNT is overexpressed
42. We identified more origins in the
immortalised cell types than in the untransformed cell types
(hESC, HC and HMEC; on average 100,000 vs 70,000 origins).
This could not be due to higher proliferation rates in these cells as
the hESC and HCs proliferated at the same or higher levels (see
Methods section). Nevertheless, untransformed and immortalised
cell types shared a common core origin repertoire (Fig.
5
a) and
the bulk of initiation events (~80%) originated from core origins
(Supplementary Fig. 5a). The higher number of origins in
immortalised cells was clearly caused by an increase in stochastic
origins (Fig.
5
b). While core (Q1 and Q2) origins were shared
between untransformed and immortalised cell types, quantiles
with lowest activity (Q8-10) were predominantly contributed by
immortalised cell types (Fig.
5
c). In order to study origins from
untransformed and immortalised cell types disjointedly, we
re-classified origins of each category into quantiles separately as
described before. Genomic localisation of core origins in relation
to genes was comparable in untransformed and immortalised cell
lines (Fig.
5
d, e). However, stochastic origins from immortalised
cells were less enriched near promoter regions (Fig.
5
e), but were
enriched in heterochromatic regions (marked by K9me3; Fig.
5
f).
Therefore, immortalisation induces low-activity origins associated
with what is heterochromatin in untransformed cells.
Immortalisation also results in differentially up- or
down-regulated origins. Strikingly, most down-down-regulated origins contain
G-rich elements such as CpGi/G4, whereas up-regulated origins
tend to be G-poor (Supplementary Fig. 5b, c). Therefore, a
change in the specification of origins occurs, with preference
shifting from G-rich to G-poor DNA for both core and stochastic
origins.
We next asked whether there was a specific distribution of core
and stochastic origins across topologically associating domains
(TADs), which are large regions of the genome that self-interact to
form three-dimensional (3D) structures
43. TAD borders are
involved in the insulation of the corresponding chromatin
domains, confining chromatin loops inside the TADs, and are
enriched in TSS and the insulator factor CTCF
43. Both human
core (Fig.
5
g) and stochastic origins (Fig.
5
h) were significantly
enriched at TAD borders (i.e.,
“smiley” trend-line). Total amount
of DNA replication initiation measured by SNS-seq was also
1.5-fold higher at TAD borders than at TAD centre (Fig.
5
i). We
obtained similar results for mouse core and stochastic origins
(Supplementary Fig. 5d). We conclude that the replication origin
density pattern mimics the structural organisation of the genome
Fig. 3 The DNA sequence content is a major predictor of DNA replication IS. a Graph showing the percentage of origins in each quantile that overlap with G4 defined by G4Hunter29(in silico) or mismatches28(in vitro G4). Dotted lines (CTL) represent overlap with control regions.b Base content of the
regionsflanking human DNA replication origins and control genomic regions. Frequency plots are centred at the origin summits. The base frequency represents the proportion of each base (0–1). The human genome is composed of 30% A,T and 20% G, C as indicated by genomic average. Origins are oriented with the highest G-content upstream.c Density plot represents the frequency of the distance measured between the initiation site summit (dotted line) and the centre /summit of the nearest ORC1 (red), ORC2 (dark red) and MCM7 (blue) bound regions. Origins are oriented with the highest G-content upstream.d As in c but for stochastic origins. e Schematic representation of a core origin. The vertical line represents the IS summit. The nearest ORC1, ORC2 and MCM7 peak centres are presented, as well as their average distance from the core IS summit. The average size of the ORC1, ORC2 and MCM7 binding sites is indicated on the left.f Bar plot showing the percentage of origins that can be predicted based on the genome-scanning (GS) algorithm. Dotted bars represent the expected amount of overlap with control regions. The pie chart shows the percentage of false-positive results (grey). P-values obtained by Chi-square Goodness-of-Fit test using observed and expected values for overlap. g Percentage of origins in each quantile predictable by the GS algorithm as inf. h Percentage ofMus musculus origins predicted by the GS algorithm as in f. i Bar plots representing the percentage of core origins that can be predicted using a combination of GS algorithm and two different machine-learning algorithms (single vector machine (SVM) and logistic regression (LR) with greedy feature selection).P-values obtained by Chi-square Goodness-of-Fit test using observed and expected values for overlap. j Schematic showing the properties of the regions predicted to be origins. G-richness in the immediate (0.5 Kb) and distal (2 Kb) upstream region to the initiation site are predictive parameters.
p=1E–307 p = 7E–7 p = 1E–30 Pearson’s r = 0.001 (no correlation) Pearson’s r = 0.25 p =2E–27 p=1E–307 p =1E–105 Lo w Medium High Silent Lo w Medium High Silent Lo w Medium High Silent Lo w Medium High Silent Lo w Medium High Silent Lo w Medium High Silent
a
b
c
e
d
f
g
h
i
j
k
l
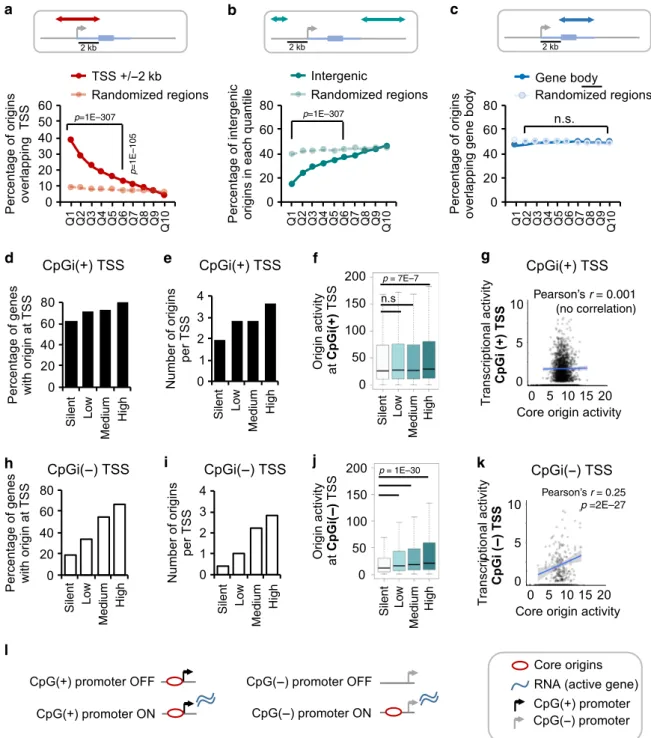
Fig. 4 Impact of transcription on the DNA replication origin landscape. a Plot representing the percentage of DNA replication origins in each quantile that overlap a promoter region (±2 Kb of TSS) of a GENCODE gene (in red). Overlaps with control regions (paler colour) which are randomly shuffled genomic regions of equal size and number as the origins are also shown.P-values obtained by Chi-square Goodness-of-Fit test using observed and expected values for overlap.b As in a for overlaps with intergenic regions (>2 Kb upstream of a GENCODE gene, TSS are excluded). c As in a for overlaps with gene body (genic region 2 Kb downstream of the TSS excluded).d Bar plot representing percentage of CpG-containing gene promoters that host a DNA replication origin within ±2 Kb of their TSS. Promoters with different transcriptional activity levels in hematopoietic cells are shown (silent= 0, low = 0–15, medium = 15–60, and high = >60 RPKM). In this figure, a promoter is considered CpG-containing (CpG(+)) if a CpG island is present within ±2 Kb of the TSS (Gencode v25).e Bar plot showing the average number of origins localised within 2 Kb of the TSS of genes with different transcriptional output levels (silent= 0, low = 0–15, medium = 15–60, and high = >60 RPKM) in hematopoietic cells. f Boxplots showing the average activity of origins localised within 2 Kb of the TSS of genes with different transcriptional output levels as ind in hematopoietic cells.P-values were obtained using the Wilcoxon test in R. g Dot plot shows the correlation of transcriptional output of CpGi(+) promoters in hematopoietic progenitors (y-axis; RPKMs, Log2) and the activity of core origins located within ±2 Kb of the TSS of these genes in hematopoietic progenitors (x-axis; normalised SNS-seq counts, Log2). Top and bottom 5% outliers were removed. The Pearson’s correlation coefficient (r) and P-value for correlation is indicated on the top, and trendline is shown in blue. h As in d for CpGi(−) promoter regions. i As in e for CpGi(−) promoter regions. j As in f for CpGi(−) promoter regions. k As in g for CpGi(−) promoter regions. l Schematic summary offindings. CpGi(+) promoters (black) tend to host DNA replication origins, irrespectively of their transcriptional status, while CpGi (−) promoters (grey) tend to host origins when they are transcriptionally active.
in individual chromatin domains. This distribution was clearly
disturbed in immortalised ImM-1 (TP53
KD) cells compared with
the parental HMEC cell line, and that this variation in origin
density on TAD borders was statistically significant (Fig.
5
j, k).
Total amount of replication initiation at TAD borders and TAD
centre was also markedly different in the ImM-1 cells compared to
the parental HMEC (Fig.
5
l). hES cells, or other untransformed cell
types did not display altered core origin density at TAD borders,
suggesting that this property is specific to immortalisation and
does not reflect high proliferation rates (Supplementary Fig. 5e).
Discussion
DNA replication origin specification remains poorly understood
despite the progress in next-generation sequencing technology
that allowed IS mapping genome-wide. In this study, we used the
SNS-Seq method, which has the highest resolution to map
replication origins
1, in which the signal was corrected with
sui-table experimental controls generated in parallel (see Methods
section). We found a remarkable consistency in the specification
of a subset of IS, termed core origins, in multiple cell types that is
maintained even after immortalisation. Core origins, which
Core origins Stochastic origins Untransformed Immortalized p= 2E–16 p= 2E–59 p= 2E–220 p= 1E–314 p= 2E–94 1,000,000 0 2,000,000 3,000,000 4,000,000 5,000,000 1,000,000 0 2,000,000 3,000,000 4,000,000 5,000,000 6,000,000 p= 2E–16 p= 2E–16 p= 2E–16 p= 1E–11 p < 2E–16a
b
c
d
e
f
g
h
i
j
k
l
represent ~30,000 regions in any given cell type, hosted the bulk
of DNA replication initiation events (70–85%) in all the studied
cell types. We uncovered that most core origins could be
pre-dicted by a computational algorithm based only on sequence
recognition, thus unequivocally concluding that replication
ori-gins are preferentially activated in a precise set of regions in
mammalian genomes in different cell types.
Our study also reveals that the underlying DNA sequence is a
prominent predictor of origin positioning in the human and
mouse genomes. The G-rich sequence patterns commonly found
in core origins were predictive of origin placement genome-wide.
When present in the human genome, 72% of these patterns were
associated with DNA replication initiation in at least one cell
type. The stretch of G-rich repeated DNA sequence (OGRE)
upstream of the IS corresponds with ORC1, ORC2 and MCM2-7
binding regions, coupled to a region with lower G and C content
(Fig.
3
b–e). Core origins are also often clustered, suggesting that
they represent regions of the genome with several potential
pre-RC binding sites. This organisation might constitute a broader
pre-RC binding platform that may host several pre-RC and
increase the efficiency of MCM loading and origin activation.
Conversely, most stochastic origins contain a shorter stretch of
G-rich region, possibly representing single putative pre-RC binding
sites (Fig.
3
b). The position of the initiation sites revealed by
SNS-seq is in perfect agreement with the positions of pre-RC factors
determined independently
30–32, which are found upstream of the
initiation site, coinciding with the G-rich region as expected,
(Fig.
3
e). Importantly, this
finding is an independent
confirma-tion of the associaconfirma-tion of G-rich regions to metazoan replicaconfirma-tion
origins.
How can a G-rich region be involved in initiation of DNA
replication? One formal possibility for G-rich SNS-seq peaks
could be the experimental protocol involving the use of lambda
exonuclease, where G-rich sequences could be resistant to
digestion
44. However, the experimental conditions for SNS-seq
used in most studies, including ours but excluding the
afore-mentioned study, are stringent (see Methods section). Moreover,
control SNS-seq samples treated in parallel (+RNase) are only
slightly enriched in G-rich DNA. In addition, the G-rich nature of
replication origins has been also confirmed using a nascent strand
purification method that does not employ lambda exonuclease
7.
Finally, some factors involved in initiation of DNA replication
co-localise with DNA replication origins (this study) and can bind to
G4 (see below).
A second possibility may be linked to the ON/OFF stages of
DNA replication origins. The opening of DNA at the replication
initiation sites requires two temporally successive steps
45,46. First,
Pre-RCs form in G1, through the binding of ORC, Cdc6 and
Cdt1, which permit the recruitment of the MCM helicase. It is
accepted that all potential origins are pre-set at this stage, but it is
still not known how the metazoan origins are recognised by the
ORC. The activation of the MCM helicase occurs at the G1-S
transition, but only 20–30% of the pre-RCs are activated in S
phase. A fundamental characteristic of G4 is its ability to form
several structures
47, including folded and unfolded forms. These
two forms might regulate the OFF stage (pre-RC) or the ON stage
(initiation) of a replication origin; Exogenous G4 sequences able
to form G4 structures do not inhibit the formation of pre-RCs in
Xenopus egg extracts, but do compete with the
firing of
replica-tion origins
48. This result may suggest that the folded form of G4
participates in the initiation of DNA synthesis but is not required
for origin recognition by pre-RC proteins. In agreement, MTBP,
RecqL and Rif1, three factors involved in origin
firing, all bind to
G4
49–53.
A third possibility is guided by the NS profile at replication
origins which may suggest that G4 act as a transient pause of the
replication fork initiating at replication origins. Several previous
studies have reported the enrichment of G-rich regions 5′ to the
initiation site
2,3,5,54and suggested a transient pause of the
repli-cation fork at the G4. This hypothesis suggests that the G-rich/
G4 structures are folded when origins are activated and then
unfolded through a mechanism imposing a transient pause of the
progressing replication fork, a phenomenon similar to
tran-scriptional pausing
55. Whether such a mechanism exists or has a
regulatory function as a checkpoint on the progression of the
replication machinery remains to be demonstrated.
The
finding that the underlying DNA sequence is predictive of
origin placement in a given species naturally leads to question to
which extent chromatin and transcriptional environment is also
involved in initiation of DNA replication. Origin positioning has
previously been correlated with open chromatin and various
histone marks related to active chromatin
2. Core origins often
coincide with transcription and regulatory elements of the
gen-ome (e.g., promoters and enhancers; Fig.
4
a and Supplementary
Figure Fig. 5f) that are associated with activating histone marks
and open chromatin
56. It is conceivable that the DNA sequence
pattern we identified is usually part of open or permissive
chro-matin. However, core origins are also present in non-genic
regions (19.4%) or silent genes. In addition, the impact of
tran-scription and the presence of a G-rich element can be uncoupled.
The presence of a G-rich element/CpGi in the promoter region of
silent genes, or in non-coding regions, is sufficient to host
replication origin activity. Of note, polycomb group proteins
associate with CpGi(+) promoters and can bind to G4 DNA
57.
We previously showed that the presence of these proteins is a
strong indicator of origin positioning, supporting a mechanism
Fig. 5 Immortalisation alters the DNA replication origin distribution in heterochromatin and at TAD borders. a Euler diagrams showing the percentage of shared core and stochastic origins identified in untransformed (white) and immortalised (grey) cell lines. b In immortalised cells stochastic origins are markedly increased. Bar plots showing the percentage of core (red) and stochastic (grey) origins identified in each cell type. c Line plot showing the percentage of origins (Q1 to Q10) identified in immortalised (pink) and untransformed (blue) cells. d Percentage of origins in each quantile (untransformed Q1–10 in blue, immortalised Q1–Q10 in pink) that overlap with promoter regions (within ±2 kb of the TSS). The expected chance overlap is shown with dotted lines (paler colours). P-values obtained by Chi-square Goodness-of-Fit test.P-value indicated in blue represent statistical analysis of overlaps in untransformed cells, while pink indicates immortalised cells.e As in d for overlaps with gene body (excluding the TSS+ 2 kb region) of GENCODE (v25) genes. f As in d for overlaps with regions enriched for heterochromatin-associated H3K9me3 histone mark (in hESC, left panel) and with regions defined as heterochromatin by HMM in hESC and K265 cells (right panel).g Plot shows the core origin (red) density across topologically associating domains (TADs)67. Average origin density per bin (100 bins) across
all TADs was plotted (y-axis, in origins/Mb). Core origin density is higher at the TAD borders, creating a “smiley” trend-line. P-values were obtained using the non-parametric Wilcoxon test in R.h Same as in g but for stochastic origins. i Bar plot showing the sum of normalised mean SNS-seq signal (y-axis, total initiation) across 19 samples coming from both core and stochastic origins at TAD borders and TAD centres. The total amount of SNS-seq signal is 1.53-fold higher at TAD borders.j Density of core origins active in HMEC (blue) and ImM-1 cells (orange) across TADs as in g. k Same as in j but for stochastic origins active in HMEC and ImM-1 cells.l As in i for HMEC (parental, in blue) and immortalised ImM-1 (in orange) cell types.
by which silent CpGi(+) gene promoters or repressed chromatin
may host origins. Interestingly a recent report also supports a
role for G4 elements in the regulation of polycomb-mediated
gene repression
58. In conclusion, even though the DNA sequence
information is not as strictly defined as the consensus ARS
ele-ment sequence present at S. Cerevisiae origins
1, its predictive
value shows that sequence specificity is a conserved feature of
replication origins in metazoan cells. We also acknowledge that a
combination of select epigenetic marks together with sequence
information might improve the prediction of metazoan
replica-tion origins.
Besides core origins, which represent most of the SNS signal,
our analysis also identified thousands of stochastic origins, which
poorly coincide with G-rich elements. Interestingly,
immortali-sation greatly increased the number of these low-activity origins,
especially within heterochromatic regions. This was accompanied
by equalisation of DNA replication initiation events at TAD
borders and centres (Fig.
5
l).
The
finding that replication origins are enriched at TAD
borders might reflect a role for DNA replication origins in the
formation of chromatin loops or their consequence. As such,
density of origins could play a role in the insulation of
repli-cation domains. This is also reminiscent of previous
findings
that origin density/origin activity is highly correlated with
replication timing
3,25. In addition, replication timing boundaries
correlate with TAD boundaries
49. Hence, altered DNA initiation
density, aberrant replication timing and altered chromosomal
structure organisation might be linked in cell types undergoing
immortalisation. A previous study linked mis-expression of the
oncogenes MYC and CCNE1 to formation of intragenic origins
upon premature S-phase entry in a tumour-derived cell line
59.
Here, we show that both the number and distribution of
repli-cation origins is perturbed during immortalisation, an
impor-tant step in cellular transformation. Both the increased
stochasticity in origin placement and perturbation of the DNA
replication initiation density profile on TADs could therefore be
new landmarks associated to cancer cells.
Methods
Cell and tissue culture. H9 hESC cells (WA-09; Wicell) were obtained from ES Cell International (ESI, Singapore) and were maintained according to supplier’s instructions, as described60. Briefly, undifferentiated hESC were grown on
mito-mycin C-treated (10 g/ml, Sigma) mouse embryonicfibroblasts (used at the cell density of 4–6 × 10⁴cells/cm2) and in medium constituted by 80% Knock-Out
DMEM, 20% Knock-Out Serum Replacement, 1% non-essential amino acids, 1mM
L-glutamine and 0.1 mMβ-mercaptoethanol. At passaging, 8 ng/ml human bFGF
(Millipore or Eurobio) was added to the medium. Peripheral blood mononuclear cells (referred to as hematopoietic cells, HC) were isolated from the umbilical cord blood of three independent human donors from the Clinique Saint Roch of Montpellier using the Ficoll density gradient method61. HC were then purified
by magnetic beads coupled with an anti-CD34 antibody, resulting in 0.5 to 1 × 10⁶
CD34+ cells, plated in culture and expanded ex vivo with supplemented Stem Span medium (IMDM+ insulin, transferrin, BSA, 5% FCS + IL-3 + IL6 + SCF) for 6–7 days. Cell differentiation towards the erythropoietic lineage was induced by addition of erythropoietin (EPO, 3 units/mL). At different time points after EPO addition (day 0, 3 and 6), an aliquot of 50 × 106cells was collected and pelleted for
molecular biology experiments (SNS-Seq, RNA-seq and RT-qPCRs for verifica-tion), while the remaining cells were left in culture. To verify erythropoietic dif-ferentiation, cells were phenotyped byflow cytometry analysis using antibodies against the hematopoietic/erythroid markers CD36, CD11b, GlyA, CD71, CD49d, CD34, CD98, IL3R and CD13 (Beckman Coulter). Differentiation into the ery-throcyte linage upon EPO incubation was also confirmed by RT-qPCR analysis of RNA from cells at day 0, 3 and 6 using primers specific for linage markers. HMEC cells were isolated and ImM1-3 cells were generated as previously described (available athttps://www.biorxiv.org/content/early/2018/06/11/344465). Briefly,
HMEC cells were initially immortalised using a stably transfected shRNA against TP53 (ImM-1). ImM-1 subclones were then generated by stable transfection of plasmids to over-express human RAS (ImM-2) or WNT (ImM-3).
Mouse ESC were cultured as previously described, and SNS-seq was carried2on
mESC (n= 4) and neuronal progenitor cells (n = 4). A total of 248,682 origins were identified and divided into 10 equal size quantiles as in human.
Ethical permissions. All experiments, including those involving hESC and hematopoietic cells adhere to the guidelines established by the French Bioethics Laws, and the“Agence Française de biomedicine”. CD34+ cells were isolated from umbilical cord blood obtained following delivery of de-identified full-term infants after written informed consent from the mothers. Use of these de-identified samples was determined to be exempt from ethical review by the University Hospital of Montpellier Institutional Review Board in accordance with the guidelines issued by the Office of Human Research Protections.
Nascent strand isolation (SNS-seq) and analysis. This method is the most precise procedure to map replication origins, although differences in SNS-seq and bioinformatics analysis methodologies, often using no or unsuitable controls, have affected the false-positive rate (FPR) in origin identification, resulting in varying properties attributed to metazoan origins4,10,13,15–17,44. Here, we are providing our SNS-seq protocol and an analysis pipeline. Briefly, cells were lysed with DNAzol, and then nascent strands were separated from genomic DNA based on sucrose gradient size fractionation2. Fractions corresponding to 0.5–2 kb were pooled,
incubated with T4 polynucleotide kinase (NEB) for 5′ end phosphorylation, and digested by overnight incubation with 140 units ofλ-exonuclease (λexn). A second
round of overnight digestion with 100 units ofλexnwas performed.λexndigests
contaminating broken genomic DNA, but not RNA-primed nascent strands22. As
experimental background control, high molecular weight genomic DNA for each cell type was heat-fragmented to the same size as nascent strands, incubated with RNase A/XRN-1 to remove the RNA primer in any contaminating nascent strand, and then treated with the same amounts ofλexnas the samples.
We should stress that the conditions ours and most laboratories use for the SNS-Seq are strictly different from the report claiming a possible bias of the lambda exonuclease digestion44. First, in classical SNS-Seq protocols, nascent RNA-primed
at replication origins are purified by melting DNA followed by the separation of the nascent strands from the bulk parental DNA by sucrose gradient centrifugation. Only then, the purified nascent strands are digested with exhaustive lambda exonuclease digestion (more than 2000 u/μg DNA). This is not the case in Foulk et al.44in which bulk DNA is simply enriched in replication intermediates by using
BND cellulose, which fractionates whole DNA that is partly single stranded. Lambda exonuclease is then used, resulting in an enzyme to DNA ratio 1000–3000-fold less than the ratio our laboratory employs. We also repeatedly reported that all our control samples (Nascent strands from mitotic DNA, or G0 DNA, or high molecular weight DNA give very low enrichment values2,4,22,48,62).
The quality of origin enrichment in each sample wasfirst tested by qPCR using primers against known human replication origins. Primers used to detect origin activity for various origins are given in Supplementary Data 4. Single stranded nascent strands werefirst purified using the CyScrib GFX Purification Kit (Illustra, 279606-02), then converted into double-stranded DNA by random priming using DNA polymerase I (Klenow fragment) and the ArrayCGH Kit (Bioprime, 45–0048). cDNA libraries were prepared using the TrueSeq Chip Library Preparation Kit (Illumina). In parallel, heat-denatured genomic DNA input controls were also purified, random-primed and libraries prepared in the same manner. All samples were sequenced at the Montpellier GenomiX (MGX) facility using an Illumina HiSeq 2500 apparatus. bcl2fastq version 2.17 from Illumina was used to produce the fastqfiles. Illumina reads (50 bp, single-end) from each SNS-seq replicate were trimmed and aligned to hg38 using Bowtie2(v2.2.6). Peaks were
called using two peak calling programs: MACS263(v2.2.1) and SICER64(v1.1
modified to contain hg38 and mm10). Peaks were first called using MACS2 (default parameters plus–bw 500 -p 1e-5 -s 60 -m 10 30–gsize 2.7e9), followed by peak calling by SICER [parameters: redundancy threshold= 1, window size (bp) = 200, fragment size= 150, effective genome fraction = 0.85, gap size (bp) = 600 and FDR= 1e-3]. MACS2 peaks that intersect SICER peaks from each sample were merged using bedtools intersect to generate a comprehensive list of all human DNA initiation sites (IS; Table 1). Blacklisted regions as defined by the ENCODE project (hg38, ENCSR636HFF) were subtracted from thefinal human DNA replication origin list. Mouse SNS-seq samples were processed as human SNS-seq and were also divided into quantiles (mQ1-mQ10) with each quantile containing 25,168 regions. Principal component and analysis and sample distances suggest that for cell types obtained from a single donor (i.e. HMEC), the overlap of origins is stronger amongst the replicates, than it is with other cell types. For donor-derived cell type (hematopoietic cells), we observed that the SNS-seq samples are more similar within the same donor than with treatment status (i.e. treatment with EPO). This is in contrast with the RNA-seq data, where samples cluster according to their treatment (EPO) and not their origin (donor).
SNS-seq optimisation and quality controls. Different experimental and bioin-formatics methodologies have been used to obtain and analyse seq data. SNS-seq relies on theλexnability to specifically digest genomic DNA, while leaving the
newly synthesised, RNA-primed nascent DNA intact. Our analysis suggests that peak calling to define origin locations using 19 human SNS-seq samples in the absence of a background or experimental genomic DNA background identified ~200,000 and 150,000 peaks per sample respectively (mean number of peaks). This number is reduced by about half when an appropriate experimental background (heat-fragmented genomic DNA treated with RNAse andλexn) is used, suggesting