Publisher’s version / Version de l'éditeur:
Review of Quantitative Nondestructive Evaluation, 23, pp. 1264-1271, 2004-02-26
READ THESE TERMS AND CONDITIONS CAREFULLY BEFORE USING THIS WEBSITE. https://nrc-publications.canada.ca/eng/copyright
Vous avez des questions? Nous pouvons vous aider. Pour communiquer directement avec un auteur, consultez la
première page de la revue dans laquelle son article a été publié afin de trouver ses coordonnées. Si vous n’arrivez pas à les repérer, communiquez avec nous à [email protected].
Questions? Contact the NRC Publications Archive team at
[email protected]. If you wish to email the authors directly, please see the first page of the publication for their contact information.
NRC Publications Archive
Archives des publications du CNRC
This publication could be one of several versions: author’s original, accepted manuscript or the publisher’s version. / La version de cette publication peut être l’une des suivantes : la version prépublication de l’auteur, la version acceptée du manuscrit ou la version de l’éditeur.
For the publisher’s version, please access the DOI link below./ Pour consulter la version de l’éditeur, utilisez le lien DOI ci-dessous.
https://doi.org/10.1063/1.1711762
Access and use of this website and the material on it are subject to the Terms and Conditions set forth at
Characterization of Surface-Breaking Tight Cracks Using
Laser-Ultrasonic Shadowing
Monchalin, J.-P.; Ochiai, M.; Lévesque, D.; Blouin, A.; Talbot, R.; Fukumoto,
A.
https://publications-cnrc.canada.ca/fra/droits
L’accès à ce site Web et l’utilisation de son contenu sont assujettis aux conditions présentées dans le site LISEZ CES CONDITIONS ATTENTIVEMENT AVANT D’UTILISER CE SITE WEB.
NRC Publications Record / Notice d'Archives des publications de CNRC:
https://nrc-publications.canada.ca/eng/view/object/?id=f5452a1a-70bd-4e20-98b9-26e64bb63528 https://publications-cnrc.canada.ca/fra/voir/objet/?id=f5452a1a-70bd-4e20-98b9-26e64bb63528
CHARACTERIZATION OF SURFACE-BREAKING TIGHT CRACKS
USING LASER-ULTRASONIC SHADOWING
J.-P. Monchalin1, M. Ochiai2, D. Lévesque1, A. Blouin1, R. Talbot1 and A. Fukumoto2
1 Industrial Materials Institute, National Research Council Canada, Boucherville, PQ,
Canada
2
Power and Industrial Systems R&D Centre, Toshiba Corp., Yokohama, Japan
ABSTRACT. A laser-ultrasonic method based on the shadowing effect is used for sizing and locating surface-breaking tight cracks in metals. The two laser spots are separated by a fixed distance to detect ultrasound propagating at oblique incidence with respect to the sample surface. The laser spots are scanned along the same line across the path of cracks on the cracking surface or opposite surface. The amplitude of the longitudinal or shear waves specularly reflected from the backwall is extracted from each signal to construct an amplitude profile. In the presence of a crack, the profile shows regions of reduced amplitude due to shadowing of the direct or reflected beam from the backwall. The sharp amplitude drop and the gentle signal recovery observed are well predicted by a model of crack tip diffraction. The crack depth can be simply determined by considering the immediate vicinity of the amplitude drop. Results are shown on a stainless steel sample having a variable depth slot as well as on a sample containing actual surface-breaking tight cracks having widths of less than 30 µm.
INTRODUCTION
Structural materials should be generally free of any anomaly or discontinuity to satisfy the requirements of functionality and safety of the systems and structures in which they are used. These discontinuities could originate from fabrication or material degradation during service. Particularly severe are stress corrosion cracks (SCCs) and fatigue cracks. These flaws are caused by a combination of factors from the environment during service and usually starts from the surface. They could occur in structural materials such as carbon steel, stainless steel, inconel and other alloys.
Regarding crack inspection, there are three important aspects: 1) detection, 2) location and 3) sizing. Various nondestructive techniques have been suggested to perform the inspection. However, none of these techniques satisfy all the requirements either for fundamental limitations or for more practical reasons. For example, liquid penetrant testing (PT) is one of the most sensitive and reliable methods of detecting and locating surface-breaking cracks; however, it does not provide information about crack depths and about cracks not opening to the surface. Radiography testing (RT) is capable of detecting and
locating internal defects; however, RT is often difficult to use in industrial in-service inspection and is not very sensitive for detecting very tight cracks. Time-of-flight diffraction (TOFD) relies on detection of crack tip ultrasonic diffraction for defect characterization [1]. Although TOFD is well understood and widely used, it does not always have a sufficient sensitivity, in particular in the strongly attenuating materials having coarse grains. Recently, we have proposed a technique that combines laser-ultrasonics and numerical focusing with the Fourier-domain Synthetic Aperture Focusing Technique (F-SAFT) for imaging the detailed structure of surface-breaking tight cracks from the surface opposite to cracking [2,3]. Very detailed images of SCCs were obtained with this technique but the determination of crack depth was not always possible.
In this paper, a laser-ultrasonic method based on the shadowing effect is investigated for sizing and locating surface-breaking tight cracks in metals. Laser-ultrasonics [4-6] is a non-contact inspection technique using lasers for the generation and detection of ultrasound. The combined use of the ultrasonic shadow zone with a non-contact technique has been reported recently for the characterization of cracks from the opposite side [7] and internal rail transverse defects [8]. Here, a more practical approach in the interpretation of the amplitude profiles is proposed for sizing cracks, considering inspection from both sides on a stainless steel sample having a variable depth slot. Assuming nearly vertical cracks, it is shown that the crack depth can be simply determined by considering the immediate vicinity of the sharp amplitude drop following shadowing. Also, laser-ultrasonic results are presented for a sample containing actual SCCs having widths of less than 30 µm.
PRINCIPLE OF SHADOWING AND EXPERIMENTAL SETUP
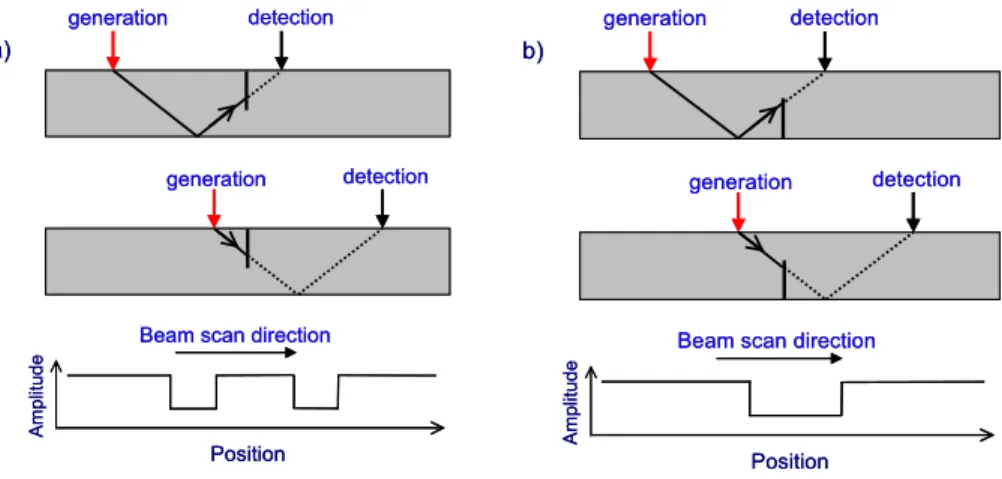
The principle of the laser-ultrasonic shadowing method (LUSM) is illustrated in Fig. 1. The two laser spots are separated by a fixed distance to collect ultrasound propagating obliquely with respect to the surface. For inspection on the same side as cracking (Fig. 1a), the laser spots are scanned along the same line across the path of cracks on the surface of a plate-like sample. The amplitude of the longitudinal or shear waves specularly reflected from the backwall is extracted from each signal to construct amplitude profiles. In the presence of a crack, the profile (bottom figure) shows two regions of reduced amplitude due to shadowing of respectively the reflected beam and the direct beam from the backwall. The total distance between the first amplitude drop and the final recovery corresponds to the separation between the generation and detection spot and provides no useful information. However, the width of each region is proportional to the crack depth. For inspection on the surface opposite to cracking (Fig. 1b), the scanning and echo extraction are similar. In the presence of a crack, one can verify that the shadow of the reflected and the direct beams in the profile (bottom figure) produces only one region of reduced amplitude, narrower than the separation between generation and detection spots, and that the width is proportional to the crack depth.
Since LUSM is based on bottom echoes instead of tip diffraction, a better signal-to-noise ratio is expected from LUSM than from ultrasonic TOFD. Also, LUSM can be used for inspection from the cracking surface or from the opposite surface and only requires a few lines scanning and simple signal processing. In addition, the separation of the generation and detection spots makes underwater inspection easier, i.e. for nuclear reactor maintenance, avoiding acoustic perturbations coming through water.
FIGURE 1. Principle of shadowing for inspection on a) the same side and b) opposite side of cracking.
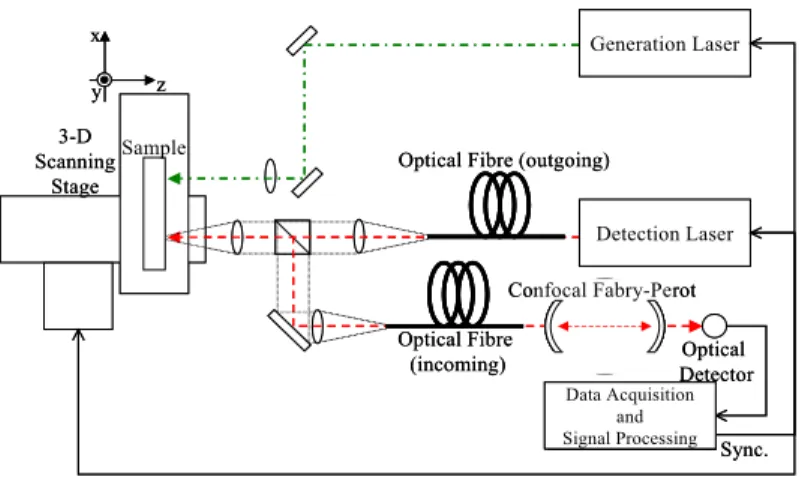
An experimental configuration for the LUSM is outlined in Fig. 2. Ultrasonic waves are generated by a frequency-doubled Nd:YAG laser pulses of about 10 ns duration and 75 mJ energy. A lens is used to focus the laser pulses to a 100 µm spot size on the sample surface. The fluence at the surface is higher than the ablation threshold at each irradiated location. This method of excitation simultaneously generates various acoustic modes, such as surface-skimming longitudinal waves (P), Rayleigh waves (R), bulk longitudinal waves (L), bulk shear waves (S) in the sample and the shock waves in air (A) originating from the ablation plasma expansion. Except for the shock wave, these waves are all typically in the 0.5 MHz and 20 MHz frequency bandwidth but have their respective directivity patterns.
As already mentioned, the two laser spots are separated by a fixed distance to collect ultrasound propagating obliquely with respect to the surface. Taking into account the emission pattern of the laser-generated ultrasound, an incident angle of about 45o is close to optimum, in particular for shear waves. The ultrasonic waves travelling in the medium are detected by measuring the displacement of the sample surface using an optical detection system based on a confocal Fabry-Perot interferometer [6]. Two multimode optical fibers having a core diameter of 400 µm are employed; one fiber is used to deliver light of the detection laser to the sample surface, while the other one is used to bring to the interferometer the light scattered by the material surface. The detection laser is a single frequency Nd:YAG laser which delivers high peak power (≈1 kW) long pulses of about 70 µs duration at a 1064 nm wavelength. The confocal Fabry-Perot is 1 m long and has a bandwidth extending from about 2 MHz to 12 MHz for the detection of the surface motion.
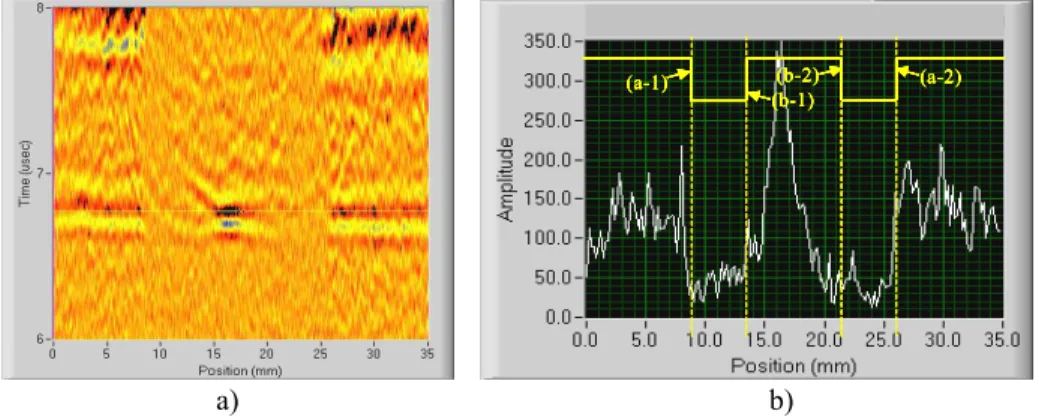
The sample is scanned along a line of typically 40 mm across the path of cracks with a step size of 50 µm. The acquired signals are band-pass filtered from 3 MHz to 10 MHz and are reconstructed as a B-scan image. Fig. 3 shows a typical B-scan near the arrival time of the first bottom echo of the L-wave as well as the extracted amplitude profile obtained on
generation detection
generation detection
Beam scan direction
Position Amp litu d e b) generation detection generation detection
Beam scan direction
Position Amp litu d e b) generation detection generation detection
Beam scan direction
Position Amplitud e a) generation detection generation detection
Beam scan direction
Position
Amplitud
e
FIGURE 2. Experimental set up for the LUSM.
the cracking surface of a stainless steel sample. A time gate of 0.2 µs and four-time spatial averaging is applied to evaluate the peak-to-peak amplitude profile of the L-wave bottom echoes. Also, the amplitude at each position could be normalized with the amplitude of the Rayleigh wave, indicative of the generation efficiency from shot-to-shot, but such a normalization was not implemented in the results reported here. The geometrical prediction for the amplitude profile of the bottom echoes is also indicated in Fig. 3b. It is found that the profile agrees well with the prediction and that the obvious drops are caused by the shadowing effect. A shadow indicated by the pair (a-1) and (b-1) is produced by the shadowing of the reflected beam, and the other shadow with the pair (b-2) and (a-2) is produced by the shadowing of the direct beam. It is obvious that the portions of (a-1) and (a-2) are produced when the ultrasonic wave is incident on the crack opening and the portions of (b-1) and (b-2) are produced when the wave is incident on the crack tip (see Fig. 1a). As discussed next, diffraction and mode conversion at the tip may explain the more gentle signal recovery observed between (b-1) and (b-2) instead of a steep change predicted by geometrical analysis.
DETERMINATION OF CRACK DEPTH
Based on a simple geometric analysis, one line scan with a fixed separation between generation and detection should give amplitude profiles as in Fig. 1. The width of each signal drop would be directly related to the crack depth and dependent on the chosen incident angle. However, as already mentioned, one side of the signal drop is found not sharp. Even if the shape of the shadow becomes a triangle, it should be still possible to evaluate the crack depth from the width or another related feature from the profile.
x
y z
Generation Laser
Detection Laser Optical Fibre (outgoing)
Optical Fibre (incoming) Confocal Fabry-Perot Optical Detector Data Acquisition and Signal Processing 3-D Scanning Stage Sample Sync. x y z Generation Laser Detection Laser Optical Fibre (outgoing)
Optical Fibre (incoming) Confocal Fabry-Perot Optical Detector Data Acquisition and Signal Processing Data Acquisition and Signal Processing 3-D Scanning Stage Sample Sync. 1267
a) b)
FIGURE 3. Typical B-scan in a) and extracted amplitude profile in b) for inspection on the cracking surface.
Evidence of the contribution of diffraction to the triangular shape comes from the B-scan analysis. As shown in Fig. 3a, the arrival time of the bottom echo when observed in details actually shows a curved feature in the region of the gentle signal recovery, indicative of a longer path. For inspection on the cracking surface, Fig. 4 gives a simple explanation for this fact when considering a detection point in the shadow of the crack (path d0). Laser-generated ultrasound having a fairly broad emission pattern, the detection
point can be reached by another ray path (path d1) specularly reflected from the same
generation point to the crack tip, and then diffracted from the crack tip to the detection point. Notice also that there is the possibility of mode conversion (L to S) at the tip. One finds that the difference of arrival times along the diffracted path and the shadowed path considering no mode conversion (L-L) essentially agrees with the observation of the curved feature in the B-scan. Based on this analysis, we conclude that the gentle signal recovery is due to the diffraction at the crack tip and therefore, the direct (geometric) determination of the crack depth is not readily feasible.
One way to evaluate crack depth would be to use a crack tip diffraction model to best fit the measured amplitude profile. Several mathematical models have been developed in the past to predict the diffraction pattern of a plane wave incident on a crack considered as a semi-infinite plane [9]. Such a model has been used to evaluate the amplitude at each position of a line scan and predict the shape of the profile according to the analysis above. Comparison with experimental profiles (not shown here) is only in qualitative agreement and generally, the model underestimates the effect of diffraction. At this time, the use of a model appears not reliable enough to estimate the crack depth from curve fitting.
(a-1) (b-1) (a-2) (b-2) (a-1) (b-1) (a-2) (b-2) (a-1) (b-1) (a-2) (b-2) (a-1) (b-1) (a-2) (b-2) (a-1) (b-1) (a-2) (b-2) (a-1) (b-1) (a-2) (b-2) (a-1) (b-1) (a-2) (b-2) Shadowed ray Diffracted ray (LL or L -Detection Crack tip d0 d1 Diffracted ray (L-L or L-S) Generation Shadowed ray Diffracted ray (LL or L -Detection Crack tip d0 d1 Diffracted ray (L-L or L-S) Generation
FIGURE 5. Definition of the drop area parameter for calibration, with inspection on the cracking surface.
The proposed approach to determine crack depth is to built a calibration curve using a parameter related to the signal drop extracted from many experimental profiles. For this purpose, a variable depth slot having a width of 0.3 mm and depths from 0 mm to 10 mm was machined in a stainless steel sample 15 mm thick. Amplitude profiles for both L and S waves were extracted from the B-scans for inspections from both sides. The drop area parameter (in dB.mm) defined in Fig. 5 appears a good choice for inspection on the cracking surface. Based on the diffraction analysis above, the drop-area parameter combines two aspects related to crack depth: the importance of the signal drop in the presence of shadow and the lateral extent over which this occurs. Therefore, the crack depth can be simply determined by considering the immediate vicinity (over the gate length) of the signal drop. In the presence of multiple cracks, the drop-area parameter should be more reliable than fitting the whole profile. For inspection from the surface opposite to cracking, the drop area is similarly defined but the gate is at the center of the signal drop.
MEASUREMENT RESULTS
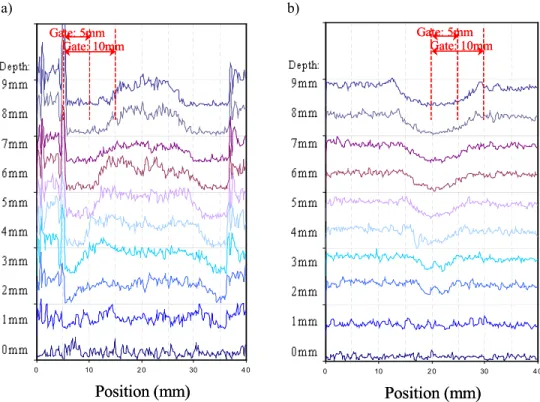
LUSM profiles of S-wave on the variable depth slot sample are shown in Fig. 6 for inspection from the same side (separation 30 mm) and the opposite side (separation 18 mm) to cracking. Clearly, one can see the increase in signal drop as well as its extent over position as function of the slot depth. Relations between the slot depth and the drop area parameter with gate lengths of 2.5 mm, 5 mm, 10 mm and 15 mm are shown in Fig. 7 for inspection on the cracking surface. The correlations with the gate length of 2.5 mm and 5 mm are poor for deeper slots, while that with the gate length of 15 mm is seen inadequate for shallower slots. We observe that the gate length of 10 mm gives an excellent linear relation between the drop area and the slot depth. Similar results are obtained for L-wave (not shown) but the calibration is generally not as good. This may be attributed to the non-optimal emission pattern of L-wave for oblique incidence to the crack.
Also, measurements were performed on a sample made of stainless steel 10 mm thick and having a few stress corrosion cracks. These SCCs, each being less than 0.1 mm wide, were introduced by boiling the sample in a 42% MgCl2 solution with an applied stress.
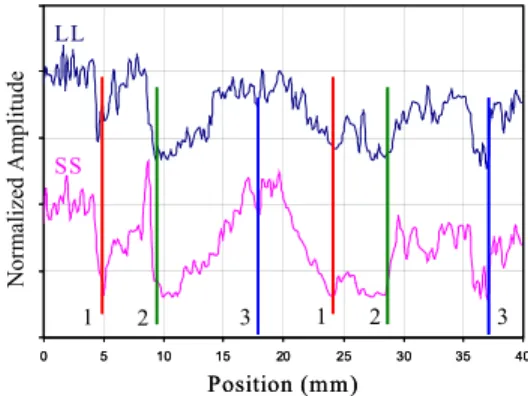
LUSM profiles of L and S waves are shown in Fig. 8 for a separation of 20 mm and inspection on the cracking surface. This figure confirms that clear shadows are observed even on a SCC sample. Looking for pairs of signal drops having the same distance as the
0 1 0 2 0 3 0 4 0 Position (m m ) Am pl it ud e ( d B) G ate D rop A rea 0 1 0 2 0 3 0 4 0 Position (m m ) Am pl it ud e ( d B) G ate D rop A rea 1269
separation between generation and detection, three principal pairs indicated by labels 1-3 are found. Comparing the size of the triangle shapes, it seems that the crack indicated by label 2 is the deepest. The drop-area parameter is expected to provide quantitative results in the presence of multiple cracks, but further effort is needed to exploit this approach for this more complicated case. In particular, it appears desirable to improve the signal-to-noise ratio by the normalization mentioned above.
a) b)
FIGURE 6. LUSM profiles of S-wave on the variable depth slot sample for inspection on a) cracking surface and b) surface opposite.
0 10 2 0 30 4 0
Position (mm)
Gate: 5mm Gate: 10mm 0 10 2 0 30 4 0Position (mm)
Gate: 5mm Gate: 10mm Gate: 5mm Gate: 10mm 0 10 2 0 30 4 0Position (mm)
Gate: 5mm Gate: 10mm 0 10 2 0 30 4 0Position (mm)
Gate: 5mm Gate: 10mm Gate: 5mm Gate: 10mm -200 -150 -100 -50 0 0 2 4 6 8 10 Gate: 2.5mm Gate: 5mm Gate:10mm Gate: 15mm Slot Depth (mm) Dro p Ar ea ( d B· mm ) -200 -150 -100 -50 0 0 2 4 6 8 10 Gate: 2.5mm Gate: 5mm Gate:10mm Gate: 15mm Slot Depth (mm) Dro p Ar ea ( d B· mm )FIGURE 8. LUSM profiles of L and S waves for inspection on cracking surface.
CONCLUSION
We have reported the use of laser-ultrasonics coupled to a shadowing technique (LUSM) for sizing and locating surface-breaking tight cracks in metals. The most significant advantage of the LUSM is that the bottom echoes which have the highest signal-to-noise ratio are used as signals. From measured profiles, a parameter related to signal drop and based on crack tip diffraction in the presence of shadow has been proposed for determination of crack depth. This parameter allows a local measurement and may be more reliable in the presence of multiple cracks. The LUSM works well for inspection from both sides, particularly from the cracking surface. We have also presented results obtained on a sample containing actual SCCs having widths of less than 30 µm, which show that the technique allows clearly crack detection and identification. Precise sizing in this more complicated case would however require further development.
REFERENCES
1. Charlesworth, J.P. and Temple, J.A.G., Engineering Applications of Ultrasonic
Time-of-Flight Diffraction, Taunton, Research Studies Press Ltd., 1989.
2. Lévesque, D., Ochiai, M., Blouin, A., Talbot, R., Fukumoto, A. and Monchalin, J.-P., 2002 IEEE Ultrasonics Symposium Proc., 2002, p. 732.
3. Ochiai, M., Lévesque, D., Talbot, R., Blouin, A., Fukumoto, A. and Monchalin, J.-P., Materials Evaluation, 2003, to appear.
4. Scruby, C.B. and Drain, L.E., Laser-Ultrasonics: Techniques and Applications, Adam Hilger, Bristol, UK, 1990.
5. Monchalin, J.-P., IEEE Trans. Ultrason. Ferroelectrics and Freq. Cont. 33, 485 (1986).
6. Monchalin, J.-P., Héon, R., Bouchard, P., Padioleau, C., Appl. Phys. Lett. 55, 1612 (1989).
7. Bernstein, J.R. and Spicer, J.B., J. Acoust. Soc. Am. 111, 1685 (2002).
8. Wooh, S.-C., Wang, J., in Review of Progress in QNDE, Vol. 21, eds. D.O. Thompson and D.E. Chimenti, AIP, New York, 2002, p. 1819.
9. J.A. Ogilvy, J.A. and Temple, J.A.G., Ultrasonics 21, 259 (1983). 0 5 10 15 20 25 0 5 10 15 20 25 30 35 40 LL SS Position (mm) N o rm al iz ed A m pl it u d e 1 2 3 1 2 3 0 5 10 15 20 25 0 5 10 15 20 25 30 35 40 LL SS Position (mm) N o rm al iz ed A m pl it u d e 1 2 3 1 2 3 1271