HAL Id: hal-01602497
https://hal.archives-ouvertes.fr/hal-01602497
Submitted on 27 May 2020
HAL is a multi-disciplinary open access
archive for the deposit and dissemination of sci-entific research documents, whether they are pub-lished or not. The documents may come from teaching and research institutions in France or abroad, or from public or private research centers.
L’archive ouverte pluridisciplinaire HAL, est destinée au dépôt et à la diffusion de documents scientifiques de niveau recherche, publiés ou non, émanant des établissements d’enseignement et de recherche français ou étrangers, des laboratoires publics ou privés.
Comparison of standardised versus non-standardised
methods for testing the in vitro potency of
oxytetracycline against Mannheimia haemolytica and
Pasteurella multocida
Peter Lees, Joanna Illambas, Ludovic Pelligand, Pierre-Louis Toutain
To cite this version:
Peter Lees, Joanna Illambas, Ludovic Pelligand, Pierre-Louis Toutain. Comparison of standard-ised versus non-standardstandard-ised methods for testing the in vitro potency of oxytetracycline against Mannheimia haemolytica and Pasteurella multocida. Veterinary Journal, Elsevier, 2016, 218, pp.60-64. �10.1016/j.tvjl.2016.11.006�. �hal-01602497�
Version postprint
Accepted Manuscript
Title: Comparison of standardised versus non-standardised methods for testing the in vitro potency of oxytetracycline against mannheimia haemolytica and
pasteurella multocida
Author: P. Lees, J. Illambas, L. Pelligand, P.-L. Toutain PII: S1090-0233(16)30191-5
DOI: http://dx.doi.org/doi: 10.1016/j.tvjl.2016.11.006 Reference: YTVJL 4902
To appear in: The Veterinary Journal
Accepted date: 14-11-2016
Please cite this article as: P. Lees, J. Illambas, L. Pelligand, P.-L. Toutain, Comparison of standardised versus non-standardised methods for testing the in vitro potency of oxytetracycline against mannheimia haemolytica and pasteurella multocida, The Veterinary Journal (2016), http://dx.doi.org/doi: 10.1016/j.tvjl.2016.11.006.
This is a PDF file of an unedited manuscript that has been accepted for publication. As a service to our customers we are providing this early version of the manuscript. The manuscript will undergo copyediting, typesetting, and review of the resulting proof before it is published in its final form. Please note that during the production process errors may be discovered which could affect the content, and all legal disclaimers that apply to the journal pertain.
Version postprint
Comparison of standardised versus non-standardised methods for testing the in vitro
1
potency of oxytetracycline against Mannheimia haemolytica and Pasteurella multocida
2 3 4
P. Lees a, J. Illambas a,1, L. Pelligand a, P.-L. Toutain b,* 5
6
a
Royal Veterinary College, Hawkshead Campus, Hatfield, Herts. AL9 7TA, United Kingdom 7
b
Toxalim, Université de Toulouse,INRA, ENVT, Toulouse, 23, Chemin des Capelles-BP 8
87614, 31076 Toulouse Cedex 03, France 9
10 11 12 13
* Corresponding author. Tel.: +33 680 340943. 14
E-mail address: pltoutain@wanadoo.fr (P-L. Toutain). 15
1
Present address: Institute of Cancer Research, Sutton, Surrey SM2 5NG, United Kingdom. 16
Version postprint
Highlights
17
Mannheimia haemolytica and Pasteurella multocida isolates were obtained from 18
cattle with respiratory disease. 19
The pharmacodynamics of oxytetracycline were determined for M. haemolytica 20
and P. multocida. 21
Minimum inhibitory concentrations were substantially higher in serum than in 22
broth. 23
Serum broth differences were not attributable to protein binding. 24
The clinical efficacy of oxytetracycline may not depend solely on killing bacteria. 25
Abstract
26
The in vitro pharmacodynamics of oxytetracycline were established for six isolates of 27
each of the calf pneumonia pathogens Mannheimia haemolytica and Pasteurella multocida. 28
Minimum inhibitory concentration (MIC), minimum bactericidal concentration (MBC) and 29
bacterial time-kill curves were determined in two matrices, Mueller Hinton broth (MHB) and 30
calf serum. Geometric mean MIC ratios, serum:MHB, were 25.2:1 (M. haemolytica) and 31
27.4:1 (P. multocida). The degree of binding of oxytetracycline to serum protein was 52.4%. 32
Differences between serum and broth MICs could not be accounted for by oxytetracycline 33
binding to serum protein. In vitro time-kill data suggested a co-dependent killing action of 34
oxytetracycline. The in vitro data indicate inhibition of the killing action of oxytetracycline by 35
serum factor(s). The nature of the inhibition requires further study. The outcome of treatment 36
with oxytetracycline of respiratory tract infections in calves caused by M. haemolytica and P. 37
multocida may not be related solely to a direct killing action. 38
39
Keywords: Mannheimia haemolytica; Pasteurella multocida; Bovine; Oxytetracycline; 40
Pharmacodynamics 41
Version postprint
Introduction
42
Oxytetracycline is an antimicrobial drug with a broad spectrum of activity. The 43
spectrum includes two bacterial pathogens implicated in bovine pneumonia, Mannheimia 44
haemolytica and Pasteurella multocida (Nouws and Vree, 1983; Nouws et al., 1985; Nouws 45
et al., 1990; Esaki et al., 2005). Oxytetracycline is still used extensively, despite the 46
development of resistance in some species of bacteria. It is available in long acting, high 47
strength formulations. These depot formulations provide sustained absorption from the site of 48
injection (Nouws and Vree, 1983; Toutain and Raynaud, 1983; Davey et al., 1985; Nouws et 49
al., 1990). 50
51
The potency of antimicrobial drugs is generally determined in vitro, based on the 52
minimum inhibitory concentration (MIC). The widely accepted standards for MIC 53
determination have been defined by the European Union Committee on Antimicrobial 54
Sensitivity testing (EUCAST) and the Clinical Laboratory Standards Institute (CLSI); they 55
ensure reproducible findings and thereby enable data to be harmonised internationally. This is 56
essential when comparing data from several laboratories, between countries and across time 57
periods for susceptibility testing. The two-fold dilution used is important because, when 58
plotted on a histogram, the distributions are log-normal when using a log2 distribution. The
59
plots of histograms are more easily examined for the purpose of identifying wild-type 60
distributions. 61
62
However, the standardised CLSI/EUCAST methods of determining MIC have two 63
drawbacks for the purposes of this study. Firstly, they are based on two-fold, dilutions, with 64
the potential consequence of up to 100% error, thus having a limitation regarding accuracy on 65
single isolate estimates. Accuracy rather than precision is of importance in generating MIC 66
Version postprint
data for the purpose of using pharmacodynamic (PD) data together with pharmacokinetic 67
(PK) data for the purpose of dose prediction. To meet (in part) this concern, previous studies 68
have used five sets of overlapping doubling dilutions to reduce inaccuracy on single isolate 69
estimates (Aliabadi and Lees, 2001; Sidhu et al., 2010). Secondly, CLSI/EUCAST standards 70
for MIC determinations are based on the use of artificial growth media. Whilst these provide 71
optimal growth conditions in vitro, they differ in composition from biological fluids. 72
73
To provide comparisons between broths and biological fluids, previous studies have 74
been undertaken in calf serum and inflammatory exudates (Aliabadi and Lees, 2001, 2002; 75
Sidhu et al., 2003; Sidhu et al., 2010). A M. haemolytica isolate of calf origin had a MIC in 76
serum 19 times greater than the broth MIC (Brentnall et al., 2012). Hence, the quantitative 77
determination of PD indices with improved accuracy and in biological matrices, for some 78
drug classes, may be helpful to the application of PK/PD approaches to dose determination. It 79
is accepted that the vast majority of the published literature has relied on either EUCAST or 80
CLSI methodology for determining MIC. This article therefore extends those findings. 81
82
Some authors recommend restriction of the term MIC for measurements undertaken in 83
broths recommended by CLSI and EUCAST, with the requisite fluid being defined for each 84
pathogenic species. However, the term MIC has been accepted in the peer reviewed literature, 85
for other growth matrices and is retained in this article (Honeyman et al., 2015). 86
87
The aim of this study was to evaluate factors influencing the antimicrobial PDs of 88
oxytetracycline for two calf pneumonia pathogens, M. haemolytica and P. multocida. The 89
objectives were: (1) to compare in vitro MIC, MBC and time-kill profiles of oxytetracycline 90
in two matrices, Mueller Hinton Broth (MHB) and calf serum; (2) to investigate the influence 91
Version postprint
of serum on MHB MICs by combining the two matrices in varying proportions; (3) to 92
determine the effect of low, intermediate and high bacterial counts on oxytetracycline MICs; 93
(4) to compare in vitro time-kill curves for oxytetracycline in MHB and calf serum; and (5) to 94
determine the degree of binding of oxytetracycline to protein in calf serum. 95
96
Materials and methods
97
Origin, storage, selection and culture of bacterial isolates 98
Twenty isolates of each of two calf pathogens, M. haemolytica and P. multocida, were 99
obtained post-mortem from field cases of calf pneumonia in various geographical regions of 100
the United Kingdom. They were supplied on swabs by the Veterinary Laboratories Agency 101
(AHVLA), now Animal and Plant Health Agency (APHA), and stored at -70 °C in 102
glycerol:milk:water (20:10:70). This fluid was boiled for 5 s, left to cool for 12 h and then 103
boiled again for a further 5 s. 104
105
Two criteria were used to select 6/20 isolates of each of the two bacterial species for 106
further study: (1) each isolate was investigated for its ability to grow logarithmically in four 107
fluids (MHB and calf serum, exudate and transudate); (2) each isolate was evaluated for 108
susceptibility to oxytetracycline by disc diffusion and measurement of diameter of zone of 109
growth inhibition. Since tetracycline but not oxytetracycline is listed in the CLSI standards, 110
this measurement was not determined according to CLSI (2008). MICs were then determined 111
in MHB, using doubling dilutions. 112
113
Culture methods and bacterial viability counts, determined by serial dilution and spot-114
plate counts, were as described by Lees et al. (2015). 115
Version postprint
Minimum inhibitory and minimum bactericidal concentrations 117
MICs for six isolates each of M. haemolytica and P. multocida were determined by 118
broth microdilution in accordance with CLSI methods (CLSI, 2008), except that: (1) our study 119
used MHB whereas CLSI requires use of cation adjusted MHB and, in future studies, the 120
former would be preferred; and (2) to improve accuracy, five overlapping sets of 121
doubling/two-fold dilutions of oxytetracycline were prepared in MHB, instead of the CLSI 122
standard, which uses one set of doubling dilutions. Quality control (QC) organisms were not 123
tested in this study to validate the assay because, for a small number of isolates, six of each of 124
two species (as opposed to testing hundreds/thousands of isolates in constructing MIC 125
distributions), this works well. What mattered more for this study was to reduce the error on 126
individual estimates for a small number of isolates (12) from up to 100% to no more than 127
20%. This we did on the advice of A. Rycroft, Royal Veterinary College, University of 128
London, United Kingdom). 129
130
The methods for MIC and MBC determinations were as previously described (Lees et 131
al., 2015). The bactericidal assay was performed according to methods that have not been 132
standardised by CLSI or EUCAST.QC was not performed on the MIC tests conducted for 133
this study on oxytetracycline, because CLSI and EUCAST methods are based on tetracycline 134
and not oxytetracycline. MIC determinations for the six isolates of both bacterial species were 135
repeated, using five sets of overlapping two-fold dilutions of oxytetracycline prepared in 136
bovine serum (Gibco). The influence of serum/MHB mixtures and inoculum size on MIC was 137
determined as described in Appendix A. 138
139
Antimicrobial growth (time-kill) curves 140
Version postprint
For six isolates each of M. haemolytica and P. multocida, in vitro time-kill curves 141
were established using oxytetracycline concentrations corresponding to 0.25, 0.5, 1, 2 and 4x 142
multiples of MIC in both MHB and calf serum, as previously described (Lees et al., 2015). 143
The lowest quantifiable count was 33 colony forming units (CFU)/mL. Ex vivo analyses were 144
performed as described in Appendix B. 145
146
Serum protein binding of oxytetracycline 147
The degree of binding of oxytetracycline to serum protein in vivo was determined in 148
triplicate on pooled samples from 10 calves harvested from a tissue cage study for seven 149
concentrations, ranging from 0.43 to 2.07 µg/mL. The total concentration was measured on 150
each sample as described in Appendix B and binding to protein was determined on a second 151
aliquot of each sample by ultracentrifugation at 4,000 g and 25 °C for 20 min. The 152
ultrafiltration device used was an Amicon Ultra Centrifugal filter (Ultracel 10 K, Millipore) 153
and oxytetracycline concentrations were re-determined on the ultrafiltrate. 154
155
Statistical analyses 156
MIC and MBC data are presented as geometric means and standard deviation (SD). 157
Differences in MIC and MBC values between MHB and serum were compared with a paired t 158
test or the non-parametric Wilcoxon test, depending on whether the data passed a normality 159 test. 160 161 Results 162 Selection of isolates 163
Six isolates of each species were selected to satisfy two criteria. Firstly, the 164
percentages growing logarithmically were 65, 65, 40 and 55 for M. haemolytica and 90, 75, 165
Version postprint
65 and 65 for P. multocida for MHB, calf serum, exudate and transudate, respectively. 166
Secondly, initial MIC studies using doubling dilutions indicated that the MIC for MHB was ≤ 167
0.4 µg/mL. It should be noted CLSI tables do not provide a separate breakpoint for 168
oxytetracycline, but CLSI provides a breakpoint for tetracycline (≤ 2 µg/mL), and indicates 169
that the breakpoint interpretation for tetracycline also applies to oxytetracycline. Therefore, 170
the oxytetracycline MICs were less than the tetracycline breakpoint. The six isolates of each 171
species selected comprised highest, lowest and four with intermediate MICs. 172
173
Minimum inhibitory and minimum bactericidal concentrations 174
MICs of the 12 selected isolates were re-determined separately in MHB and serum. 175
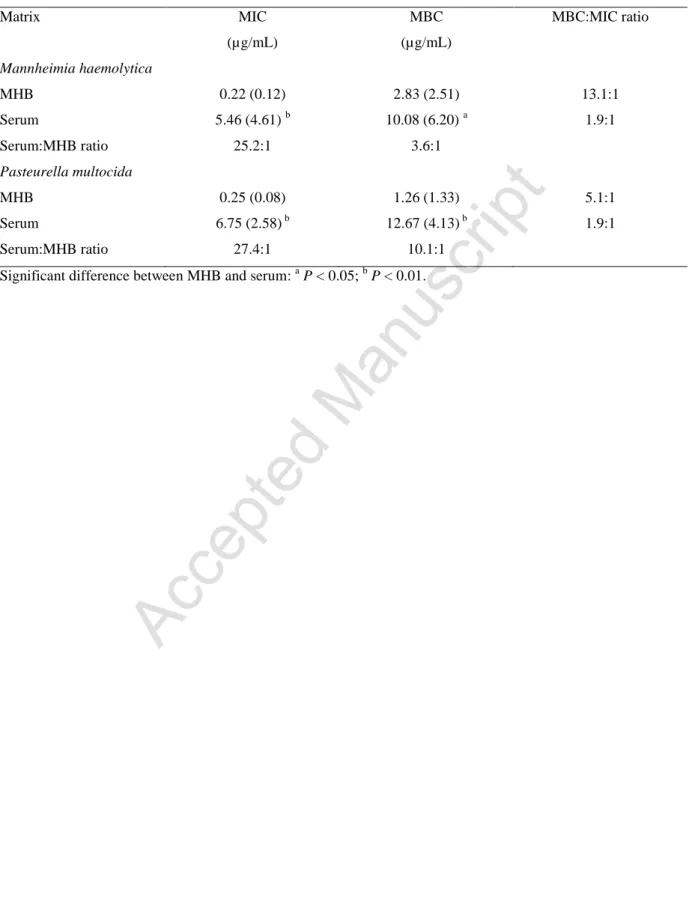
MICs and MBCs are illustrated in Fig. 1. Table 1 presents geometric mean MICs and MBCs, 176
and ratios MBC:MIC. The potency of oxytetracycline, expressed as MIC, was 25.2 times 177
greater in MHB for M. haemolytica and 27.4 times greater in MHB for P. multocida, 178
compared to serum MICs. Therefore, potency differed markedly between the two growth 179
matrices. Using MBC as the indicator of potency indicated smaller differences than for MIC, 180
but again in favour of MHB. 181
182
Time-kill curves 183
Starting inoculum counts of the order of 107 CFU/mL were selected to reflect a 184
moderate to high bacterial load in clinical subjects (Roof, 2011). Despite marked differences 185
in MICs between MHB and serum, growth inhibition curves in these matrices using multiples 186
of MIC were broadly similar for M. haemolytica (Fig. 2). However, reductions in count were 187
smaller in serum than in MHB at MIC multiples of 2.0 and 4.0. With both matrices, some re-188
growth occurred at 24 h. The in vitro killing pattern was classified as co-dependent (on both 189
concentration and time). For P. multocida in MHB, MIC multiples of 2.0 and 4.0 produced 190
Version postprint
virtual eradication by 24 h (Fig. 3). In serum, the killing action at 24 h was less marked at 2x 191
and 4x MIC than in MHB, with some re-growth occurring. The in vitro killing action was 192
judged to be co-dependent for both matrices (Fig. 3). Ex vivo time-kill curves are shown in 193
Appendix B. 194
195
Binding to serum protein 196
Oxytetracycline binding to protein was established for a range of seven in vivo 197
concentrations (0.43 to 2.07 µg/mL) in pooled serum samples. Mean percentage protein 198
binding ± SD was 52.4 ± 7.3 and was independent of total concentration. 199
200
Discussion
201
Many previous studies have shown that, for some drugs of the macrolide/triamilide 202
groups, MICs determined in serum are much higher than those determined using the broths 203
recommended in CLSI and EUCAST guidelines. An example is tulathromycin; for this drug 204
Toutain et al. (2016) reported MICs some 50 times lower in bovine serum than in broths for 205
M. haemolytica and P. multocida of bovine origin. When serum values were corrected for 206
drug binding to serum protein, differences were even greater; causes have not been positively 207
determined. In contrast, in this study the ‘serum effect’ was reversed; MICs were higher in 208
broth than in serum.Toutain et al. (2016) showed clearly that accuracy of MIC determination, 209
to be used in dose prediction, can be obtained from the approved broth MIC data by applying 210
a robust scaling factor to bridge in vitro MHB to in vivo relevant serum/plasma/blood values. 211
Oxytetracycline MICs were reported against a single bovine isolate of M. haemolytica (A1 212
76/1), in five matrices (Brentnall et al., 2012, 2013); values (µg/mL) were 0.5 (MHB), 0.8 213
(cation adjusted MHB), 14.8 (serum), 12.8 (exudate) and 11.2 (transudate). Therefore, MIC 214
differed markedly between three biological fluids on the one hand and two artificial media on 215
Version postprint
the other, whilst similar values were obtained for the two artificial matrices and similar values 216
were obtained for the three biological fluids. 217
218
These findings were confirmed and extended to demonstrate: (1) much higher MICs of 219
oxytetracycline in serum compared to MHB for M. haemolytica and P. multocida; (2) higher 220
oxytetracycline MBCs in serum compared to MHB, but with lower serum:MHB ratios for 221
MBC than for MIC. This study also quantified inter- and intra-species differences in 222
variability for six isolates of each species; coefficient of variation (CV%) serum values for M. 223
haemolytica were 84 (MIC) and 62 (MBC). Corresponding CV%s for P. multocida were 224
lower (38 MIC; 33 MBC). Considering the serum MIC values reported in this study, and 225
species and isolate variability, it is important for future studies to recognise that we used 226
bovine serum from a single source. Breed, age, sex, disease state, country and other factors 227
might provide MIC differences between sera, even from a single species. Such differences 228
should be quantified. However, this paper had a more limited immediate goal, to compare 229
broth with serum from the target species derived from one source only. 230
231
The cause(s) of serum/MHB differences in MIC for oxytetracycline have not been 232
established. In a recent study, albumin concentrations in MHB and calf serum were 0.033 and 233
32.2 g/L, thus differing by approximately 1,000-fold (Brentnall et al., 2012). Most serum 234
protein binding occurs to albumin and it is very likely that total and free concentrations of 235
oxytetracycline in MHB were identical. Therefore, approximately two-fold higher MIC values 236
in serum compared to MHB would be anticipated from the binding of oxytetracycline to 237
serum protein, which was shown to be 52.4% of total concentration. This confirms the 50% 238
binding described by Pilloud (1973) and is intermediate between 18.6% (Ziv and Sulman, 239
1972) and 72% (Nouws et al., 1985) described for cattle by other authors. Cause(s) of 240
Version postprint
differing degrees of protein binding in these studies are not known, but it should be noted that 241
the degree of binding has an impact on dosages required to achieve a given level of efficacy. 242
The prediction of approximately two-fold higher MICs in serum in the present study arises 243
because protein bound AMDs are microbiologically inactive (Wise, 1986; Zeitlinger et al., 244
2004). This relatively small (two-fold) predicted difference is well short of the 25- to 27-fold 245
experimentally determined differences in MIC between MHB and serum for M. haemolytica 246
and P. multocida, respectively. 247
248
In quantitative terms, for P. multocida, correction for protein binding yields a mean 249
fraction unbound (fu) serum MIC of 3.21 µg/mL, whilst broth MIC was 0.25 µg/mL; thus, the 250
mean fu serum MIC is 12.9-fold greater than the broth MIC, which is the CLSI and EUCAST 251
and therefore universally accepted standard. For M. haemolytica, the fu serum MIC was 11.8 252
times greater than broth MIC. The data indicate inhibition of the killing action of 253
oxytetracycline by some serum factor(s). The data demonstrate antagonism of the action of 254
oxytetracycline beyond what can be ascribed to non-specific protein binding. 255
256
The nature of the inhibition requires further consideration. In addition to albumin 257
content, other differences in composition between MHB and calf serum include higher 258
globulin, sodium, chloride, potassium, calcium and magnesium concentrations (Brentnall et 259
al., 2012). Since oxytetracycline can bind covalently to calcium and magnesium ions, this 260
might theoretically explain the serum/broth MIC and MBC differences. However, Luthman 261
and Jacobsson (1983) reported that oxytetracycline did not chelate with calcium ions in calf 262
serum. Moreover, the MIC difference between MHB and cation adjusted MHB reported by 263
Brentnall et al. (2012) was slight (0.5 and 0.8 µg/mL, respectively). Therefore, the cause(s) of 264
Version postprint
the marked differences in MIC between MHB and cation adjusted MHB on the one hand and 265
calf serum on the other require alternative explanations and further study. 266
267
Honeyman et al. (2015) compared MICs of several tetracyclines in broth and 50% 268
broth:50% mouse serum as matrices. For a strain of Streptococcus pneumoniae, MICs were 269
identical for six compounds but, with added serum, 2-4 fold increases were obtained for five, 270
whilst MIC was increased 32-fold for one compound. In contrast, for a strain of 271
Staphylococcus aureus, MIC was increased in the broth:serum combined matrix relative to 272
broth for all 12 compounds investigated and, for seven, the increase was in the range 8- to 273
128-fold. 274
275
The PDs of oxytetracycline was further investigated in time-kill studies. Using 276
multiples of up to 4x MIC indicated a probable co-dependent killing mechanism that is 277
dependency on both concentration and time. However, confirming the type of killing action 278
would benefit from further studies using higher multiples of MIC than the five used in this 279
study. 280
281
These data suggest that serum, exudate and transudate may be useful alternatives to 282
broth for potency determination, when the objective is estimation of a dose for clinical use, 283
based on PK/PD modelling approaches. These biological fluids are not identical to pulmonary 284
epithelial lining fluid, but are much closer in composition to the latter than artificial broths. 285
Further refinement of the methodology used in this study would be to determine potency in 286
serum in the presence of other ‘natural’ constituents, such as leucocytes and antibodies, as 287
well as the normal bacterial flora that compete with pathogens. Ideally, although technically 288
difficult, it would also be relevant to determine potency in pulmonary epithelial ling fluid. 289
Version postprint
290
Despite these considerations, in immunocompetent animals with pneumonic 291
infections, even the limited direct killing activity in serum demonstrated in this study might 292
contribute to efficacy, particularly in those cases with mild infection, treated early, in which 293
biophase bacterial counts would normally be low. Epidemiological data on oxytetracycline 294
MICs have indicated a bimodal distribution (Yoshimura et al., 2001). Even allowing for these 295
MICs, measured conventionally in an artificial growth matrix, some 40-50% of isolates had 296
MICs of 8.0 or 16.0 µg/mL for calf strains of M. haemolytica and P. multocida. On the other 297
hand, 30 to 40% of isolates had broth MICs of 0.50 µg/mL; the equivalent serum MIC, from 298
the present data, would be of the order of 12.5 µg/mL, which is approximately two to three 299
times higher than maximum serum concentrations of oxytetracycline achieved in calves with 300
the recommended dose rate of 20 mg/kg (Nouws and Vree, 1983; Toutain and Raynaud, 301
1983; Nouws et al., 1990; Brentnall et al., 2013).Alternative mechanisms of action of 302
oxytetracycline are shown in Appendix C. 303
304
Conclusions
305
Concentrations of oxytetracycline in serum and broth were not measured at the start 306
and completion of the in vitro studies; it is possible that reported differences between the 307
media might have been due, in part, to some degradation of the drug, but at differing rates 308
over the 24 h incubation periods. Differing bacterial growth rates in the two media are 309
possible, even likely, and this could contribute to the reported differences. Time-kill studies 310
were based on fixed concentrations for a pre-defined time period. In vivo, concentrations in 311
serum and the biophase first increase and then decrease after systemic, non-vascular dosing. 312
Therefore, in vitro time-kill methods, such as hollow fibre models, better reflect the 313
circumstances of clinical exposure and could be used in future studies. 314
Version postprint
315
Conflict of interest statement
316
None of the authors of this paper have a financial or personal relationship with other 317
people or organisation that could inappropriately influence or bias the content of the paper. In 318
the last 5 years, P. Lees has supplied consultancy advice to Bayer Animal Health, Norbrook 319
Laboratories and Pfizer Animal Health, J. Illambas was formerly employed by Zoetis Animal 320
Health and L. Pelligand provided consultancy advice to VetCare, Orion, Zoetis, Waltham and 321
Ceva, as well as receiving research funding from Pfizer Animal Health, Novartis Animal 322
Health, Transpharmation and deltaDot, and P.L. Toutain provided consultancy advice to 323
Novartis Animal Health. 324
325
Acknowledgements
326
This study was supported by a grant from the Department for the Environment, Food 327
and Rural Affairs (DEFRA). Oxytetracycline was supplied by Norbrook Laboratories. 328
329
Appendix: Supplementary Material
330
Supplementary data associated with this article can be found, in the online version, at 331 doi: … 332 333 References 334
Aliabadi, F.S., Lees, P., 2001. Pharmacokinetics and pharmacodynamics of danofloxacin in 335
serum and tissue fluids of goats following intravenous and intramuscular 336
administration. American Journal of Veterinary Research 62, 1979-1989. 337
338
Aliabadi, F.S., Lees, P., 2002. Pharmacokinetics and pharmacokinetic/pharmacodynamic 339
integration of marbofloxacin in calf serum, exudate and transudate. Journal of 340
Veterinary Pharmacology and Therapeutics 25, 161-174. 341
Version postprint
Brentnall, C., Cheng, Z., McKellar, Q.A., Lees, P., 2012. Pharmacodynamics of 343
oxytetracycline administered alone and in combination with carprofen in calves. 344
Veterinary Record 171, 273. 345
346
Brentnall, C., Cheng, Z., McKellar, Q.A., Lees, P., 2013. Pharmacokinetic-pharmacodynamic 347
integration and modelling of oxytetracycline administered alone and in combination 348
with carprofen in calves. Research in Veterinary Science 94, 687-694. 349
350
CLSI, 2008. Performance Standards for Antimicrobial Disk and Dilution Susceptibility Tests 351
for Bacteria Isolated from Animals: Approved Standard - 3rd Edn. CLSI document 352
M31-A3. 353
354
Davey, L.A., Ferber, M.T., Kaye, B., 1985. Comparison of the serum pharmacokinetics of a 355
long acting and a conventional oxytetracycline injection. Veterinary Record 117, 426-356
429. 357
358
Esaki, H., Asai, T., Kojima, A., Ishihara, K., Morioka, A., Tamura, Y., Takahashi, T., 2005. 359
Antimicrobial susceptibility of Mannheimia haemolytica isolates from cattle in Japan 360
from 2001 to 2002. Journal of Veterinary Medical Sciences 67, 75-77. 361
362
Honeyman, L., Ismail, M., Nelson, M.L., Bhatia, B., Bowser, T.E., Chen, J., Mechiche, R., 363
Ohemeng, K., Verma, A.K., Cannon, E.P., Macone, A., Tanaka, S.K., Levy, S., 2015. 364
Structure-activity relationship of the aminomethylcyclines and the discovery of 365
omadacycline. Antimicrobial Agents and Chemotherapy 59, 7044-7053. 366
367
Lees, P., Pelligand, L., Illambas, J., Potter, T., Lacroix, M., Rycroft, A., Toutain, P.L., 2015. 368
Pharmacokinetic/pharmacodynamic integration and modelling of amoxicillin for the 369
calf pathogens Mannheimia haemolytica and Pasteurella multocida. Journal of 370
Veterinary Pharmacology and Therapeutics 38, 457-470. 371
372
Luthman, J., Jacobsson, S.O., 1983. The availability of tetracyclines in calves. Nordisk 373
Veterinaermedicin 35, 292-299. 374
375
Nouws, J.F., Breukink, H.J., Binkhorst, G.J., Lohuis, J., van Lith, P., Mevius, D.J., Vree, 376
T.B., 1985. Comparative pharmacokinetics and bioavailability of eight parenteral 377
oxytetracycline-10% formulations in dairy cows. Veterinary Quarterly 7, 306-314. 378
379
Nouws, J.F., Smulders, A., Rappalini, M., 1990. A comparative study on irritation and residue 380
aspects of five oxytetracycline formulations administered intramuscularly to calves, 381
pigs and sheep. Veterinary Quarterly 12, 129-138. 382
383
Nouws, J.F., Vree, T.B., 1983. Effect of injection site on the bioavailability of an 384
oxytetracycline formulation in ruminant calves. Veterinary Quarterly 5, 165-170. 385
386
Pilloud, M., 1973. Pharmacokinetics, plasma protein binding and dosage of oxytetracycline in 387
cattle and horses. Research in Veterinary Science 15, 224-230. 388
389
Roof, C., 2011. Qualification and quantification of bacterial pathogen load in acute bovine 390
respiratory disease cases. Masters Thesis, Kansas State University, Manhattan, 391
Kansas, USA. 392
Version postprint
393
Sidhu, P., Shojaee Aliabadi, F., Andrews, M., Lees, P., 2003. Tissue chamber model of acute 394
inflammation in farm animal species. Research in Veterinary Science 74, 67-77. 395
396
Sidhu, P.K., Landoni, M.F., Aliabadi, F.S., Lees, P., 2010. Pharmacokinetic and 397
pharmacodynamic modelling of marbofloxacin administered alone and in combination 398
with tolfenamic acid in goats. The Veterinary Journal 184, 219-229. 399
400
Toutain, P.L., Raynaud, J.P., 1983. Pharmacokinetics of oxytetracycline in young cattle: 401
Comparison of conventional vs long-acting formulations. American Journal of 402
Veterinary Research 44, 1203-1209. 403
404
Toutain, P.-L., Potter, T., Pelligand, L., Lacroix, M., Illambas, J., Lees, P., 2016. Standard 405
PK/PD concepts can be applied to determine a dosage regimen for a macrolide: The 406
case of tulathromycin in the calf. Journal of Veterinary Pharmacology and 407
Therapeutics doi: 10.1111/jvp.12333. 408
409
Wise, R., 1986. The clinical relevance of protein binding and tissue concentrations in 410
antimicrobial therapy. Clinical Pharmacokinetics 11, 470-482. 411
412
Yoshimura, H., Ishimaru, M., Endoh, Y.S., Kojima, A., 2001. Antimicrobial susceptibility of 413
Pasteurella multocida isolated from cattle and pigs. Journal of Veterinary Medicine B 414
Infectious Disease Veterinary Public Health 48, 555-560. 415
416
Zeitlinger, M.A., Sauermann, R., Traunmuller, F., Georgopoulos, A., Muller, M., Joukhadar, 417
C., 2004. Impact of plasma protein binding on antimicrobial activity using time-killing 418
curves. Journal of Antimicrobial Chemotherapy 54, 876-880. 419
420
Ziv, G., Sulman, F.G., 1972. Binding of antibiotics to bovine and ovine serum. Antimicrobial 421
Agents and Chemotherapy 2, 206-213. 422
Version postprint
Figure legends
423 424
Fig. 1. Minimum inhibitory concentrations (MICs) and minimum bactericidal concentrations 425
(MBCs) for oxytetracycline against 12 isolates (first six, left to right Mannheimia 426
haemolytica; second six, left to right Pasteurella multocida) in Mueller Hinton broth (MHB) 427
and bovine serum. Note the differing ordinate scales. 428
429
Fig. 2. In vitro inhibition of growth of Mannheimia haemolytica over 24 h exposure to five 430
multiples (0.25 to 4.0) of minimum inhibitory concentration (MIC), measured in either 431
Mueller Hinton broth (MHB) or serum, for oxytetracycline: (a) MHB and (b) serum (mean for 432
six isolates in each matrix). Standard error of the mean (SEM) bars not included for clarity. 433
Dotted line indicates limit of quantification (33 colony forming units, CFU/mL). 434
435
Fig 3. In vitro inhibition of growth of Pasteurella multocida over 24 h exposure to five 436
minimum inhibitory concentrations (MIC) multiples (0.25 to 4.0) of oxytetracycline, 437
measured in either Mueller Hinton broth (MHB) or serum: (a) MHB and (b) serum (mean for 438
six isolates in each matrix). Standard error of the mean (SEM) bars not included for clarity. 439
Dotted line indicates limit of quantification (33 colony forming units, CFU/mL). 440
441 442 443 444
Version postprint
Table 1. Oxytetracycline geometric mean standard deviation (SD) minimum inhibitory
445
concentrations (MICs) and minimum bactericidal concentrations (MBCs) measured in 446
Mueller Hinton broth (MHB) and serum, along with MIC:MBC and MHB:serum ratios (n = 447 6). 448 Matrix MIC (µg/mL) MBC (µg/mL) MBC:MIC ratio Mannheimia haemolytica MHB Serum Serum:MHB ratio 0.22 (0.12) 5.46 (4.61) b 25.2:1 2.83 (2.51) 10.08 (6.20) a 3.6:1 13.1:1 1.9:1 Pasteurella multocida MHB Serum Serum:MHB ratio 0.25 (0.08) 6.75 (2.58) b 27.4:1 1.26 (1.33) 12.67 (4.13) b 10.1:1 5.1:1 1.9:1
Significant difference between MHB and serum: a P < 0.05; b P < 0.01.
449 450 451 452
Version postprint Figure 1. 453 454 2059 2653 2008 1250 1978 1056 3959 4121 3722 4323 4096 4072 0.0 0.1 0.2 0.3 0.4 0.5 2 4 6 8 10 12 14 16 18 MICMBC
Broth
M
IC
(
g
/m
L
)
455 2059 2653 2008 1250 1978 1056 3959 4121 3722 4323 4096 4072 0 2 4 6 8 10 12 14 16 18 MICMBCSerum
M
IC
(
g
/m
L
)
456 457 458Version postprint Figure 2. 459 460 461 462 463 464 465 0 4 8 12 16 20 24 101 102 103 104 105 106 107 108 109 101 0 0 0.25 0.5 1 2 4 LOD
Oxytetracycline in MHB for M.haemolytica
a
Time (h)CF
U/
m
L
0 4 8 12 16 20 24 101 102 103 104 105 106 107 108 109 101 0 0 0.25 0.5 1 2 4 LODOxytetracycline in Serum for M.haemolytica
Time (h)
CF
U/
m
L
b
Version postprint Figure 3. 466 467 468 469 470 0 4 8 12 16 20 24 101 102 103 104 105 106 107 108 109 101 0
0
0.25
0.5
1
2
4
LOD
Oxytetracycline in MHB for P.multocida
Time (h)
CF
U/
m
L
a
0 4 8 12 16 20 24 101 102 103 104 105 106 107 108 109 101 00
0.25
0.5
1
2
4
LOD
Oxytetracycline in Serum for P.multocida