HAL Id: hal-01244677
https://hal.archives-ouvertes.fr/hal-01244677
Submitted on 16 Dec 2015HAL is a multi-disciplinary open access archive for the deposit and dissemination of sci-entific research documents, whether they are pub-lished or not. The documents may come from teaching and research institutions in France or abroad, or from public or private research centers.
L’archive ouverte pluridisciplinaire HAL, est destinée au dépôt et à la diffusion de documents scientifiques de niveau recherche, publiés ou non, émanant des établissements d’enseignement et de recherche français ou étrangers, des laboratoires publics ou privés.
Regional scale rain-forest height mapping using
regression-kriging of spaceborneand airborne lidar data:
application on French Guiana
I. Fayad, N. Baghdadi, Jean-Stéphane Bailly, N. Barbier, V. Gond, B.
Hérault, Mohammad El Hajj, J. Lochard, José Perrin
To cite this version:
I. Fayad, N. Baghdadi, Jean-Stéphane Bailly, N. Barbier, V. Gond, et al.. Regional scale rain-forest height mapping using regression-kriging of spaceborneand airborne lidar data: application on French Guiana. IGARSS 2015, Jul 2015, Milan, Italy. pp.4109-4112, �10.1109/IGARSS.2015.7326729�. �hal-01244677�
REGIONAL SCALE RAIN-FOREST HEIGHT MAPPING USING REGRESSION-KRIGING OF SPACEBORNE AND AIRBORNE LIDAR DATA: APPLICATION ON FRENCH GUIANA
I. Fayad1, N. Baghdadi1, J.S. Bailly2, N. Barbier3, V. Gond4, B. Hérault5, M. El Hajj6, J. Lochard7 and J. Perrin8 1
IRSTEA, UMR TETIS, 500 rue Jean François Breton, 34093 Montpellier cedex 5, France
2
AgroParisTech, UMR LISAH, 2 place Pierre Viala, 34060 Montpellier, France
3
IRD, UMP AMAP, 2050 boulevard de la Lironde, 34000 Montpellier, France
4
CIRAD, UPR B&SEF, campus de Baillarguet, 34398 Montpellier Cedex 5, France
5
INRA, UMR EcoFoG, BP 316 – 97379, Kourou cedex, French Guiana
6
NOVELTIS, 153 rue du Lac, 31670 Labège, France
7
Airbus Defense and Space, 31 rue des Cosmonautes Z.I. du Palays, 31402 Toulouse, France
8
BRGM, 3 avenue Claude Guillemin, 45060 Orléans, France
ABSTRACT
LiDAR remote sensing has been shown to be a good technique for the estimation of forest parameters such as canopy heights and aboveground biomass. Whilst airborne LiDAR data are in general very dense but only available over small areas due to the cost of their acquisition, spaceborne LiDAR data acquired from the Geoscience Laser Altimeter System (GLAS) have a coarser acquisition density associated with a global cover. It is therefore valuable to analyze the integration relevance of canopy heights estimated from LiDAR sensors with ancillary data such as geological, meteorological, and phenological variables in order to propose a forest canopy height map with good precision and high spatial resolution.
In this study, canopy heights extracted from both airborne and spaceborne LiDAR, were first extrapolated from available environmental data. The estimated canopy height maps using random forest (RF) regression from the airborne or GLAS calibration datasets showed similar precisions (RMSE better than 6.5 m). In order to improve the precision of the canopy height estimates regression-kriging (kriging of RF regression residuals) was used. Results indicated an improvement in the RMSE (decrease from 6.5 to 4.2 m) for the regression-kriging maps from the GLAS dataset, and from 5.8 to 1.8 m for the regression-kriging map from the airborne LiDAR dataset.
Index Terms— Forest heights, LiDAR, ICESat/GLAS, Random Forests, Regression-Kriging
1. INTRODUCTION
Global warming and climate change attract significant attention in the quantification of the standing above ground biomass (AGB) over the last few decades. Not only to understand its effects on the global carbon cycle but to mitigate the effects of the global warming via the conservation of carbon sinks. Currently, existing AGB estimation methods from remote sensing data are either limited in terms of their sensitivity to high AGB levels (sensor saturation at certain biomass levels using mainly radar and optical data) or in terms of their spatial coverage (limited horizontal coverage using LiDAR data).
Within such constraints, most research studies focuses on allometric relations for linking the characteristics of a forest (tree height, diameter at breast height, wood density) to its biomass (e.g. [1-3]), either at the tree level, or the plot level (plot aggregate allometries). However, one of the important variables in the allometric relations which can be estimated from remote sensing techniques is the tree height. Several allometries relied on only the canopy height for biomass estimation (e.g. [1]; [3]). In addition, studies have shown that the use of canopy height increases the precision of the biomass estimation (e.g. [2]; [4]). Currently the best technique for canopy height estimation using remote sensing is based on the use of LiDAR technology. Many studies used airborne or spaceborne LiDAR for the estimation of forest canopy heights (e.g. [5-10]). While canopy height estimation using airborne LiDAR data can be very precise
(RMSE better than 2 m, [11]), spaceborne LiDAR has a lower precision on the canopy height estimation ranging between 2 m and 10 m depending on the characteristics of the forest (e.g. [6]; [9-10]; [12-14]). However, airborne LiDAR is limited in the horizontal domain (limited spatial coverage for airborne data and limited acquisition density for satellite data) whereas spaceborne LiDAR provides global coverage of waveform data, but with a relatively low point density (about 0.51 points/km2 over French Guiana for example) and inhomogeneous spatial sampling (sampling lines along satellite tracks). Therefore, merging LiDAR data (spaceborne or/and airborne) with other data source is essenatial in order to create forest canopy heights with complete land coverage and a good precision (e.g. [9]; [15-16]).
In the present study, airborne and spaceborne LiDAR canopy height estimates in combination to ancillary data were used to create a canopy height map at a 250 m resolution covering the entire French Guiana. The LiDAR canopy height datasets used were airborne LiDAR canopy height estimates covering 4/5 of French Guiana, as well as canopy height estimates from the ICESat/GLAS satellite waveforms. For the ancillary datasets, globally available datasets of vegetation indices, precipitation, topography, geological, and forest landscape types were selected. In addition, as evidenced by [15] on the correlation between the sampling strategy and the precision on the canopy heights, the effects of the reference canopy height estimate datasets spatial sampling on the canopy height maps created in this study were analyzed. Finally, all the created maps were validated using a unique and independent dataset of airborne LiDAR canopy heights estimates.
2. STUDY AREA AND DATASETS
Study Site
French Guiana is located on the northern coast of the South American continent (Figure 1). The study site features almost 96% forested areas of its total area of 83,534 km2. The forest is mostly old growth rainforest and vegetation types are of natural or anthropogenic origin (forests, swamps, savannas and agricultural crops). French Guiana’s terrain is mostly low lying rising occasionally to small hills and low latitude mountains. Altitude range between 0 and 851 m and 67.8% of the slopes are below 5o.
Datasets
The methodology in this study is based on the merging of LiDAR canopy height estimates (airborne (LD) and spaceborne) with ancillary data. The spaceborne LiDAR dataset corresponds to data acquired by the GLAS sensor with a density of 0.51 points/km². The canopy heights produced from this dataset showed a precision of 3.6 m [17]. The airborne LiDAR data (LD) corresponds to data acquired in 1996 over almost 80% of the total study area with a point density of 1.19 points/km² and a precision on the canopy height estimates of about 1.5 m in comparison to a high density LiDAR dataset (HD) [17]. Finally, the ancillary maps are a geological map (GEO), a forest landscape type map (LT), maps derived from the shuttle topography mission (SRTM) data (slope, terrain surface roughness (Rug), and drain map (ln_drain)), mean rainfall map from the past 10 years derived from data provided by the NASA tropical rainfall measuring mission (Rain), and three maps derived from Enhanced vegetation index (EVI). These maps represent the minimum EVI value from the last 10 years (EVI_MIN), the average EVI value (EVI_AVG), and the maximum EVI value (EVI_MAX).
(a) (b)
Figure 1: Location of study site (French Guiana), with (a)
the canopy heights estimated from the GLAS dataset (in m), and (b) canopy heights calculated from the airborne LiDAR LD dataset and the locations of airborne LiDAR HD datasets (delineated with circles).
3. METHODOLOGY AND RESULTS To create the canopy height maps, the predictor variables (ancillary data) that best explained the canopy heights were firstly chosen. Two reference LiDAR canopy height datasets were tested separately: the GLAS dataset, and the airborne dataset (LD). Results showed that the variables that explained best the canopy heights were the same for all the canopy height reference datasets. The variables are as follows: The terrain roughness, the mean value of the EVI time
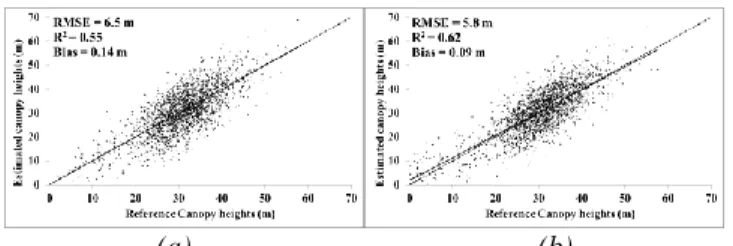
series data, the geological map, the mean value of rainfall, and the terrain slope. Next, the RF regression technique was used to model the canopy height estimates using the most relevant predictor variables. A RF regression model was developed for each LiDAR dataset in order to create wall to wall maps over French Guiana. Results showed that all the wall-to-wall canopy height maps presented similar precisions regardless of the reference canopy heights used (Figure 2, RMSE about 6 m).
(a) (b)
Figure 2: Comparison between the reference canopy heights
of the validation datasets and the canopy height estimates using RF regressions: (a) GLAS dataset; (b) LD dataset. In order to improve the precision of the obtained canopy height maps, the height residuals (reference canopy heights – estimated canopy heights) obtained from each reference LiDAR dataset were kriged. Then each kriged height residual map was added to its corresponding canopy height map obtained from the RF regression model. Results showed an improvement in the precision of the canopy height maps. However, this improvement in the precision varied between the canopy height map using the height residuals from GLAS only (RMSE=4.2 m with regression-kriging, Figure 3) and the one obtained using the airborne dataset (RMSE=1.8 m with regression-kriging, Figure 3). This difference in precision between the GLAS and LD datasets is due to the point density, and the data point spacing of each dataset.
(a) (b)
Figure 3: Comparison between the reference canopy
heights of the validation datasets and the canopy height estimates using regression-kriging: (a) GLAS dataset; (b) LD dataset. Bias = reference canopy heights - estimated canopy heights.
4. CONCLUSIONS
An approach for canopy heights mapping over the tropical forest of French Guiana was presented. It is based on the merging of LiDAR canopy height estimates (airborne and spaceborne) with ancillary data. To create the canopy height maps, the predictor variables (ancillary variables) that best explained the canopy heights were firstly chosen. The best predictor variables happened to be the same for all the canopy height datasets: The roughness, the mean value of the EVI time series data, the geology, the mean value of the annual rainfall, and the terrain slope. RF regressions, which was used to fit the best predictors to the LiDAR canopy height datasets showed moderate canopy height estimation precision when using either airborne or spaceborne LiDAR (RMSE better than 6 m).
To improve the precision of the obtained canopy height maps, regression-kriging (RK) was used. The height residuals (reference canopy heights – estimated canopy heights by RF) obtained from each reference LiDAR dataset were kriged and added to the canopy height estimates obtained from RF regressions. An improvement in the precision of the canopy height maps was observed, however, this improvement is positively correlated to the point density of the calibration datasets used. For the GLAS dataset which has a flight line spacing of 30 km, the RMSE on the canopy height estimates was improved to 4.2 m, however, for LD dataset, which has a 0.5 km flight line spacing, the RMSE on canopy height estimates was improved to 1.8 m.
5. ACKNOWLEDGEMENTS
The authors wish to thank the French Space Study Center (CNES, DAR 2014 TOSCA) for supporting this research. The authors acknowledge the National Snow and Ice Data Center (NSDIC) for the distribution of the ICESat/GLAS data. The authors also acknowledge the French Geological Survey (BRGM) and, in particular, José Perrin for providing the low-density LiDAR dataset. The authors wish to thank Lilian Blanc (Cirad) and Grégoire Vincent (IRD) for providing the high-density LiDAR dataset. We extend our thanks for Noveltis and Airbus defense and space for their financial support.
6. REFERENCES
[1] J. B. Drake, K. Robert G., D. Ralph O., C. David B., C. Richard, B. J. Bryan and H. Michelle,
"Above‐ground biomass estimation in closed canopy neotropical forests using lidar remote sensing: Factors affecting the generality of relationships," Global Ecology and Biogeography, vol. 12, pp. 147-159, 2003.
[2] J. Chave, C. Andalo, S. Brown, M. A. Cairns, J. Q. Chambers, D. Eamus and H. Fölster, "Tree allometry and improved estimation of carbon stocks and balance in tropical forests,"
Oecologia, vol. 145, pp. 87-99, 2005.
[3] G. P. Asner and J. Mascaro, "Mapping tropical forest carbon: Calibrating plot estimates to a simple LiDAR metric," Remote Sensing of Environment, vol. 140, pp. 614-624, 2014.
[4] T. R. Feldpaush, J. Lloyd, S. L. Lewis, R. J. W. Brienen, M. Gloor and et al., "Tree height integrated into pantropical forest biomass estimates," Biogeosciences, vol. 9, pp. 3381-3403, 2012.
[5] E. T. A. Mitchard, S. S. Saatchi, L. J. T. White, K. A. Abernethy, K. J. Jeffery, S. L. Lewis and M. Collins, "Mapping tropical forest biomass with radar and spaceborne LiDAR in Lopé National Park, Gabon: overcoming problems of high biomass and persistent cloud," Biogeosciences, vol. 9, pp. 179-191, 2012.
[6] M. A. Lefsky, H. David J., K. Michael, C. Warren B., C. Claudia C., E.-S. Fernando Del Bom, H. Maria O. and d. O. Raimundo, "Estimates of forest canopy height and aboveground biomass using ICESat," Geophysical Research Letters, vol. 32, p. L22S02, 2005.
[7] J. Boudreau, N. Ross F., M. Hank A., B. André, G. Luc and K. Daniel S., "Regional aboveground forest biomass using airborne and spaceborne LiDAR in Québec," Remote Sensing of Environment , vol. 112, pp. 3876-3890, 2008.
[8] S. S. Saatchi, H. Nancy L., B. Sandra, L. Michael, M. Edward TA, S. William and Z. Brian R., "Benchmark map of forest carbon stocks in tropical regions across three continents,"
Proceedings of the National Academy of Sciences, vol. 108, pp. 9899-9904, 2011.
[9] M. Simard, P. Naiara, F. J. B and B. Alessandro, "Mapping forest canopy height globally with spaceborne lidar," Journal Of Geophysical
Research, vol. 116, p. G04021, 2011.
[10] N. Baghdadi, G. le Maire, I. Fayad, J. S. Bailly, Y. Nouvellon, C. Lemos and R. Hakamada, "Testing different methods of forest height and aboveground biomass estimations from ICESat/GLAS data in Eucalyptus plantations in Brazil," IEEE (JSTARS), vol. 7, pp. 290-299,
2014.
[11] E. Næsset, "Predicting forest stand charactersitics with airborne scanning laser using a practical two-stage procedure and field data," Remote Sens.
Environ., vol. 80, pp. 88-99, 2002.
[12] S. Lee, W. Ni-Meister, W. Yang and Q. Chen, "Physically based vertical vegetation structure retrieval from ICESat data: Validation using LVIS in White Mountain National Forest, New Hampshire, USA," Remote Sensing of Environment, vol. 115, pp. 2776-2785, 2011.
[13] C. Hilbert and C. Schmullius, "Influence of surface topography on ICESat/GLAS forest height estimation and waveform shape," Remote
Sensing , vol. 4, pp. 2210-2235, 2012.
[14] Y. Pang, L. Michael, A. Hans-Erik, M. Mary Ellen and S. Kirk, "Validation of the ICEsat vegetation product using crown-area-weighted mean height derived using crown delineation with discrete return lidar data," Canadian journal of remote
sensing , vol. 34, pp. S471-S484, 2008.
[15] A. Hudak, M. Lefsky, W. B. Cohen and M. Berterretche, "Integration of lidar and Landsat ETM+ data for estimating and mapping forest canopy height," Remote Sens. Environ., vol. 82, pp. 397-416, 2002.
[16] M. A. Lefsky, "A global forest canopy height map from the moderate resolution imaging spectroradiometer and the geoscience laser altimeter system," Geophys. Res. Lett., vol. 37, p. L15401, 2010.
[17] I. Fayad, N. Baghdadi, J.-S. Bailly, N. Barbier, V. Gond, M. El Hajj, F. Fabre and B. Bourgine, "Canopy Height Estimation in French Guiana with LiDAR ICESat/GLAS Data Using Principal Component Analysis and Random Forest Regressions," Remote Sens., vol. 6, 2014.