Comparison of Doses to Normal Brain in Patients Treated With Boron Neutron Capture
Therapy at Brookhaven National Laboratory and MIT
By
Julie Catherine Turcotte
B.S. Nuclear Engineering and Engineering Physics (2002) Rensselaer Polytechnic Institute
Submitted to the Department of Nuclear Engineering In Partial Fulfillment of the Requirements for the Degree of
Master of Science in Nuclear Engineering At the
Massachusetts Institute of Technology August 2004
© 2004 Massachusetts Institute of Technology All rights reserved
Signature of Author .
-Department of Nuclear Engineering August 2004
Certified by - L
Jeffrey A. Coderre Associate Professor of Nuclear Engineering And Rasmussen Professor of Nuclear Engineering Thesis Supervisor
Read by-
--Obj. Harling Professor of Nuclear Engineering
Thesis Reader
Accepted by
V.,
I Jeffrey A. CoderreChairman, Department Committee on Graduate Students
ARCHIVES MASSACHUSETTS INSTTUTE OF TECHNOLOGY 1- ' I , I OCT 112005 i
Comparison of Doses to Normal Brain in Patients Treated With Boron Neutron Capture
Therapy at Brookhaven National Laboratory and MIT
By
Julie Catherine Turcotte
Submitted to the Department of Nuclear Engineering
On July 31, 2004 in Partial Fulfillment of theRequirements for the Degree of Master of Science in
Nuclear Engineering
ABSTRACT
A number of boron neutron capture therapy (BNCT) clinical trials are currently underway around the world. Due to the small number of patients at each of the individual centers, it is desirable to pool the clinical data from each into one patient database. Before this can be done, a number of differences between the clinical centers must be evaluated. The patients treated at the BNCT centers at Brookhaven National Laboratory and that at Harvard-MIT will be evaluated as a start to the ultimate pooling of all the BNCT centers. One difference involves the difference between the normal tissue composition definition between the institutions. In particular, the difference in weight percent of 4N must be evaluated. This particular component of tissue is of importance due to the dose to tissue resulting from the 4N(n,p)l C reaction. The difference between the 1.8% '4N composition used at BNL and the 2.2% used at MIT has a negligible effect on the total
dose. Most importantly, differences in dosimetry techniques between the different
centers must be computed. Once these differences are quantified, the patients can be pooled, and a better estimate of the normal brain tolerance to BNCT can be determined. The thermal neutron doses calculated from thermal flux measurements are 8% lower when measured by MIT, the gamma dose measurements are 26% lower, and the in-air fast neutron measurements are 27% lower in the same beam. The endpoint used for the tolerance of normal brain to BNCT is somnolence syndrome. A 50% somnolence response can be seen at 5.5 Gy-Eq.Thesis Supervisor: Jeffrey A. Coderre
Title: Associate Professor of Nuclear Engineering and Rasmussen Professor of Nuclear
Engineering
Acknowledgements
First, I would like to thank my advisor, Dr. Jeffrey Coderre. With his patience and
guidance, I was able to conduct this research. Thanks also to Dr. Otto Harling who acted as my thesis reader. His advice and suggestions were integral to my success.Many thanks must also be extended to Ray Albritton. His immense knowledge of the
RTPE and SERA planning systems saved the day a number of times. The expertise of
Chuck Wemple and Jacek Capala was also essential in running RTPE, and my thanks go
out to them.Thanks to Dr. Peter Binns and Dr. Kent Riley at the MIT research reactor, and to Dr.
Stead Kiger at Beth Israel Deaconness Hospital in Boston for their input, experience, and
expertise on the topic of BNCT. Thanks also to Dr. John Hopewell in Cambridge,
England, for his help with the statistical dose response curves.
I would like to thank a few of my undergraduate professors at RPI, namely Drs. Yaron
Danon, Don Steiner, Bimal Malaviya, and George Xu. Without their guidance in the first
four years of my nuclear engineering education, I wouldn't be here today.
I would like to thank the other students in the lab here at MIT: Peter, Paige, Jingli, Brett, Mike, Ray, Yoonsun, Xuping, Rong, and Hongyu. Working with them has made being here much more enjoyable, and I'll miss you all when I leave here.
Lastly, I would like to thank my friends and family, without whose support I could never have done this.
Table of Contents
List of Tables ...
...
6
List of Figures .
...
7
I. Background 91. BNCT ...
9
2. BNCT Clinical Trials ...
...
10
3. Boron Compounds and Radiobiology .
.
...
15
4. BNCT Treatment Planning ...
...
...
..
....
...
17
5. BNCT Intercomparison ...
....
.
...
22
6. References
...
...
...
...
26
II. Methods and Materials
29
1. Dosimetry Phantoms ...
...
29
2. Dosimetry Methods .32....
...
...
32
a. MIT gamma and fast neutron doses ...
33
b. MIT thermal neutron flux ... ... 33
c. BNL gamma and fast neutron dose rates ... 34
d. BNL thermal neutron fluence rates ... 35
e. Routine BNL dosimetry measurements in the Lucite cube ...
35
3. References ... 38
III. Differences in 14N Concentration 39 References ... 47
IV. Comparison of Patient Dose Components in BNL Beam
48
1. Error Analysis of MIT and BNL Measurements ...
48
a. MIT measurement errors ... 50
b. BNL measurement errors ...
5...
51
c. Physical dose comparison ...
52
d. Weighted dose comparison ...
53
2. Phantom Evaluation ...
...
...
54
3. Thermal Neutron Dose ...
...
56
4. Gamma Dose ...
...
...
58
5. Fast Neutron Dose ...
59
6. Ellipsoidal Head Phantom ...
..
...
60
7. Total Physical Dose .6... 63
8. Weighted Doses .6...
...
64
References...
67
V. Application of Scaling Factors
68
1. Applying Adjustment to Patient Data ...
68
2. Applying Adjustment to Tumor Data ... 72
References ...
7...
75
VI. Somnolence Endpoint 76
1. Peak and Whole Brain Average Dose Relationship ...
78
2. Patient Details ...
81
2. Dose Response ...
...
82
References ...
84
VII. Conclusions and Future Work
85
1. Summary of Conclusions ...
85
2. Recommendations for Future Work ...
86
Tables
Table 1: Description of BNCT clinical trials around the world over the past 40 years .... 14
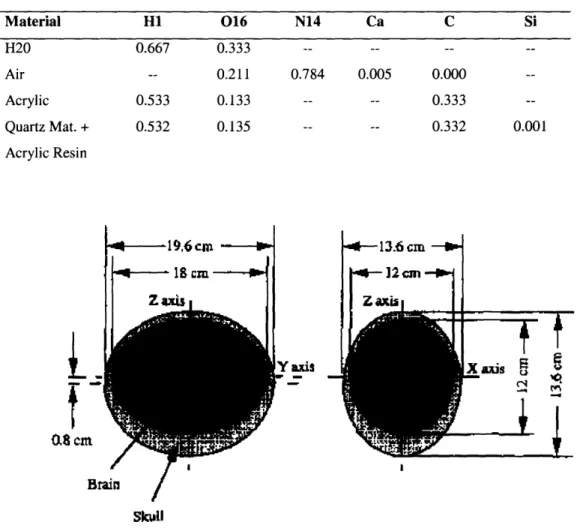
Table 2: Elemental composition for materials in the MIT ellipsoidal head phantom ... 30
Table 3: Material definition for normal brain in RTPE ... 41
Table 4: Normal brain composition as defined by ICRU 46 and by Harvard-MIT, as of
2002 . ... ... 41
Table 5: Material definition for Lucite as defined in RTPE ... 42
Table 6: MIT-measured dose rates, thermal neutron flux, and calculated 14N dose rates inLucite cube in the BMRR at a reactor power of 3MW with the 12-cm collimator
(September 2000) ...
49
Table 7: BNL-measured dose rates, thermal neutron flux, and calculated '4N dose rates inLucite cube in the BMRR at a reactor power of 3 MW with the 8-cm and 12-cm
collim ator ... 49
Table 8: MIT-measured dose rates, thermal neutron flux, and calculated 14N dose rates in
the ellipsoidal head phantom in the BMRR epithermal neutron beam at a reactor
power of 3 MW with the 12-cm collimator ... 50 Table 9: Calculated physical dose rates in the Lucite cube from published MIT and BNLmeasurements. Errors represent the quadrature for summation. The calculations
were performed with either 10 or 10 Lg/g 10B ... 52 Table 10: Calculated weighted dose rates from MIT and BNL measurements in the Lucitecube with either 10lg/g or 20gg/g 1°B, with no error on the RBE factors ... 53 Table 11: Calculated weighted dose rates from MIT and BNL measurements in the Lucite
cube with either 10lOg/g or 20gg/g '°B with 20% error on the RBE factors ... 54 Table 12: Adjustment factors necessary to scale RTPE output to match MIT
m easurem ents. ...
63
Table 13: BNL data on patients treated with BNCT - date of treatment, number of fields
each patient was treated with, and unadjusted and adjusted peak and whole brain
average weighted doses... 71
Table 14: Adjusted and unadjusted peak and average weighted doses to tumor for eachFigures
Figure 1: A drawing of the Deutsch and Murray model of the head and brain using
ellipsoids for the inner and outer surfaces of the skull ... 30
Figure 2: Side and bottom view of the ellipsoidal water-filled head phantom showing
how detectors and activation foils can be inserted in hollow tubes into the internal
w ater volum e ... 31Figure 3: Diagram of 14cm x 14cm x 14cm BNL Lucite cube phantom ... 32
Figure 4: Results of the routine gamma dose rate (bottom) and thermal neutron flux
measurements (top) performed by BNL from December 1994 to June 1999 ... 37 Figure 5: Depth-dose profile in Lucite cube (with no boron) for all components, using 12
cm collimated source as calculated with RTPE ... 40
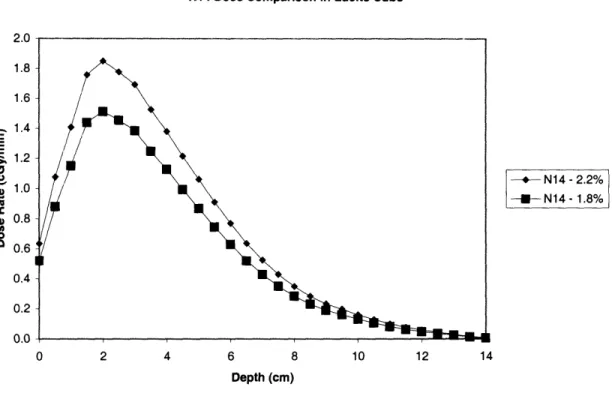
Figure 6: 14N dose rates in the Lucite cube with no 10B, with nitrogen concentrations ofeither 1.8% or 2.2% ... 43 Figure 7: Comparison of total dose rates in the Lucite cube with no '°B, with nitrogen
concentrations of either 1.8% or 2.2% ...
43
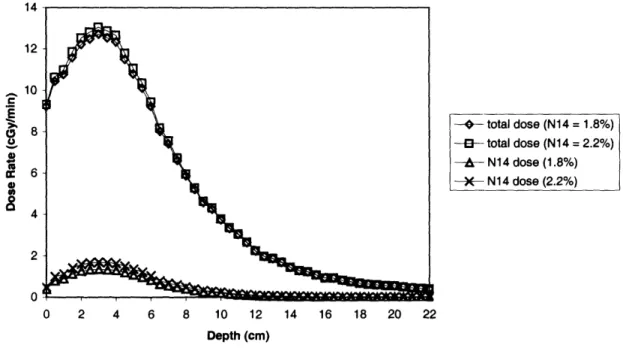
Figure 8: Depth-dose profiles of both the 14N dose rates and the total dose rates in theLucite cube with no °
1B, for nitrogen concentrations of either 1.8% or 2.2% ... 44
Figure 9: 14N dose rate comparison for a 1-field BNL patient with either 1.8% or 2.2%nitrogen in normal brain tissue using the 12-cm collimator ... 45
Figure 10: Total and 14N dose rate comparison for a 1-field BNL patient with either 1.8%or 2.2% nitrogen in normal brain tissue using the 12-cm collimator ... 45
Figure 11: BNL thermal neutron flux measurements compared to RTPE output in the
Lucite cube with the 12-cm collimator ... 55
Figure 12: BNL gamma dose rate measurements compared to the RTPE gamma dose rate
output in the Lucite cube for the 12-cm collimator ... 56 Figure 13: 14N dose rate scaling in Lucite cube with scaling factor 0.92 compared to
original RTPE 14N dose rate output and 14N dose rates calculated from MIT
m easurem ents... 58 Figure 14: 10B dose scaling in Lucite cube with 15ppm l°B with scaling factor 0.92
compared to original RTPE 10B dose rate output and O1B dose rates calculated from M IT measurements ... 58 Figure 15: Photon dose rate in the Lucite cube with a scaling factor of 0.74 compared to
original unscaled RTPE photon dose rate output and MIT photon dose rate
m easurem ents... 59
Figure 16: In-air fast neutron measurements by both BNL and MIT compared to fast
neutron RTPE output in Lucite cube phantom with a scaling factor of 0.73 and
original, unscaled RTPE output ... 60
Figure 17: Unscaled RTPE
14Ndoses in the ellipsoidal head phantom, 14N doses
calculated from MIT measurements, and the scaled RTPE output using a scaling
factor of 0.92 ...
61
Figure 18: Unscaled RTPE 10B doses in the ellipsoidal head phantom, l°B dosescalculated from MIT measurements, and the scaled RTPE output using a scaling
factor of 0.92 ...
62
Figure 19: Unscaled RTPE gamma doses in the ellipsoidal head phantom, gamma doses
Figure 20: Unscaled RTPE fast neutron doses in the ellipsoidal head phantom, in air fast
neutron doses measured by MIT and BNL, and the scaled RTPE output using ascaling factor of 0.73 ...
63
Figure 21: Total physical dose rate output from RTPE with and without adjustment
factors in Lucite cube with 15ppm '°B compared to total physical dose calculated
from M IT m easurem ents... 64
Figure 22: Adjusted and unadjusted total weighted dose in Lucite cube with 15ppm l°Bfrom RTPE compared to total weighted dose calculated from MIT measurements. 65
Figure 23: Adjusted and unadjusted total weighted dose rates in the Lucite cube with15ppm 'lB from RTPE compared to total weighted dose calculated from MIT
measurements assuming 20% error on RBE factors ... 66
Figure 24: Dose volume histogram for 1-field BNL treatment plan with and without
adjustm ent factors ... 69
Figure 25: Dose volume histogram for 2-field BNL treatment plan with and without
adjustm ent factors ... 69
Figure 26: Dose volume histogram for 3-field BNL treatment plan with and without
adjustm ent factors ... 70
Figure 27: Dose volume histogram to tumor for sample 1-field BNL treatment plan with
and without adjustment factors ...
74
Figure 28: Original prescribed peak vs. whole-brain average weighted doses for all BNLpatients with data on which patients showed somnolence following treatment ... 79
Figure 29: Dose response curve for somnolence for all BNL patients treated with BNCT
... 80
Figure 30: BNL and MIT patient peak vs. whole-brain average doses (adjustment factors
applied to BNL patient doses) along with data on which patient showed symptoms
of somnolence following treatment ...
... 81
Figure 31: Whole brain average dose response curve for somnolence for pooled BNL and
I. Background
1. BNCT
Boron neutron capture therapy (BNCT) is an experimental binary radiation treatment
modality currently being tested against types of cancer that have proven difficult to treat
by traditional means, such as the primary brain tumor glioblastoma multiforme (GBM). BNCT relies on the thermal neutron interaction with 10B, which has a high thermalneutron capture cross-section.
A tumor-selective boron-labeled compound is
administered to the patient, followed by neutron irradiation. When the °B nucleus
interacts with a thermal neutron, it emits an alpha particle and a 7Li ion through the'(B(n,a)
7Li reaction. These emitted particles both have very short path lengths in tissue
(about 9m for the alpha particles and about 5m for the 7Li [1]); these distances are
about the same as the diameter of a cell. Because of this, the damage caused by the energy deposition of the alpha particles will occur close to the location of the original 10Binteraction.
BNCT treatment of tumors is quite different than conventional radiotherapy treatment
of tumors. The photon beams used for conventional radiotherapy are targeted to the
tumor. They are sharply collimated, and can be shaped according to the best treatment
plan. For instance, in gamma knife treatment, multiple pencil beams are used, and they
all cross at the tumor, which allows for maximum dose to be administered to the tumor
tissue, while sparing the normal tissue. Therefore, in conventional radiotherapy, normaltissue sparing comes from beam geometry and collimation. In BNCT, low-energy
neutrons are needed for the neutron capture reaction in boron. These low-energy
neutrons scatter once they enter tissue. Because of this, a dose is administered to theentire treatment region. Both the tumor and a considerable volume of surrounding
normal tissue are exposed to neutrons, and there is always a non-specific background beam dose administered to the normal tissues. If capture compounds with good selectivity are used, then the dose to normal tissue is less than the dose to tumor tissue. Thus, in BNCT, normal tissue sparing comes from selective accumulation of boron in thetumor, and BNCT can be used to destroy tumor cells that microscopically infiltrate into
normal tissues. BNCT should be thought of as a tumor-targeting therapy at the cellular
level. With suitable compounds and neutron beams, BNCT can, in principle, control
cancer in large tissue volumes such as whole brain without unacceptable damage to normal brain. BNCT can also, in principle, kill individual tumor cells while sparing the adjacent normal cells. Average therapeutic ratios of about 3 to 4 can be calculated forBNCT using the currently available capture compound boronophenylalanine (BPA).
In clinical trials, BNCT has mainly been used to treat malignant gliomas, particularly
glioblastoma multiforme (GBM). GBM accounts for about 80% of all malignant
gliomas, and is one of the most intractable brain tumors. Despite conventional treatments
(surgery, chemotherapy, traditional radiotherapy), patients with GBM have a median survival time of 9 to 10 months, and a 5-year survival rate of <5% [2]. GBM is a highlyinvasive tumor, with tumor cells infiltrating deeply into the surrounding brain tissue,
creating microscopic islands of tumor cells set apart from the main tumor. These
infiltrating tumor cells cannot be killed by conventional radiotherapy because a dose
large enough to kill them would be administered to normal brain tissue as well, and sucha high dose could cause brain damage. Because of this, BNCT is being investigated as an
alternative means of treating these types of tumors. Given sufficient tumor-selectivity of
the boron-containing compounds, BNCT would have the ability to treat these infiltrating
tumor cells without causing significant damage to the surrounding normal brain tissue by
allowing for a much lower total dose of radiation to be administered to the normal brain.2. BNCT Clinical Trials
Table 1 lists the details of the major clinical trials of BNCT around the world [3].
The first clinical trial of BNCT for patients with GBM began in 1951 at Brookhaven
National Laboratory (BNL), in the Brookhaven Graphite Research Reactor (BGRR).
Over the next 8 years, three series of patients were irradiated there. The BGRR wasoriginally built as a physics facility and therefore was not ideal for BNCT (it had no
medical facility, no treatment room, no beam shutter, etc.). Results from clinical trials
run at this facility were unsuccessful. The lack of success in these clinical trials was due mainly to problems with the boron compounds available at the time. These compounds did not exhibit tumor selectivity; they instead relied on the blood brain barrier to keep '°Bout of the normal brain tissue. This led to high concentrations of '°B in the blood, which resulted in damage to the brain and skin. In the mid 1950's the Brookhaven Medical
Research Reactor (BMRR) was designed and constructed primarily for use in BNCT.
The BMRR became operational in 1959. Over the following two years, a number of patients with brain tumors received BNCT at the BMRR [1]. During these trials, patients were given one of a number of boron-carrying compounds and irradiated with a thermal neutron beam.At the same time (between 1959 and 1961), patients were also being treated with
BNCT at the Massachusetts Institute of Technology reactor (MITR). During these trials,
a number of different boron compounds and thermal neutrons were used in combination
with a variety of surgical interventions. Results from both the BNL and MIT studies were disappointing and all clinical trials of BNCT in the United States were halted in 1961. The disappointing results arose from two primary causes. The first was that thethermal neutron beams did not penetrate very far into tissue. Because of this, there was
inadequate thermal neutron fluence at depth (i.e., if the tumors were deep-seated enough), and some damage was also observed in the patients' skin. Secondly, low tumor to bloodratios were achieved with the boron-containing compounds available at the time. Both of
these problems led to damage to the scalp and to the blood vessels in the brain.The late Hiroshi Hatanaka began BNCT trials in Japan in 1968 at the Hitachi Training
Reactor (HTR). Prior to this, Hatanaka had worked with Dr. William Sweet, who was
pioneering much of the U.S. BNCT research, at Massachusetts General Hospital wherehe had learned surgical intraoperative procedures for BNCT. Over the course of the next
33 years (between August 1968 and July 2001), 183 patients with malignant brain tumors were treated with BNCT using a boron "cluster" compound Na2B1 2H SH, or BSH, andthermal neutron irradiation at 6 different reactors in Japan (however 10 patients since
1998 have been treated with epithermal neutrons under a new protocol). The
tumor-to-blood boron concentration ratio was typically around 1.2-1.69 for BSH in these trials [4].
Results from these patients were more promising than those previously treated in the United States. Out of 105 patients, 29 with Grade 2, Grade 3, or Grade 4 gliomas survived for longer than 3 years [4].BNCT reemerged in the United States after improvements were made in both boron
compounds and neutrons beams in the late 1980s.
At this point, higher-energy
epithermal neutron beams (0.5 eV < E < 10 keV) were created at both the BMRR and theMITR. These higher energy neutrons are moderated as the beam penetrates into tissue to
become low-energy thermal neutrons, which can then be captured by theboron-containing compound in tumor tissue. This allows for tumors that are found deeper in the
brain to be treated with BNCT, and it decreases the risk of damage to skin, since the thermal neutron flux is low at the surface in contrast to the thermal neutron beams where the highest flux is at the skin.
In 1997, a Phase I trial for BNCT began in Petten, the Netherlands. Three years later, another trial began in the Czech Republic. These two studies treat brain tumors using the
boron compound, sodium borocaptate [5]. Two other European trials, one in Finland and
one in Sweden, have been treating GBM patients using the boron compound boronophenylalanine (BPA). All of the European studies have used epithermal neutron beams. A detailed review of all BNCT clinical trials is beyond scope of this thesis.The most recent clinical trial at BNL ran from 1994 until 1999. During this time, 53 patients were treated with BNCT [2, 6]. Over the course of those 5 years, a number of changes in the treatment occurred. One change was simply prescribed by the definition of the clinical study. The clinical trial was a dose-escalating study, and therefore both the peak brain dose and the whole-brain average dose received by the patients was increased over time. Also, the treatment at BNL changed from a one-field treatment to a two-field
treatment, and ultimately to a three-field treatment. Increasing the number of fields
allowed for more uniform dose delivery to tumor and target volumes (target volume was
defined as tumor volume plus a 2 cm margin around the tumor). Combining fields also
allows for a higher peak in the target region, and lower doses to normal tissue. Additionally, a new collimator was created (the old collimator was 8 cm in diameter with a 13.1 cm thickness, and the new collimator was 12 cm in diameter with a 20.7 cm thickness), and the fuel rods in the reactor were rearranged in 1996. This caused desirable changes in neutron and photon flux intensities.In 1994, epithermal neutron BNCT irradiation of peripheral metastatic melanoma
were initiated at the MIT reactor (MITR), and this was followed by the brain tumorclinical trial at Harvard-MIT begun in 1996 to evaluate normal tissue tolerance as well as
tumor response. Between that time and May 1999, 22 patients were treated with BNCT
using the MIT M67 beam. All of these patients were treated for either GBM or
melanoma. As with the BNL trial, the number of fields used varied from one to three
over the three years of the clinical trial, resulting in a progressive increase in both the peak dose and the whole-brain average dose. Harvard-MIT used the compound BPA, atdoses of either 250mg/kg over the course of 1 hour, 300mg/kg over 1.5 hours, or
350mg/kg over 1.5-2 hours. The M67 epithermal neutron beam was used at MIT for the
22-patient phase-I trial, and it was equipped with a 15cm collimator [7]. This beam was located underneath the MITR, and the beam was directed downwards from the ceiling. Due to limitations in the M67 beam (such as low flux of epithermal neutrons and patient positioning difficulties), in 2001 a new fission converter beam (FCB) was constructed atMIT. This new beam has higher neutron intensity and less contamination from fast
neutrons, slow neutrons, and photons [24]. Since this beam was built, 6 patients have
been irradiated in a Phase I/II trial of BNCT with epithermal neutrons there. These
patients are not included in this thesis because the data have not yet been published and
the clinical records are unavailable at this time.
Table 1: Description of BNCT clinical trials around the world over the past 40 years [3]
Infusion Peak Brain Ave. Brain
10B Infusion Amount Ave. BBC' Dose Dose
Facility # of Patients Compound Time (mg/kg) (g 'l°B/g) (Gy-Eq) (Gy-Eq)
HTR, MuITR, JRR, KUR Japan The 183 (1968-present) 26 (1997-Netherlands present) LVR-15 Rez BSH Ihr 100 -20-30 100 BSH mg/kg/min 100 303 5
Czech Rep. (2001 -pres.) BMRR BSH 1 hr 100 -20-30 53 (1994-1999) BPA 2 hr 250-330 12-16 225 MIT, USA (1996-1999) MITR-II, BPA 1-1.5 hr 250-350 10-12 6 MIT, USA (2001-pres.)
Studsvik BPA 1.5 hr 17 (30)6 Sweden (2001-pres.) 18 BPA 350 -15 7.0-7.7 6.90-7.80 24 (range: 15-6 hr 900 34) 7.3-15.5 3.3-6.1 Fir I (1999-pres.) Finland protocol P-01 3 Fir I BPA 2 hr 290-400 12-15 (2001 -pres)7
Finland protocol P-03 BPA 2 hr 290 12-15
' BBC = blood boron concentration during the irradiation. 2 "B physical dose component dose to a
point 2 cm deeper than the air-filled tumor cavity. 3 4 fractions, each with a BSH infusion, 100 mg/kg the
first day, enough to keep the average blood concentration at 30 mg 'B/g during treatment on days 2-4. 4 10B physical dose component at the depth of the thermal neutron fluence maximum. 5 Includes 2 intracranial melanomas. 6 J. Capala, unpublished, personal communication with J. Coderre. 7 Retreatment protocol for recurrent glioblastoma.
15 Gy2 8.6-11.4Gy4 o0B component NA NA Brookhaven, USA MITR-II, M67 < 14.2 <2 FCB 8.4-14.8 1.8-8.5 8.7-16.4 3.0-7.4 8-13.5 3-6 <7 <8 2-3 <6
3. Boron compounds and radiobiology
Over the years, a number of different compounds have been developed which show preferential accumulation in tumors, though only two of these have reached the stage of BNCT clinical trial: p-boronophenylalanine fructose (BPA-F, or simply BPA) and sulfhydryl borane (BSH). BPA was first synthesized in the late 1950s for BNCT, but was initially set aside due to the fact that it penetrates the blood-brain barrier, which at the
time was seen as a significant disadvantage. BPA was later used for treatment of
melanomas due to its structural similarity to melanin precursors [8]. In biodistributionstudies, BPA was found to selectively accumulate in rat 9L gliosarcomas [9]. While the
brain-to-blood boron concentration ratio was approximately 1, the tumor-to-blood/brain
boron concentration ratios were found to be closer to 3:1 or 4:1 [13]. This is most likely due to elevated transport of amino acids at the tumor cell membranes [11]. Using ion microscopy, intracellular boron was found to be uniformly distributed across the cytoplasm and the nucleus in vitro and in implanted 9L brain tumors in rats injected with BPA. The boron concentration in tumor clusters infiltrating the normal brain was found to be about 50% of that in the main tumor for the BPA administration protocol that wasused [12]. BPA-based BNCT produced long-term control of over 90% of rats having
implanted 9L brain tumors [13].
As opposed to BPA, BSH does not cross the blood-brain barrier. It is able to
accumulate in tumors due to the fact that blood vessels in intracranial tumors lack a
properly functioning blood-brain barrier. Animal models showed a tumor to blood boron
concentration ratio of about 0.5:1 to 1:1 [14], but this ratio has been found to be
somewhat higher in human GBM patients. Hatanaka and Nakagawa have found a
tumor-to-blood boron concentration ratio of about 2:1 at 17.5 hours after the end of the
compound infusion in 39 patients, and four European centers showed ratios of about
1.3:1 to 2:1 [15].Currently, BSH is mainly used in the Japanese trials, as well as a few of the European trials. BPA was the compound used during the BNL trials and was used at the Harvard-MIT trials, as well as in trials in Sweden. Patients treated with doses of 250 mg BPA/kg at BNL showed no signs of toxicity after a 2-hour infusion [16], and in fact levels up to
350mg BPA/kg have been administered to patients in the Harvard-MIT trials with a
1.5-hour infusion time [7]. In Sweden, doses up to 900mg/kg administered over 6 1.5-hours,
resulting in average blood-boron concentrations of 24gtg/g at the time of irradiation, have
been administered to patients during a 6-hour infusion with no toxicity [17]. Both BPA
and BSH are administered to the patient intravenously. Using subcellular secondary ion
mass spectrometry (SIMS) on human glioblastoma cells incubated in vitro withl°B-labeled BPA-F or l"B-l°B-labeled BSH, or both, intracellular levels of l°B from BPA-F were
found to nearly double between 1 h and 6 h incubations, with a 3:1 intracellular tonutrient medium partitioning, while intracellular levels of BSH remained essentially
unchanged in both single- and mixed-drug treatments [18].The total radiation dose received by a BNCT patient is comprised of several different
components; this is due in part to beam contaminants (photons), different neutroninteractions that occur in tissue (protons from the 14N(n,p)
14C reaction and photons from
neutron capture in tissue hydrogen, the 'H(n,y)2H reaction), and differences in the distribution patterns of the boron compounds, as described above. Therefore, the total dose is made up of a thermal neutron component, a fast neutron component, a gamma component, and a boron component. To sum all these together requires expressing each in a "photon-equivalent" unit to make it possible to compare against conventional photonirradiation. To do this, relative biological effectiveness (RBE) factors must be applied to
each component.
The RBE for each dose component has been determined
experimentally [14]. Typically, the RBE of a given type of radiation is due only to the radiation's linear energy transfer (LET). In the case of the boron dose component in BNCT, this is not true; the biological effect of boron also depends on which compound isbeing used (i.e., specific microscopic distribution characteristics of the boron compound
must be taken into account). Because of this, instead of RBE, the term compound
biological effectiveness (CBE) factor is used. A "beam RBE" can be determined in theabsence of boron-10 by comparing a neutron beam dose with an X-ray dose sufficient to
produce an isoeffect. Once this beam RBE has been determined, the boron CBE can be determined. Additionally, the individual fast and thermal neutron RBE factors can be determined once the beam RBE has been determined. For each tissue and each boron compound, the RBE and CBE factors can be determined using appropriate normal tissueirradiation models and comparing the x-ray dose, the neutron-only dose, and the neutron plus boron dose required to produce an isoeffect [14]. Once each of the RBE factors has been determined, they can be multiplied by their corresponding dose components and summed together to obtain a total weighted dose, in units of gray-equivalent (Gy-Eq).
4. BNCT Treatment Planning
There are two primary treatment planning software programs available for BNCT.
Since this thesis focuses mainly on combining clinical data from the BNL and Harvard-MIT programs and the differences in dosimetry and treatment plans between these centers, discussion of treatment planning software will be limited to those used at these two facilities: namely, Radiation Treatment Planning Environment (RTPE), as well assome mention of its successor, Simulation Environment for Radiotherapy Applications
(SERA), both of which were used at BNL, and MacNCTPlan/NCTPlan, which is used at MIT. RTPE and SERA were developed by a collaboration of the Idaho NationalEngineering Laboratory (INEL) and the computer science department at Montana State
University [1.9], and were used by the BNCT group at BNL. The BNCT group in Sweden is also currently using SERA. MacNCTPlan and NCTPlan were developed and used by the BNCT group at MIT. These programs all rely on Monte Carlo codes to transport particles through tissue. However, beyond this basic similarity, there are a number of other differences in the software programs, and these differences may give rise to differences in patient treatment plans. Therefore a description of the main characteristics of each program is necessary for a complete comparison of clinical trialsat different institutions.
Before BNCT treatment planning software was developed, scientists determined that
a Monte Carlo (MC) code would be the most useful tool to use in creating a patient treatment plan. In conventional MC codes, it is difficult to obtain the necessary detailededits for BNCT. While volume-integrated results are typically obtained automatically
with most MC codes, special edits must be performed to obtain the necessary output for BNCT, such as dose volume histograms and isodose contours. Additionally, the patient geometry would need to be modeled by hand for use in MCNP, instead of being able to
utilize CT or MRI scans. This would result in a significant increase in total treatment
planning time, due to the time it would take to create the special edits and then the extra time it would take to run enough particles for statistical significance. This led to thedevelopment of BNCT_edit, which is based on a Monte Carlo code called Raffle. Raffle
was developed at the Idaho National Engineering Laboratory (INEL) in the 1970's, and in the 1980's it was extended to incorporate the most recent Evaluated Neutron Data File (ENDF-V), resulting in Raffle V. By the 1990's, BNCT_edit was replaced with BNCT_rtpe, which was first used in the BNL BNCT clinical trials in 1994 [19]. This program is more commonly referred to as Radiation Treatment Planning Environment, orRTPE. Contained in this program is the particle transport code called radiation transport
in tissue by Monte Carlo (better known as rtt_MC), which is the part of RTPE that runsparticles through a specified geometry and makes tallies of information that is of
particular interest to the user.In rttMC, the true patient geometry is used rather than an approximation in order to obtain the detailed edits necessary for BNCT. CT or MRI images taken of the patient are loaded directly into RTPE, and a three-dimensional mesh is imposed over the top of these images. This "subelement mesh" does not affect particle transport or tracking, being that it is virtual and does not actually exist anywhere on the patient. As the particles are tracked through this mesh, tallies are performed to determine total dose, boron dose, gamma dose, nitrogen dose, fast neutron dose, neutron fluence for a specified number of energy bins, and induced gamma production [19].
RTPE makes use of non-uniform rational b-splines, or NURBS. NURBS provide a
free-form curve and surface representation system, which incorporate the properties ofb-splines, interpolating b-splines, and Bezier curves and surfaces [19]. The NURBS replaced
a polygonal representation, in which simple geometric figures (such as cubes, cones, and cylinders) are used to model certain bodies. NURBS can model more complex shapes than polygonal geometry, and can more accurately depict the bodies on a CT or MRI scan. The "non-uniform" aspect refers to a knot vector. This knot vector is actually a series of nondecreasing scalar values that direct the curve about the control points [19].In the RTPE environment, the user enters a number of control points to outline the
surface of the different regions of interest on the individual MRI or CT scans, such asskull, brain, and tumor. From these control points, the knot vector allows for continuity
in the curves. The b-spline uses a weighting scheme to determine the contribution each control point makes to the position vector. At this point, RTPE then generates a file thatis a NURBS representation of a three-dimensional model based on the MRI or CT images
provided from the patient.During the next few years of use, changes were made to the RTPE program to fix problems that arose with the program during the clinical trials. Ultimately, an entirely
new program known as the Simulation Environment for Radiotherapy Applications
(SERA) was created. While both programs were created with the same basic structure, SERA is different from RTPE in a few important ways. First, SERA is based on a
pixel-by-pixel uniform volume element (known as a "univel") reconstruction. Different bodies
are identified on the computer by filling in the pixels associated with each with a different color. A name is given to each of these bodies, and information about each of these bodies is available in the program: information such as elemental composition,RBE factors of the various dose components, etc. The use of these univels gives SERA
the advantage of much shorter execution time for the transport calculations than RTPE.Beam alignment in RTPE is done in the input file. The user specifies the beam alignment by entering on the required line of the input file the beam's distance from a point in the patient's head, the rotation about the azimuthal angle, as well as the rotation
about the polar angle. While the user-specified target point on the patient's head remains
fixed, the neutron source is rotated about this point. Both RTPE and SERA allow for different types of output from the patient treatment plan. For instance, the user canchoose to output a dose-volume histogram (either for the whole brain, a particular
hemisphere, the tumor, etc.). Additionally, the user can output an isodose contour, which
will allow the user to determine if the chosen plan is administering too high a dose to aparticular region of the patient's brain.
The program used in the Harvard-MIT clinical trials is called NCTPlan. It was
initially designed around 1990, and was created to optimize the existing beam design
(dimensions, orientation, energy). The brain model used in this program is calledNeutron Photon Brain Equivalent (NPBE) model, and is created by two non-concentric
ellipsoids. The elemental composition of this model has been documented by Zamenhof
et al. [20].In 1996, after computational improvements were implemented, a new version of NCTPlan was developed. This new version was written in Pascal, and called
MacNCTPlan because it was developed for a Macintosh platform. This MacNCTPlan
contains two major parts. Part I is where the three-dimensional mathematical model of
the patient's head is created from a set of MRI or CT scans using a "voxel" technique. Part II is where the graphical environment exists, allowing the development of dosepatterns from the results of the particle transport calculations. It is here that the dose
distribution results can then be displayed in a one- two- or three-dimensional format.Part I involves reconstructing the patient's head into a geometry form that the computer can use. To do this requires the use of "voxels". Voxels are cubes of volume 1 cm3 (or possibly smaller), which are stacked in a three-dimensional array. A material is assigned to each voxel, and the definitions of these materials can be found in a separate material file. In MacNCTPlan, two sets of CT images are used: one with and one without an iodinated contrast agent. The images with no contrast are used to determine what type
of tissue will make up the three-dimensional model for the MC calculations. The
contrast-enhanced images are used to identify the tumor and other bodies within the head. This step is necessary to determine the region of interest (ROI), which contains the tumor. From the chosen ROI, a diagram of pixel number versus Hounsfield number (H), which is the measure of the X-ray absorbency, or density, of tissue, can be constructed. This diagram will yield three peaks: one for the soft tissue (cancerous or normal), one for the skull and one for the air. Each pixel is given a material assignment depending on its corresponding H value. The final model contains 11,025 calculation cells, each containing between 500-1000 voxels. A material is assigned to each cell by averagingbetween four basic materials (air, tumor, normal soft tissue, and bone), with a weighing
factor depending on the number of voxels in a particular cell corresponding to each
material [20].An important step in any treatment plan is setting up the beam alignment. In
MacNCTPlan, this means identifying the entrance and exit points of the beam's central
axis on the patient. Up to four different beams can be used for treatment. Twoorthogonal viewing planes can be used through CT image data in MacNCTPlan. This
allows for real-time updating when changes are made to the beam orientation, and thus the interaction of the beam with the patient's head model can be seen immediately. Also,the locations of the beam entrance and exit points are necessary for patient positioning
during treatment. In MacNCTPlan, the neutron source is a plane source in a fixed position with regards to the three-dimensional head model. When the user changes the beam orientation, the software changes the location of the source plane, while the head model remains the same. Once the model is created, a Fortran 77 program, calledMPREP, provides the MCNP input deck from a series of files. These files contain all the
information required for computing the doses within the model, including angular and
energy characteristics of the neutron and photon beams, material definitions, and values
for the kinetic energy released in matter (KERMA).Part II of MacNCTPlan allows for viewing the dose patterns extracted from the
transport calculations that are performed by MCNP. These results (such as RBE isodose
contours) can then be displayed in one- two- or three-dimensional format. Dose-volume histograms (DVHs) for the tumor, target volume, and whole brain can be generated as well. This gives the user information on dose distribution, and the percent of particular volumes subjected to a certain dose or dose rate. If multiple beams are to be used during treatment, MacNCTPlan combines them in the treatment plan according to their weight,which is generally defined as a function of the irradiation time.
A few years after MacNCTPlan was created, a new PC-based version of
MacNCTPlan, again named NCTPlan, was created in collaboration with the Comision
Nacional de Energia Atomica in Argentina (CNEA), Harvard Medical School, and MIT. It was written in Microsoft Visual BasicTM 6.0 and runs under Windows 95/98/NT and 2000 [21]. This code was developed in order to update certain parts of MacNCTPlan, as well as to create a software program that can be used on a more common computingplatform. MPREP was integrated into this program, and NCTPlan can superimpose
isodose contours on multiple orthogonal planes of the CT or MRI images. Another
difference between MacNCTPlan and NCTPlan is in the material assignment model.Each image slice is constructed of a number of cells, and each of these cells is defined
based on its mixture of air, soft tissue, tumor, and bone. The percent composition of each
of these materials is rounded off to the nearest percentage, but occasionally, the
procedure of rounding does not yield a total percentage of 100% in each cell. When thishappens, MacNCTPlan assigns to the cell the last admissible mixture calculated.
NCTPlan on the other hand searches for the mixture that minimizes the sum of the
relative differences (in absolute values). If this minimum value is not unique, the code chooses the arrangement that has the least effect on the particle transport [21].Additionally, changes in the calculation of DVHs were performed, which reduce the
errors due to the interpolation method.As can be seen, RTPE and NCTPlan differ in a number of ways. Geometry
reconstruction, material definition, and kerma coefficients are among the significant
differences in the two programs. This thesis will not go into the effects of thesedifferences on the patient treatment plans, but they should be considered for a complete
pooling of patient data.
5. BNCT Intercomparison
Because of the small number of patients treated with BNCT, it is desirable to pool
patient data from different BNCT facilities. As is clear from the above discussion, it is quite difficult to compare a patient treatment plan at one institution to one at a differentinstitution. Therefore, before a complete pooling of patient data can take place, each of
these differences must be evaluated. In particular, this thesis will focus on the differences
between the clinical trials at MIT and BNL. Among these differences are materialdefinitions (particularly elemental composition of
14Nin normal brain tissue),
measurement of thermal neutron flux, fast neutron dose, and gamma dose at each
institution, and geometry definitions.
Over the years, there has been no single common source of elemental compositions of tissue for all the institutions to use, and therefore different institutions use a different
value for the weight percent of
4N found in normal brain tissue. While BNL used a
14Nweight percent of 1.8 (the recommended value from an MIT workshop in 1989 [23]), Petten and Harvard-MIT have most recently been using a value of 2.2% (MIT originally used a value of 1.8%, however then switched in the past few years to use 2.2%), which is
the value recommended by the ICRU report 46 (see Table 2) [22]. The 4N composition
is particularly important because of the thermal neutron interaction that takes place with
14N. Because of this difference in assumed 14N concentration, the two institutions are actually stating that different 14N doses will be administered to a patient. If these doses
are significantly different, the effects may be seen in the total prescribed dose to the
patients.
Another difference is the definition and measurement of thermal neutron flux, as well
as fast and gamma dose measurement from one institution to another. Each institution
measures its beam dosimetry in the way that they feel is most accurate. However, thismeans that most institutions are using different kinds of detectors, measuring in different
phantoms, measuring at different depths down the center line of the beam axis, etc. For
instance, at BNL, thermoluminescent dosimeters (TLDs) were used to measure the
photon dose rate, while at MIT, ion chambers were used. This has caused a systematicdifference in the doses reported by these different institutions for their respective beam
components. TLDs are small and produce a minimum perturbation of the neutron field, but also are somewhat sensitive to thermal neutrons. This creates a high background that must be subtracted. Each type of detector has its own advantages and disadvantages, as well as each having its own associated error in a particular application. Because of this, even in the same beam, the two types of detectors could give different readings. When looking at a dose calculated from these measured values (such as thermal neutron dose calculated from thermal neutron flux measurements), the error will propagate, which causes concern when attempting to compare exposure from beams at differentinstitutions. The error associated with the neutron beam measurements must be evaluated
to determine the error associated with the prescribed dose. These measuring differences
make an intercomparison of patient doses from the two different trials even moredifficult.
Patient geometry at MIT and BNL is reconstructed using MRI or CT scans. When phantoms such as the Lucite cube are run in RTPE, a simple combinatorial geometry reconstruction is typically used. This is because phantoms such as the cube are more
easily modeled using a geometric reconstruction, and CT scans are unnecessary.
However, it is necessary to determine what effect the type of geometry (combinatorial vs.NURBS) has on the peak and whole brain average doses. Differences in patient geometry within a single treatment planning system will be addressed later in this thesis.
As is quite obvious, the characteristics of the beams at different institutions are quite
different from one another.
When a neutron beam is extracted from a reactor,
contaminating photons inevitably become part of the neutron beam. The extent to which
these contaminants are a part of the beam is different from one facility to another. Eachbeam component must be thoroughly analyzed at each institution, and a direct means of
comparing each component from one institution to another must be determined. This
boils down to calculating a scaling factor for each dose component, allowing for acomparison of prescribed peak dose between two institutions.
The use of different treatment planning software programs can also cause problems
when trying to compare patient data. For instance, NCTPlan and RTPE create the model
geometry in very different ways. So, while both model the same patient's head, neither has created the head exactly, and the error associated with each modeling technique will lead to slight differences in the ultimate treatment plans. Additionally, no two codes are written exactly the same, and therefore differences in the particle transport and dose calculations may arise.Since ultimately, a full pooling of BNCT patient data is desired, all of the differences
between the participating facilities must be analyzed and evaluated. The effect of
different 14N concentrations, as well as scaling factors between the beam componentsmust be determined. Once these differences are understood, the MIT and BNL patient data can be combined. The only normal brain side-effect observed in BNCT patients suitable for use in a combined data set has been somnolence, and when the MIT and BNL
patients are combined, a more complete evaluation of the cause of this endpoint can be
examined.
The objective of these Phase-I clinical trials at BNL and H-MIT is to determine safety
and an estimate of normal tissue tolerance. The side effect observed in the central
nervous system (CNS) of some of these patients was a somnolence syndrome. Theobjective of this thesis is to combine the clinical data from the BNL and MIT trials to
create a stronger set of data for evaluation of the BNCT dose-response relationship in
normal brain: in other words, an estimate of the tolerance of the normal brain to thecomplex radiation field produced in tissue during BCNT. Such information on brain
tolerance to BNCT will be of great importance in planning future clinical trials at MIT, asReferences:
L. D.N. Slatkin, A history of boron neutron capture therapy of brain tumours - postulation
of a brain radiation dose tolerance limit, Brain, 114: 1609-1629 (1991).
2. A.D. Chanana, J. Capala, M. Chadha, J.A. Coderre, A.Z. Diaz, E. Elowitz, J. Iwai, D.D. Joel, H.B. Liu, R. Ma, N. Pendzick, N.S. Peress, M.S. Shady, D.N. Slatkin, G.W.
Tyson, L. Wielopolski, Boron Neutron Capture Therapy for Glioblastoma Multiforme:
Interim Results from the Phase /II Dose-Escalation Studies, Neurosurgery, 44:1182-1193 (1999).
3. J.A. Coderre, J.C. Turcotte, K.J. Riley, P.J. Binns, O.K. Harling, W.S. Kiger; Boron
Neutron Capture Therapy: Cellular Targeting of High Linear Energy Transfer Radiation,
Technology in Cancer Research & Therapy, 2: 355-375 (2003).4. Y. Nakagawa, K. Pooh, T. Kageji, S. Uyama, A. Matsumura, H. Kumada, Clinical Review of the Japanese Experience With Boron Neutron Capture Therapy and a
Proposed Strategy Using Epithermal Neutron Beams, Journal of Neuro-Oncology, 62:
87-99 (2003).5. J. Burian, M. Marek, J. Rataj, S. Flibor, J. Rejchrt, L. Viererbl, F. Sus, H. Honova, L. Petruzelka, K. Prokes, F. Tovarys, V. Dbaly, V. Benes, P. Kozler, J. Honzatko, I. Tomandl, V. Mares, J. Marek, M. Syrucek, Report on the first patient group of the Phase I BNCT Trial and the LVR-15 Reactor, Essen, pp. 27-32 (2002).
6. A.Z. Diaz, Assessment of the results from the phase I/II boron neutron capture therapy trials at the Brookhaven National Laboratory from a clinician's point of view, J. Neuro-Oncol. 62: 101-109 (2003).
7. P.M. Busse, O.K. Harling, M.R. Palmer, W.S. Kiger III, J. Kaplan, I. Kaplan, C.F. Chuang, J.T. Goorley, K.J. Riley, T.H. Newton, G.A. Santa Cruz, X-Q Lu, R.G.
Zamanhof, A Critical Examination of the Results From the Harvard-MIT NCT Program
Phase I Clinical Trial of Neutron Capture Therapy For Intracranial Disease, Journal of
Neuro-Oncology, 62: 111-121 (2003).
8. Y. Mishima, C. Honda, M. Ichihashi, H. Obara, J. Hiratsuka, H. Fukuda, H. Karashima, K. T., K. Kand, K. Yoshino, Treatment of malignant melanoma by single thermal neutron capture therapy with melanoma-seeking 10B-compound, Lancet, 2: 388-389 (1989).
9. JA Coderre, JD Glass, RG Fairchild, PL Micca, I Fand and DD Joel, Selective delivery of boron by the melanin precursor analogue p-boronophenylalanine to tumors other than melanoma, Cancer Research, 50: 138-141 (1990).
10. J.A. Coderre, E.H. Elowitz, M. Chadha, R. Bergland, J. Capala, D. D. Joel, H.B. Liu,
D.N. Slatkin, A.D. Chanana, Boron neutron capture therapy for glioblastoma multiforme
using p-boronophenylalanine and epithermal neutrons: trial design and early clinical
results, J. Neuro-Oncol. 33: 141-152 (1997).11. A. Wittig, W.A. Sauerwein, J.A. Coderre, Mechanisms of transport of
p-borono-phenylalanine through the cell membrane in vitro, Radiat. Res., 153: 173-180 (2000).
12. D.R. Smith, S. Chandra, J.A. Coderre, G.H. Morrison, Ion microscopy imaging of '0B from p-boronophenylalanine in a brain tumor model for boron neutron capture therapy,
Cancer Res., 56: 4302-4306 (1996).
13. J.A. Coderre, T.M. Button, P.L. Micca, C.D. Fisher, M.M. Nawrocky, H.B. Liu,
Neutron capture therapy of the 9L rat gliosarcoma using the
p-boronophenylalanine-fructose complex, Int. J. Radiation Oncology Biol. Phys., 30: 643-652 (1994).
14. J.A. Coderre, G.M. Morris, The Radiation Biology of Boron Neutron Capture
Therapy, Radiation Research, 151: 1-18 (1999).15. H. Hatanaka, Y. Nakagawa, Clinical results of long-surviving brain tumor patients
who underwent boron neutron capture therapy, Int. J. Radiat. Oncol. Biol. Phys. 28:1061-1066 (1994).
16. A.D. Chanana, M.D., Boron Neutron-Capture Therapy of Glioblastoma Multiforme at
the Brookhaven Medical Research Reactor: A Phase I/II Study, Brookhaven National Laboratory, Upton, NY, January 2, 199617. J. Capala, B. H.-Stenstam, K. Skold, P.M. af Rosenschold, V. Giusti, C. Persson, E.
Wallin, A. Brun, L. Franzen, J. Carlsson, L. Salford, C. Ceberg, B. Persson, L. Pellettieri,
R. Henriksson Boron neutron capture therapy for glioblastoma multiforme: clinical
studies in Sweden, Journal of Neuro-Oncology, 62: 135-144 (2003).18. S. Chandra, D.R. Lorey II, D.R. Smith, Quantitative Subcellular Secondary Ion Mass
Spectrometry (SIMS) Imaging of Boron-10 and Boron-11 Isotopes in the Same Cell
Delivered by Two Combined BNCT Drugs: In Vitro Studies on Human Glioblastoma
T98G Cells, Radiation Research, 157: 700-710 (2002).19. D.W. Nigg, F.J. Wheeler, D.E. Wessol, J. Capala, M. Chadha, Computational
dosimetry and treatment planning for boron neutron capture therapy, J. Neuro-Oncol. 33:
93-103 (1997).20. R. Zamenhof, E. Redmond II, G. Solares, D. Katz, K. Riley, S. Kiger, O. Harling.
Monte Carlo-based treatment planning for boron neutron capture therapy using custom
designed models automatically generated from CT data, Int. J. Radiation Oncology Biol.
Phys, 35: 383-397 (1996).21. S.J. Gonzalez, G.A. Santa Cruz, W.S. Kiger HI, J.T. Goorley, M.R. Palmer, P.M.
Busse, R.G. Zamenhof. NCTPlan, the new PC version of MacNCTPlan: improvements
and verification of a BNCT treatment planning system, In: Research and Development in
Neutron Capture Therapy, (eds W. Sauerwein R. Moss, A. Wittig), Monduzzi Editore,
Bologna, Italy, 2002, pp. 557-561.22. ICRU 46: Photon, electron, proton and neutron interaction data for body tissues, 1992
23. O.K. Harling, J.A. Bernard, R.G. Zamenhof (eds.), Proceedings of an InternationalWorkshop on Neutron Beam Design, Development, and Performance for Neutron
Capture Therapy, Massachusetts Institute of Technology, Cambridge, MA (March 29-31,
1989).
24. K.J. Riley, P.J. Binns, O.K. Harling, Performance characteristics of the MIT fission
converter based epithermal neutron beam, Physics in Medicine and Biology, 48: 943-958(2003).
25. W.S. Kiger
mI,
X.Q. Liu, O.K. Harling, K.J. Riley, J. Kaplan, H. Patel, R.G.Zamenhof, Y. Shibata, I.D. Kaplan, P.M. Busse, M.R. Palmer, Preliminary treatment
planning and dosimetry for a clinical trial of neutron capture therapy using a fission
converter epithermal neutron beam, in press.II.
Materials and Methods
In comparing patient brain doses between clinical trials at two different clinical centers, it is necessary to quantify any differences in dose measurements based on systematic differences between different dosimetry techniques. Since the intercomparison of the patient doses in this thesis is based upon the dosimetry
intercomparison reported by Riley et al. [1], a discussion of dosimetry techniques at BNL
and MIT is warranted. MIT and BNL used different phantoms to perform routine dosimetry checks on their own beams, and also used different techniques to perform thesemeasurements. To directly compare the dosimetry techniques, measurements were
performed in the BNL beam by the MIT group in 1997 and 2000 using the standard BNL phantom, as well as the standard MIT phantom [1] and the results were compared to the published data from the BNL group [2]. The paper by Riley et al. [1] provides the basic data required for the brain dose comparison in this thesis. Since all factors were the samein both cases except for measurement techniques, a scaling factor between the MIT
measured doses and the RTPE output can be obtained for each dose component. These
scaling factors are a direct measure of the systematic differences in techniques. Again, since this thesis mainly focuses on the differences between clinical trials at MIT andBNL, only the dosimetry methods performed by each of these institutions will be
detailed. Both the BNL and MIT phantoms can be run in the RTPE treatment planning system to benchmark the treatment plan against known measurements and to provide preliminary insight as to differences between the two treatment planning systems.1. Dosimetry Phantoms
Routine dosimetry measurements were performed by MIT in their own beam using
the MIT ellipsoidal water-filled phantom [3]. The ellipsoidal head phantom dimensions
are 13.6 cm in the x-direction, 19.6 cm in the y-direction, and 16.6 cm in the z-direction, with a total volume of 2502 cm3. The top two-thirds of the shell are made of acrylic, andthe bottom third is made of acrylic plates. The definition of these materials can be found
in Table 2. The shell is filled with distilled water, and watertight butyrate tubes areinserted from the bottom of the phantom. This allows gold foils or ionization chambers
that can be driven remotely by a computer-controlled stepper motor to be positioned within the water medium. During the gold foil irradiations the tube containing the foils is filled with water. When measurements are taken, the phantom is aligned with the beam on the patient treatment table along the phantom's x-axis. It is positioned so that there is no gap between the phantom and the plane of the end of the collimator. Figure 1 shows the Deutsch and Murray model of the head. This was used as the basis for the MIT headphantom. Figure 2 shows the dimensions and details of this phantom.
Table 2: Elemental composition for materials in the MIT ellipsoidal Normalized Atomic Fractions
head phantom Material H1 016 N14 Ca C Si H20 Air Acrylic Quartz Mat. + Acrylic Resin
1 ,6cm
-12cm -*
13.6 cm Z axis. Y axis p _i a-r
' · .. '_lFigure 1: A drawing of the Deutsch and Murray model of the head and brain using ellipsoids for the inner and outer surfaces of the skull [3]
0.667 0.533 0.532 0.333 0.211 0.133 0.135 0.784 0.005 0.000 0.333 0.332 0.001
08 cm
*~
c
Brain/
Skull _ i- --I.Tefl vent tube Tya fill tubi H ole fo filling system
Figure 2: Side and bottom view of the ellipsoidal water-filled head phantom showing how detectors and activation foils can be inserted in hollow tubes into the internal water volume [3]
The phantom routinely used for dosimetry measurements at BNL was a solid Lucite
cube. The Lucite cube has dimensions 14 cm x 14 cm x 14 cm (total volume of 2744cm3) and the composition is defined as 8% H, 60% C, and 32% N by weight. This cube has a hole in the front face that extends down the centerline of the cube, as well asoff-axis holes, to accommodate various Lucite rods of 1.59 cm diameter. Slits are cut in
the rods at 3.5, 7.0, and 10.5 cm from the front face of the phantom, allowing for measurements to be made at these depths by TLDs that can be placed in the slits. Rods containing Au foils or Cd capsules with Au foils in them can also be placed in the Lucitecube for additional measurements. For thermal neutron flux measurements, these slits
can hold either a bare Au foil or a cadmium capsule in which an Au foil is placed. The Au foils are square shaped and weighed between 3.02 + 0.03 and 25.59 + 0.26 mg [1].Additionally, for gamma dose measurements or fast neutron dose measurements, an ion
chamber can be inserted instead of the Lucite rod, and can be located at a desired depth by using spacers. To make measurements at additional depths, slits were created at 1.0, 2.0, 5.0, and 9.0 cm. For this study, the Lucite cube phantom was placed with its front face touching the patient collimator, and its central axis aligned with the beam axis [1]. A diagram of the Lucite cube can be seen in Figure 3.cm
I--Figure 3: Diagram of 14cm x 14cm x 14cm BNL Lucite cube phantom
![Table 1: Description of BNCT clinical trials around the world over the past 40 years [3]](https://thumb-eu.123doks.com/thumbv2/123doknet/14408657.511306/14.918.132.775.143.907/table-description-bnct-clinical-trials-world-past-years.webp)
![Figure 2: Side and bottom view of the ellipsoidal water-filled head phantom showing how detectors and activation foils can be inserted in hollow tubes into the internal water volume [3]](https://thumb-eu.123doks.com/thumbv2/123doknet/14408657.511306/31.918.200.627.138.755/figure-ellipsoidal-phantom-showing-detectors-activation-inserted-internal.webp)

![Figure 4: Results of the routine gamma dose rate (bottom) and thermal neutron flux measurements (top) performed by BNL from December 1994 to June 1999 [7]](https://thumb-eu.123doks.com/thumbv2/123doknet/14408657.511306/37.918.136.752.326.940/figure-results-routine-thermal-neutron-measurements-performed-december.webp)