HAL Id: hal-02987183
https://hal.archives-ouvertes.fr/hal-02987183
Submitted on 3 Nov 2020HAL is a multi-disciplinary open access
archive for the deposit and dissemination of sci-entific research documents, whether they are pub-lished or not. The documents may come from teaching and research institutions in France or abroad, or from public or private research centers.
L’archive ouverte pluridisciplinaire HAL, est destinée au dépôt et à la diffusion de documents scientifiques de niveau recherche, publiés ou non, émanant des établissements d’enseignement et de recherche français ou étrangers, des laboratoires publics ou privés.
Refined carbohydrate consumption and facial
attractiveness
Berticat Claire, Durand Valérie, Raymond Michel
To cite this version:
Berticat Claire, Durand Valérie, Raymond Michel. Refined carbohydrate consumption and facial attractiveness. Evolutionary Psychology: an International Journal of Evolutionary Approaches to Psychology and Behavior, Ian Pitchford, Ed.& Pub., 2020. �hal-02987183�
Refined carbohydrate consumption and facial attractiveness
Berticat Claire 1*¶, Durand Valérie 1¶, Raymond Michel1
*Corresponding author
E-mail: [email protected]
1
ISEM, Univ Montpellier, CNRS, EPHE, IRD, Montpellier, France
Acknowledgements
The authors thank the City Hall of Montpellier, Luc Gomel and all staff from the Serre Amazonienne for providing places for rater recruitment and the women and men who participated in this study. This is contribution ISEM 2020-229. 1 2 3 4 5 6 7 8 9 10 11 12 13 14 15 16 17 18 19 20 21 22 23 24 25 26 27 28
Declaration of Conflicting Interests
The author(s) have declared no potential conflicts of interest with respect to the research, authorship, and/or publication of this article.
Ethical Statement
The protocol used to recruit participants and collect data was approved by the French Committee of Information and Liberty (CNIL #1783997V0). For each participant, the general purpose of the study was explained (“a study on the determinants of mate choice”), and written voluntary agreement was requested for statistical use of data (private information and photographs). Data were analysed anonymously.
Funding
The author(s) have disclosed receipt of the following financial support for the research, authorship, and/or publication of this article: Agence Nationale pour la Recherche ‘HUMANWAY’ project (ANR-12-BSV7-0008-01). None of the funding organisations or sponsors played a role in the design and conduct of the study; in the collection, management, analysis, or interpretation of the data; or in the preparation, review, or approval of the manuscript.
ORCID iD
Claire Berticat: https://orcid.org/0000-0003-1305-5337 Michel Raymond: https://orcid.org/0000-0002-1714-6984
29 30 31 32 33 34 35 36 37 38 39 40 41 42 43 44 45 46 47 48 49 50
Abstract
Since the second half of the 20th century, a massive increase in the consumption of refined carbohydrates has occurred, generating well-described detrimental health effects such as obesity, insulin resistance, type II diabetes, cardiovascular diseases and dental caries. Certain physiological mechanisms involved, particularly through chronic hyperglycaemia and hyperinsulinaemia, suggest that a non-medical trait such as facial attractiveness could also be affected. To explore this possibility, variation in facial attractiveness was evaluated relative to refined carbohydrate consumption. Attractiveness was assessed from facial pictures as judged by raters of the opposite sex. Estimates of refined carbohydrate consumption were based on the glycaemic load of three mealtimes at-higher glycaemic risk (breakfast, afternoon snack and between-meal snack). In the presence of several control variables, facial pictures of women and men with higher between-meal glycaemic loads were preferred by opposite-sex raters. Structural equation modelling suggests that this result is possibly mediated by an increase in apparent age for men and an increase in femininity for women. The different physiological ecologies of the three meals at-higher glycaemic risk are discussed as well as the interpretation of the results in terms of adaptation or maladaptation to the modern and unique dietary environment.
Keywords
Refined carbohydrates, sugars, evolutionary diet, dietary switch, facial attractiveness, social trait, glycaemic load 51 52 53 54 55 56 57 58 59 60 61 62 63 64 65 66 67 68 69 70 71 72 73
Introduction
Each animal species is adapted to a specific diet (carnivorous, herbivorous, etc.) through a specialised digestive process. Therefore, any rapid change in this diet could result in health problems, revealing that the change has driven the population outside its adaptive peak (Fiennes, 1965). In humans, during the 20th century, a drastic dietary switch occurred in Western populations with the introduction of industrially processed food such as refined products (carbohydrates, oil) and additives (e.g., trans-fatty acids, gluten, sweeteners). In particular, a massive increase in the consumption of refined carbohydrates (primarily sucrose, fibre-depleted gelatinous starches and high sugar corn syrup) occurred in less than three generations (Cordain et al., 2005). As a consequence, these refined carbohydrates currently represent a major element of the modern urban diet (e.g., 36% of total energy in the typical US diet) compared with at most a few percentage points as recently as 200 years ago (Cordain, Eades, & Eades, 2003). Certain detrimental health effects of this new refined carbohydrate-rich food consumption are now well known, such as obesity, insulin resistance, type II diabetes, cardiovascular diseases and dental caries (Hu, Van Dam, & Liu, 2001; Jellinger, 2007; Johnson et al., 2007; Spencer, Appleby, Davey, & Key, 2003; Touger-Decker & Van Loveren, 2003). Many other direct or indirect deleterious effects are also strongly suspected, e.g., Alzheimer’s disease, hypertension, inflammatory diseases, cancer, myopia, acne, etc. (Cordain et al., 2002; Cordain, Eaton, Brand Miller, Lindeberg, & Jensen, 2002; Craft, 2007; Johnson et al., 2007; Key et al., 2004; Manzel et al., 2013; Gentreau et al., 2020).
Thus far, the increase in refined carbohydrates consumption has been shown to affect body physiology and health. However, frequent refined carbohydrate-rich food consumption generates chronic hyperglycaemia and thus chronic hyperinsulinaemia, the latter interfering with growth factors and sex hormones, which themselves modulate morphology and secondary sex characteristics
74 75 76 77 78 79 80 81 82 83 84 85 86 87 88 89 90 91 92 93 94 95 96
(Cordain, Eades, & Eades, 2003). Considering that facial masculinity/femininity influences attractiveness (for a review see: Puts, Jones, & DeBruine, 2012), it is possible that an increase in refined carbohydrate consumption has affected facial attractiveness. There are indirect cues that refined carbohydrate consumption could affect attractiveness. For example, Zuniga, Stevenson, Mahmut, & Stephen (2017) showed that carbohydrate intake, mainly food item rich in refined carbohydrate, reduces body odour attractiveness. Also, refined carbohydrates are among the factors suspected to accelerate skin ageing and photo-ageing (Purba et al., 2001; Cosgrove, Franco, Granger, Murray & Mayes, 2007), a trait affecting attractiveness (Buss, 1989). Attractiveness influences adiverse range of critical social outcomes, from mate choice to decisions related to social exchange. For example, physically attractive (relative to unattractive) individuals are evaluated more favourably as romantic partners (Eastwick, Luchies, Finkel, & Hunt, 2014), as students by teachers (Ritts, Patterson, & Tubbs, 2016), and even as political candidates (Praino, Stockemer, & Ratis, 2014).
In this study, we investigated whether refined carbohydrate consumption affects facial attractiveness in healthy women and men. General predictions on whether attractiveness is increased or decreased as the result of refined carbohydrate consumption are not straightforward. For example, hyperglycaemia could have a possible ageing effect (i.e. increase of apparent age), with the consequence of increasing attractiveness in men and decreasing attractiveness in women (Buss, 1989; Jencks & And Others, 1979). However, hyperglycaemia generates hyperinsulinaemia. Hyperinsulinaemia with insulin resistance have been linked to diseases associated with perturbation of sex hormones (Cordain et al., 2003) and to testosterone levels increased in women and decreased in men (Lutz et al., 2019), thus potentially decreasing attractiveness for both sexes (Puts et al., 2012). As a consequence, for women, it is expected that refined carbohydrate consumption decreases attractiveness. For men, no clear prediction could be unambiguously formulated. Evaluation of attractiveness was based on facial pictures evaluated by raters of the opposite sex. Evaluation of refined carbohydrate
97 98 99 100 101 102 103 104 105 106 107 108 109 110 111 112 113 114 115 116 117 118 119 120
consumption was based on total glycaemic load (a proxy of glycaemic and insulinaemic responses) of three mealtimes at-higher glycaemic risk (breakfast, afternoon snack and between-meal snack). The choices of the raters were explained by the diet variables in the presence of potentially confounding variables including apparent age and a femininity/masculinity index.
Methods
Individual measures
Individuals between 18 and 26 years of age were recruited at the University of Montpellier. Possible confounding variables potentially affecting facial attractiveness were collected: sex, year and month of birth, height and weight, socio-economic status (scholarship level coded from 1: no scholarship to 4: highest level), smoking (yes: 1, no: 0) and for women, use of contraceptive pill (yes: 1, no: 0, Alvergne & Lummaa, 2010). Facial photographs of all of the individuals were obtained from a frontal perspective at a distance of approximately 1 m using the same digital camera (Canon EOS 20D) with a 50-mm focal length.
The subjects were asked to express a neutral face (without a smile) and to remove any glasses or earrings. Photographs of individuals declaring a European origin of their 4 grandparents were further retained. All photographs were processed using Adobe Photoshop CS3 to normalise size (photographs were aligned on the eye position, with a fixed distance between the eyes and chin). The backgrounds were replaced by a uniform grey colour.
Diet variables
The various daily meals have different nutritional composition and thus they do not bring the same glycaemic response. Indeed, carbohydrates are rarely ingested alone, and their degradation and absorption rates during digestion are modified by the other macronutrients. The glycaemic response
121 122 123 124 125 126 127 128 129 130 131 132 133 134 135 136 137 138 139 140 141 142 143
will be higher with a meal rich in refined carbohydrates, poor in fat, protein and fibre (Hätönen et al., 2011; Sun, Ranawana, Leow, & Henry, 2014). The order of food macronutrient intake also changes the glycaemic and insulinaemic responses (Sun, Goh, Govindharajulu, Leow, & Henry, 2020). As a consequence, meals such as breakfast, afternoon snack and between-meals snack, which are described as richer in refined carbohydrates and displaying less food items, may be at-higher glycaemic risk (Bellisle et al., 2003; Bellisle, 2014; Bellisle, Hébel, Salmon-Legagneur, & Vieux, 2018). Thus the exhaustive list of the different foods and drinks chronically consumed during these specific times in the same day (breakfast, afternoon snack [“goûter” in French, corresponding to an after-school snack] and between-meals snack) was collected.
For each food and drink item, the glycaemic load was evaluated according to the International Tables of Glycaemic Index and Glycaemic Load Values and the corresponding serving size (Atkinson, Foster-Powell, & Brand-Miller, 2008). The glycaemic index refers to the rate of glucose release by measuring the 2 h postprandial glycaemia value after consumption of a food portion containing 50 g of available carbohydrates relative to 50 g of glucose consumption. The glycaemic load (GL) is calculated by multiplying the glycaemic index by the amount of available carbohydrates (g) per serving, divided by 100 (Monro & Shaw, 2008). Compared with low-GL diets, high-GL diets elicit larger glycaemic and insulinaemic responses (Foster-Powell, Holt, & Brand-Miller, 2002). For each subject, the glycaemic load for each item was summed leading to an estimation of total glycaemic load for breakfast (GL1), afternoon snack (GL2) and between-meal intake (GL3). Foods with low carbohydrate content (e.g., meat, fat) were not assigned any glycaemic load value (Bakel et al., 2009). Energy intake (EI) and macronutrients (carbohydrates, fat, protein and fibre) for each item were obtained from the Anses-Ciqual database (www.anses.ciqual.fr) and were calculated for each participant depending on its corresponding serving size (Atkinson, Foster-Powell, & Brand-Miller, 2008). For each subject, they
144 145 146 147 148 149 150 151 152 153 154 155 156 157 158 159 160 161 162 163 164 165 166
were summed leading to an estimate of total energy intake for breakfast (EI1), afternoon snack (EI2) and between-meal intake (EI3) and corresponding macronutrient compositions.
Apparent age and attractiveness estimation
Volunteer adult raters were recruited in public places in Montpellier, France. For each rater, the sex, age and geographic origin (continent of birth for the rater, parents and grandparents) were recorded. A first set of raters estimated the age of the subjects from their facial photographs. A Delphi-based computer program was generated to present randomly drawn photographs to raters of the opposite sex. Each rater assessed 20 distinct photographs. If the rater knew one of the subjects, the trial was removed. Three photographs randomly chosen among those previously viewed were presented again at the end to estimate judgement reliability. A second set of raters was sampled to make decisions concerning the relative attractiveness of the facial photographs. A Delphi-based computer program was generated to present randomly drawn pairs of photographs to raters of the opposite sex (Figure 1). For each pair, the raters were instructed to click on the photograph depicting the face that they found the most attractive. The position of the photograph on the screen (left or right) was randomly ascribed. Each rater assessed 20 distinct pairs of photographs, corresponding to 40 different randomly chosen subjects. If the rater knew one of the subjects presented for judgement, the trial was removed. Additionally, the first pair of photographs viewed by each participant was not used in the analyses because the task could require a certain amount of habituation. Three pairs randomly chosen from among those previously viewed were presented again at the end to estimate judgement reliability.
Femininity/masculinity index
To generate the morphological facial femininity/masculinity index (fem/masc index), a geometric morphometric analysis of the faces was used following the methods described in Dixson, Lee, Sherlock, & Talamas, 2017; Lee et al., 2014; Scott, Pound, Stephen, Clark, & Penton-Voak, 2010. First, the coordinates of 142 landmarks (anatomical points present in all individuals, e.g., corners of the
167 168 169 170 171 172 173 174 175 176 177 178 179 180 181 182 183 184 185 186 187 188 189 190
lips) and semi-landmarks (sliding points positioned along selected anatomical curves, such as the bow of the eyebrow) were delineated for each male and female face. The delineation of the landmarks and semi-landmarks was performed using Psychomorph (Tiddeman, Stirrat, & Perrett, 2005). The R package Geomorph (version 3.0.3) was used to perform Procrustes superimposition of the landmark and semi-land-mark data, which removes non-shape information such as translation, size and rotational effects (Zelditch, Swiderski, & Sheets, 2012). The coordinates were transformed into shape variables via principal component analysis (PCA). The first 10 axes were retained (explaining 75.0% of variance) for further analyses. To compute a data-driven single measure of facial masculinity, an LDA was conducted on the PCA coordinates with sex as the grouping variable. The resulting discriminant function correctly classified 100% of individuals in the two categories. Each individual coordinate on the woman-man axis was used as a facial femininity/masculinity index, with high values indicating a more masculine facial morphology (Dixson et al., 2017; Lee et al., 2014; Scott et al., 2010).
Statistical analyses
For each individual, age estimates were averaged across raters, and the resulting measure was used as the perceived age variable. Logistic regression was used to analyse the rater preferences. The binary response variable corresponded to being chosen or not for the focal subject (arbitrarily, the subject presented at the left position) during the presentation of each pair. Subjects and raters occurred repeatedly (each subject was viewed by several raters, and each rater evaluated several pairs of subjects) and were thus random-effect variables. Therefore, generalised linear mixed models with a binomial error structure were applied. To force the models to fit away from singularities, the Bayesian bglmer function of the blme package for R software was used (Chung, Rabe-Hesketh, Dorie, Gelman, & Liu, 2013). Maximum random effects structure (intercept and slope) was tentatively included according to Barr, Levy, Scheepers, & Tily (2013), but the random slope effect was not included in the final models because it prevented convergence. For each choice made by a judge, the difference (left
191 192 193 194 195 196 197 198 199 200 201 202 203 204 205 206 207 208 209 210 211 212 213 214
minus right) between the GL1 of the focal and the non-focal subject was calculated, and the same procedure was performed for the GL2 and GL3. These differences were integrated into the model as the variables of interest. Because pairs of subjects were rated by the opposite sex (men rated by women and women rated by men), two models were performed, one for each subject’s sex. For both, several control variables potentially affecting facial attractiveness were added: differences between the variables associated with the individuals of each pair (left minus right) for age, age departure from actual age (perceived age minus actual age), facial femininity/masculinity index, BMI (calculated as weight divided by the squared height), scholarship level [-3 to +3], smoking [-1 to +1], and for women, pill use [-1 to +1]). All quantitative variables were centred. The significance of each term was assessed from the model including all of the other variables. The variance inflation factor was computed using the vif.mer function adapted from the vif function of the R package rms (Harrell, 2015; Zuur, Ieno, & Elphick, 2010). Differences between the EI variables associated with the individuals of each pair were not included in the model due to the high correlation of EI1, EI2 and EI3 with GL1, GL2 and GL3 respectively (Pearson's correlation coefficient r > 0.9 and P < 10-4 for all). Rather, the same models were conducted using these variables instead of GL. Because the glycaemic load variables (GL1, GL2, and GL3) could potentially affect certain control variables directly (e.g., age departure from actual age, femininity/masculinity index and BMI), this could indirectly influence the effect of the GL variables on the dependent variable. To evaluate this possibility, structural equation modelling was performed using the control variables from the model displaying P < 0.1. An attractiveness index was constructed for each individual, computed as the number of times this individual was chosen over the number of occurrences. An hypothesised path model was constructed for each sex, incorporating four linear regressions with GL3 to explain attractiveness, age departure from actual age, BMI, and femininity/masculinity index for women and incorporating three linear regressions to explain attractiveness, age departure from actual age, and BMI for men (Figure 2).
215 216 217 218 219 220 221 222 223 224 225 226 227 228 229 230 231 232 233 234 235 236 237 238
All statistical analyses were performed using R software version 3.5.2 using the packages
blme (v1.0-4, Chung, Rabe-Hesketh, Dorie, Gelman, & Liu, 2013), rms (v5.1-4, Harrell, 2015), and lavaan v0.6-3, Rosseel, 2012). The SE values and P values for standardised path coefficients were obtained through the function standardisedSolution in the ‘lavaan’ package.
Results
A total of 50 female and 49 male Caucasian subjects with fully completed questionnaires were used. Descriptive statistics of their physical characteristics are given in Table 1, and their food consumption for each meal are detailed in Table 2. The proportion of men and women taking a meal were 92% and 90% respectively for breakfast, 63% and 70% respectively for an afternoon snack, and 41% and 50% respectively for a between-meal snack. Mean glycaemic load (GL) and energy intake (EI) for each meal are computed considering only consumers (Table 3). According to the general classification (e.g. Eleazu, 2016), the means of GL obtained for each of the three meals studied were high (>20) except for GL3 in women which was medium (value between 11 to 19) (Table 3). GL and EI values were in the same range of variation as those from another study on a French population (Gentreau et al., 2020).
Raters were first recruited to assess the perceived age of the subjects. Assessments from unreliable raters (i.e., with more than fifteen years for the sum of the absolute difference between real ages and attributed ages during the three judgements of reliability) were removed, resulting in a final sample of 222 raters (78 men and 144 women, age range: 18-76, mean age ± s.d.: 36 ± 14 years for men and 37 ± 13 years for women). This process resulted in a total of 834 estimations of men towards women and 1435 estimations of women towards men. The mean number of raters was 28.8 (range: 14-41) for each man and 16.6 (range: 12-25) for each woman. For each individual, the perceived age
239 240 241 242 243 244 245 246 247 248 249 250 251 252 253 254 255 256 257 258 259 260 261
variable was computed as the average estimated by the raters. Overall, the perceived age was either younger (maximum 3.0 years) or older (maximum 7.8 years) than the chronological age, with a mean ± s.e.m. of 1.7 ± 0.25 years older.
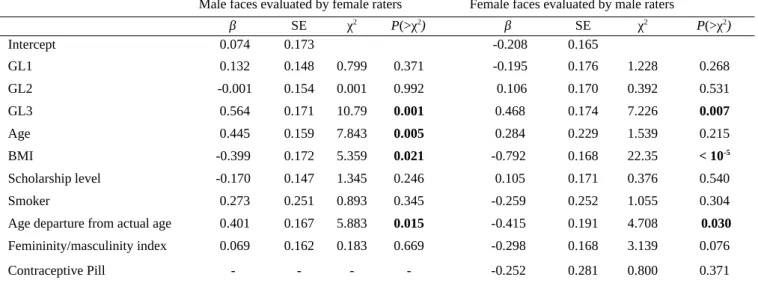
Raters (N = 169) were subsequently recruited to assess the attractiveness of the subjects. The following conservative selection of raters was applied. First, to reduce cultural heterogeneity, only raters from a European ancestry were considered. Second, unreliable raters (i.e., with more than one incorrect answer during the test of judgement reliability) or non-adult raters (less than 18 years old) were removed. A total of 150 raters were retained in the final sample (61 men and 89 women, age range: 18-68, mean age ± s.d.: 35 ± 10 years for men and 33 ± 13 years for women). This process resulted in a total of 346 judgements of men towards women and 402 judgements of women towards men. The mean number of raters was 17 (range: 8-24) for each man and 14 (range: 6-21) for each woman. The probability that a subject was chosen as the most attractive was significantly influenced by the variable GL3 (men: β = 0.564, SE = 0.171, P = 0.001; women: β = 0.468, SE = 0.174, P = 0.007,
see Table 4). Women preferred men, and men preferred women, with the highest between-meal glycaemic load. Some control variables significantly influenced the choice of the raters. For male and female subjects, BMI had a negative effect on the probability of being chosen as the most attractive (men: β = -0.399, SE = 0.172, P =0.021; women: β = -0.792, SE = 0.168, P < 10-5). A lower BMI was preferred for both sexes. For male subjects, age had a positive effect on the probability of being chosen (β = 0.445, SE = 0.159, P = 0.005), and women preferred men with an older age. The difference in age departure from actual age had a significant impact on attractiveness (men: β = 0.401, SE = 0.167, P = 0.015; women: β = -0.415, SE = 0.191, P < 0.030). At equal chronological age, women preferred men with the oldest perceived age. At equal chronological age, men preferred women with the youngest perceived age. Scholarship level, smoking status, femininity/masculinity index, and taking the contraceptive pill (for women) did not have a significant effect on the probability of being chosen (P >
262 263 264 265 266 267 268 269 270 271 272 273 274 275 276 277 278 279 280 281 282 283 284 285
0.25, for both sexes, except femininity/masculinity index for women, P = 0.07). The full model for men explained 9% of the total deviance and the variance inflation factors (VIF) were less than 1.50. The full model for women explained 10% of the total deviance and the VIF were less than 2.50. VIF values for both models indicated that the multicollinearity between covariables was weak and not of concern (Zuur et al., 2010). Models using EI1, EI2 and EI3, gave qualitatively similar results (Table S1). A hypothesised path diagram was constructed for each sex to evaluate a possible direct effect of GL3 on the control variables BMI, age departure from actual age, and femininity/masculinity index (Figure 2). For men, GL3 had a significant effect on age departure from actual age (path coefficient = 0.310, P = 0.014). A higher between-meal glycaemic load increased appearance towards an older age. For women, GL3 had a marginally significant effect on the femininity/masculinity index (path coefficient = -0.249,
P = 0.056). A higher between-meal glycaemic load decreased masculinity.
Discussion
In this study, we investigated whether refined carbohydrate consumption is related to facial attractiveness in healthy women and men. We found that women and men with the highest between-meal glycaemic loads were preferred by opposite-sex raters, result in the opposite direction than the prediction based on known physiological effects for women. This preference was maintained when controlling for potential confounding effects such as age, age departure from actual age, BMI, scholarship level, smoking status, facial femininity/masculinity index, and for women, whether they took the contraceptive pill.
Attractiveness is not independent of the refined carbohydrate content of the food eaten estimated through glycaemic load, although this effect was evidenced from only one (between-meal
286 287 288 289 290 291 292 293 294 295 296 297 298 299 300 301 302 303 304 305 306 307
snack) of the three mealtimes at-higher glycaemic risk considered. This meal is not the one with the higher mean GL, and is not particularly odd for its macronutrient content as well as carbohydrates, protein, fat and fibre (Table 3). A possible explanation is that these three types of meals could correspond to different ecological food habits that affect subjects differently with different physiological consequences. For example, the usual mid-afternoon eating occasion known in France as the ‘goûter’ corresponds (for those who usually have one) to a real dietary need. This meal is associated with a pre-prandial decline in plasma glucose and insulin concentration and a high motivation to eat (Chapelot, Marmonier, Aubert, Gausseres, & Louis-Sylvestre, 2004). In contrast, between-meal snacks are often not associated with physiological hunger and are rather motivated by social or other external stimuli, with few resulting effects on satiety and compensation mechanisms (Bellisle, 2014). Therefore, this meal category could better reflect chronic and acute refined carbohydrate consumption. Finally, it is worthy of note that consumers of the between-meal snack were at a frequency around 40-50% (Table 2), allowing more statistical power to detect a difference between two groups, relative to the distribution of consumers for the two other meals (ca. 91% for breakfast, and 63-70% for the afternoon snack).
How chronic between-meal snacks could affect attractiveness
Refined carbohydrate-rich food consumption generates hyperinsulinaemia as a consequence of hyperglycaemia, interfering with growth factors and sex hormones, which themselves modulate morphology and secondary sex characteristics (Cordain et al., 2003). This result occurs because hyperinsulinaemia stimulates androgen synthesis by the ovaries and testes, increasing the quantity of free (and thus active) androgens in the blood. Androgens are the precursors of male and female sex hormones such as testosterone and oestrogen. Hyperinsulinaemia has been linked to diseases associated with significant perturbation of sex hormone levels, such as polycystic ovary syndrome and premature menarche (Cordain et al., 2003). If the influences of a refined carbohydrate-rich diet on other
308 309 310 311 312 313 314 315 316 317 318 319 320 321 322 323 324 325 326 327 328 329 330 331
downstream consequences have been poorly studied to date, it is possible that these consequences include the development of secondary sexual traits, typically masculine or feminine facial features. In addition, it has been shown that sex hormones modulate facial femininity/masculinity, which in turn influences attractiveness, with men preferring more feminine faces and women preferring more masculine ones (for a review see Puts et al., 2012). To capture facial secondary sex characteristics, a femininity/masculinity morphological index was computed, for which the difference within each pair was used as a control variable. Structural equation modelling showed that for women, the effect of glycaemic load on attractiveness could be indirectly mediated through a direct effect of the femininity/ masculinity index, leading to an increase of femininity. Sexual hormones are possible candidates to explain this effect (Cordain, Eades, & Eades, 2003), although, as it is in the opposite direction than expected, further work is required for a better understanding.
Another physiological effect of refined carbohydrate-rich food consumption is hyperglycaemia, which has itself several physiological consequences. For example, hyperglycaemia accelerates glycation, a covalent bonding process that cross-links the amino acids present in the collagen and elastin that support the dermis. Cross-linked collagen fibres are incapable of repair through the usual process of remodelling, directly impacting youthful skin appearance, which relies on flexible and repairable collagen fibres (Danby, 2010). Thus chronic hyperglycaemia generated by chronic between-meal snacks could affect attractiveness because skin ageing directly impacts age appearance (Nkengne et al., 2008), and age affects attractiveness (Samson, Fink, & Matts, 2010). However, this possible effect was controlled for because apparent age was independently estimated, and the difference in age departure from the chronological age within each pair was used as a control variable. Structural equation modelling suggested that for men, the effect of glycaemic load on attractiveness could be indirectly mediated through a direct effect on age departure from actual age. Indeed, an increase in the age difference (chronological or apparent) within each pair increased
332 333 334 335 336 337 338 339 340 341 342 343 344 345 346 347 348 349 350 351 352 353 354 355
attractiveness (Table 4), and thus any skin ageing effect, which increases apparent age, also increases attractiveness. This increase in attractiveness with age is generally described for relatively young men in the range 20-50 years old and is classically explained by the correlation between age and characteristics that advertise adequate parental investment in terms of resource and social status (Buss, 1989; Jencks & And Others, 1979). For older ages, the correlation between age and attractiveness is reversed, perhaps due to somatic senescence compromising some type of paternal investment, fertility decline, or to higher chances of passing on genetic defects to offspring (Hellstrom et al., 2006; Kong et al., 2012). For women, the ageing effect is the opposite: an increase in the difference in age departure from actual age within each pair decreased attractiveness, i.e., men preferred women that were perceived to be younger (or compared to women evaluated older) (Table 4). Indeed, age supplies a powerful cue related to female reproductive capacity, and men prefer younger women (Buss, 1989).
Ultimately, why is an increase in refined carbohydrate consumption associated with an increased attractiveness ?
Traditional foods with a high level of sugar contents are energetically rewarding, although they are typically seasonal or scarce, such as ripened fruit and honey. Because sugar excess generated by hyperglycaemia is stored as fat, traditional foods that generate hyperglycaemia are sometimes used to intentionally increase fat storage, e.g., the case of the food intake of Japanese sumo wrestlers (Nishizawa et al., 1976) or the fattening sessions described in various ethnic groups before an expected general shortage period (Garine & Koppert, 1990; Garine & Koppert, 1991). Generally, traditional food, i.e., pre-industrial or non-refined, does not generate hyperglycaemia. This is the case for fresh fruits, legumes, traditionally prepared cereals, etc., although there are counter-examples such as honey. Globally, traditional foods that generate hyperglycaemia were not always readily available because they were scare or expensive. Thus, it is possible that intake of foods that generate hyperglycaemia represents an advantage in certain traditional environments, particularly when food shortages are not
356 357 358 359 360 361 362 363 364 365 366 367 368 369 370 371 372 373 374 375 376 377 378 379
uncommon. In such an environment, detection and preference of facial cues that display an ability to find refined carbohydrates sources could constitute an evolutionary advantage for the choice of mating partner. This hypothesis could explain why an increased consumption of such food increases attractiveness. However, in the current industrial dietary environment, foods that generate hyperglycaemia are not limited, and their consumption is not a signal of quality anymore. Therefore, it is possible that the current increased attractiveness associated with the increased consumption of such food is better understood as a maladaptation.
How the other control variables could affect attractiveness
Several other variables potentially affecting attractiveness were controlled for, although only BMI has a significant effect in that a higher BMI decreased facial attractiveness for both men and women (Table 4). Indeed, body weight can be accurately judged from facial images alone (Coetzee, Chen, Perrett, & Stephen, 2010), and cues of adiposity affect social judgements of female and male faces (Coetzee, Perrett, & Stephen, 2009; Han, Hahn, Fisher, Debruine, & Jones, 2016; Re & Perrett, 2014).
Limitations
The effect of chronic between-meal snacks on attractiveness could be confounded by a variable not considered in this work. One possibility could be physical activity, which could have the effect of both increasing attractiveness (Faurie, Pontier, & Raymond, 2004; Stephen, Coetzee, Smith, & Perrett, 2009) and increasing between-meal snacks (Kerver, Yang, Obayashi, Bianchi, & Song, 2006; Ovaskainen et al., 2006). Other diet factors not taken into account could affect facial attractiveness, such as fruit and vegetable known to increase skin yellowness (Zuniga, Stevenson, Mahmut, & Stephen, 2017; Appleton et al., 2018). Also, the main and more complex meals, i.e. lunch and dinner, were not included, precluding the computation of an overall diet quality index, which could have possibly captured other aspects of diet influencing attractiveness. However, diet quality indexes are
380 381 382 383 384 385 386 387 388 389 390 391 392 393 394 395 396 397 398 399 400 401 402 403
correlated with low-GL food (higher values for an increase of low-GL food, see e.g. Jones et al. 2016; Azadbakht et al. 2016), and thus are partially described by GL measures. Finally, energy intake of each meal was not controlled for in our model due to the high correlation observed with glycaemic load, but gave qualitatively similar results when integrated alone (Table S1). As a consequence, it is unclear whether the associations observed are due to energy intake or to glycaemic load.
Conclusion
The recent dietary change, and particularly the new refined carbohydrate-rich diet, has well-known detrimental health consequences. Non-medical traits also are apparently affected in healthy women and men, as refined carbohydrate consumption seems not independent of facial attractiveness, a trait with important social consequences. Further studies are needed to investigate whether other non-medical traits, but with non-negligible social importance, could also be impacted.
References
Alvergne, A., & Lummaa, V. (2010). Does the contraceptive pill alter mate choice in humans? Trends
in Ecology & Evolution, 25, 171-179.
Appleton, K. M., McGrath, A. J., McKinley, M. C., Draffin, C. R., Hamill, L. L., Young, I. S., & Woodside, J. V. (2018). The value of facial attractiveness for encouraging fruit and vegetable consumption : Analyses from a randomized controlled trial. BMC Public Health, 18, 298.
Atkinson, F. S., Foster-Powell, K., & Brand-Miller, J. C. (2008). International tables of glycemic index and glycemic load values: 2008. Diabetes care, 31, 2281-2283.
Azadbakht, L., Mohammadifard, N., Akhavanzanjani, M., Taheri, M., Golshahi, J., & Haghighatdoost,
404 405 406 407 408 409 410 411 412 413 414 415 416 417 418
F. (2016). The association between dietary glycemic index, glycemic load and diet quality indices in Iranian adults : Results from Isfahan Healthy Heart Program. International Journal of Food
Sciences and Nutrition, 67, 161-169.
Bakel, M. M. E. van, Kaaks, R., Feskens, E. J. M., Rohrmann, S., Welch, A. A., Pala, V., … Slimani, N. (2009). Dietary glycaemic index and glycaemic load in the European Prospective Investigation into Cancer and Nutrition. European Journal of Clinical Nutrition, 63, S188-S205.
Barr, D. J., Levy, R., Scheepers, C., & Tily, H. J. (2013). Random effects structure for confirmatory hypothesis testing: Keep it maximal. Journal of Memory and Language, 68, 255-278.
Bellisle, F. (2014). Meals and snacking, diet quality and energy balance. Physiology & Behavior, 134, 38-43.
Bellisle, F., Dalix, A. M., Mennen, L., Galan, P., Hercberg, S., de Castro, J. M., & Gausseres, N. (2003). Contribution of snacks and meals in the diet of French adults: a diet-diary study.
Physiology & Behavior, 79, 183-189.
Bellisle, F., Hébel, P., Salmon-Legagneur, A., & Vieux, F. (2018). Breakfast consumption in French children, adolescents, and adults : a nationally representative cross-sectional survey examined in the context of the international breakfast research initiative. Nutrients, 10, 1056.
Buss, D. M. (1989). Sex differences in human mate preferences: Evolutionary hypotheses tested in 37 cultures. Behavioral and Brain Sciences, 12, 1-14.
Cao, C., Xiao, Z., Wu, Y., & Ge, C. (2020). Diet and skin aging - From the perspective of food nutrition. Nutrients, 12, 870.
Chapelot, D., Marmonier, C., Aubert, R., Gausseres, N., & Louis-Sylvestre, J. (2004). A role for glucose and insulin preprandial profiles to differentiate meals and snacks. Physiology &
Behavior, 80, 721-731.
likelihood estimator for variance parameters in multilevel models. Psychometrika, 78, 685-709. Coetzee, V., Chen, J., Perrett, D. I., & Stephen, I. D. (2010). Deciphering faces: quantifiable visual cues
to weight. Perception, 39, 51-61.
Coetzee, V., Perrett, D. I., & Stephen, I. D. (2009). Facial adiposity: a cue to health? Perception, 38, 1700-1711.
Cordain, L., Eades, M. R., & Eades, M. D. (2003). Hyperinsulinemic diseases of civilization: more than just Syndrome X. Comparative Biochemistry and Physiology Part A, 136, 95-112.
Cordain, L., Lindeberg, L., Hurtado, A. M., Hill, K., Boyd Eaton, S., & Brand- Miller, J. (2002). Acne vulgaris: a disease of Western civilization. Archives of Dermatology, 138, 1584-1590.
Cordain, Loren, Eaton, S. B., Brand Miller, J., Lindeberg, S., & Jensen, C. (2002). An evolutionary analysis of the aetiology and pathogenesis of juvenile-onset myopia. Acta Ophthalmologica
Scandinavica, 80, 125-135.
Cordain, L., Eaton, S. B., Sebastian, A., Mann, N., Lindeberg, S., Watkins, B. A., … Brand-Miller, J. (2005). Origins and evolution of the Western diet: health implications for the 21st century. The
American Journal of Clinical Nutrition, 81, 341-354.
Cosgrove, M. C., Franco, O. H., Granger, S. P., Murray, P. G., & Mayes, A. E. (2007). Dietary nutrient intakes and skin-aging appearance among middle-aged American women. The American Journal
of Clinical Nutrition, 86, 1225-1231.
Craft, S. (2007). Insulin resistance and Alzheimer’s disease pathogenesis: potential mechanisms and implications for treatment. Current Alzheimer Research, 4, 147-152.
Danby, F. W. (2010). Nutrition and aging skin: sugar and glycation. Clinical Dermatology, 28, 409-411. Dixson, B. J. W., Lee, A. J., Sherlock, J. M., & Talamas, S. N. (2017). Beneath the beard: do facial morphometrics influence the strength of judgments of men’s beardedness? Evolution and Human
Eastwick, P. W., Luchies, L. B., Finkel, E. J., & Hunt, L. L. (2014). The predictive validity of ideal partner preferences: a review and meta-analysis. Psychological Bulletin, 140, 623-665.
Eleazu, C. O. (2016). The concept of low glycemic index and glycemic load foods as panacea for type 2 diabetes mellitus; prospects, challenges and solutions. African Health Sciences, 16, 468-479. Faurie, C., Pontier, D., & Raymond, M. (2004). Student athletes claim to have more sexual partners
than other students. Evolution and Human Behavior, 25, 1-8.
Fiennes, R. (1965). Atherosclerosis in wild animals. In Comparative atherosclerosis. The morphology
of spontaneous and induced atherosclerotic lesions in animals and its relation to human disease
(p. 113-126). Edited by J.C. Roberts, R. Straus and M.S. Cooper. New York: Harper & Row. Foster-Powell, K., Holt, S. H., & Brand-Miller, J. C. (2002). International table of glycemic index and
glycemic load values: 2002. The American journal of clinical nutrition, 76, 5-56.
Garine, I. de, & Koppert, G. J. A. (1990). Social adaptation to season and uncertainty in food supply. In G. A. Harrison & J. C. Waterlow (Éd.), Diet and disease in traditional and developing societies (p. 240-289). Cambridge: Cambridge University Press. (Centre IRD de Bondy).
Garine, I., & Koppert, G. J. A. (1991). Guru‐fattening sessions among the Massa. Ecology of Food
and Nutrition, 25, 1-28.
Gentreau, M., Chuy, V., Féart, C., Samieri, C., Ritchie, K., Raymond, M., … Artero, S. (2020). Refined-carbohydrate diet is associated with long-term risk of dementia and Alzheimer’s disease in Apolipoprotein E ε4 allele carriers. Alzheimer’s & Dementia, 1-11.
Han, C., Hahn, A. C., Fisher, C. I., Debruine, L. M., & Jones, B. C. (2016). Women’s facial attractiveness is related to their body mass index but not their salivary cortisol. American Journal
of Human Biology, 28, 352-355.
Harrell, J. (2015). Regression modeling strategies: with applications to linear models, logistic and ordinal regression, and survival analysis. Springer.
Hätönen, K. A., Virtamo, J., Eriksson, J. G., Sinkko, H. K., Sundvall, J. E., & Valsta, L. M. (2011). Protein and fat modify the glycaemic and insulinaemic responses to a mashed potato-based meal.
The British Journal of Nutrition, 106, 248-253.
Hellstrom, W. J. G., Overstreet, J. W., Sikka, S. C., Denne, J., Ahuja, S., Hoover, A. M., … Whitaker, J. S. (2006). Semen and sperm reference ranges for men 45 Years of age and older. Journal of
Andrology, 27, 421-428.
Hu, F. B., Van Dam, R. M., & Liu, S. (2001). Diet and risk of type II diabetes: the role of types of fat and carbohydrate. Diabetologia, 44, 805-817.
Jellinger, P. S. (2007). Metabolic consequences of hyperglycemia and insulin resistance. Clinical
Cornerstone, 8, S30-S42.
Jencks, C., & And Others. (1979). Who Gets Ahead? The Determinants of Economic Success in
America. New York: Basic Books.
Johnson, R. J., Segal, M. S., Sautin, Y., Nakagawa, T., Feig, D. I., Kang, D.-H., … Sánchez-Lozada, L. G. (2007). Potential role of sugar (fructose) in the epidemic of hypertension, obesity and the metabolic syndrome, diabetes, kidney disease, and cardiovascular disease. The American Journal
of Clinical Nutrition, 86, 899-906.
Jones, M., Barclay, A. W., Brand-Miller, J. C., & Louie, J. C. Y. (2016). Dietary glycaemic index and glycaemic load among Australian children and adolescents : Results from the 2011–2012 Australian Health Survey. British Journal of Nutrition, 116, 178-187.
Kerver, J. M., Yang, E. J., Obayashi, S., Bianchi, L., & Song, W. O. (2006). Meal and Snack Patterns Are associated with dietary intake of energy and nutrients in US adults. Journal of the American
Dietetic Association, 106, 46-53.
Key, T. J., Schatzkin, A., Willett, W. C., Allen, N. E., Spencer, E. A., & Travis, R. C. (2004). Diet, nutrition and the prevention of cancer. Public Health Nutrition, 7, 187-200.
Kong, A., Frigge, M. L., Masson, G., Besenbacher, S., Sulem, P., Magnusson, G., … Stefansson, K. (2012). Rate of de novo mutations and the importance of father’s age to disease risk. Nature, 488, 471-475.
Lee, A. J., Mitchem, D. G., Wright, M. J., Martin, N. G., Keller, M. C., & Zietsch, B. P. (2014). Genetic factors that increase male facial masculinity decrease facial attractiveness of female relatives.
Psychological Science, 25, 476-484.
Lutz, S. Z., Wagner, R., Fritsche, L., Peter, A., Rettig, I., Willmann, C., … Heni, M. (2019). Sex-specific associations of testosterone with metabolic traits. Frontiers in Endocrinology, 10, 90. Manzel, A., Muller, D. N., Hafler, D. A., Erdman, S. E., Linker, R. A., & Kleinewietfeld, M. (2013).
Role of “Western diet” in inflammatory autoimmune diseases. Current Allergy and Asthma
Reports, 14, 1-8.
Monro, J. A., & Shaw, M. (2008). Glycemic impact, glycemic glucose equivalents, glycemic index, and glycemic load: definitions, distinctions, and implications. The American Journal of Clinical
Nutrition, 87, 237S-243S.
Nishizawa, T., Akaoka, I., Nishida, Y., Kawaguchi, Y., Hayashi, E., & Yoshimura, T. (1976). Some factors related to obesity in the Japanese sumo wrestler. The American Journal of Clinical
Nutrition, 29, 1167-1174.
Nkengne, A., Bertin, C., Stamatas, G. N., Giron, A., Rossi, A., Issachar, N., & Fertil, B. (2008). Influence of facial skin attributes on the perceived age of Caucasian women. Journal of the
European Academy of Dermatology and Venereology, 22, 982-991.
Ovaskainen, M.-L., Reinivuo, H., Tapanainen, H., Hannila, M.-L., Korhonen, T., & Pakkala, H. (2006). Snacks as an element of energy intake and food consumption. European Journal of Clinical
Nutrition, 60, 494-501.
appearance and electoral success in the 2008 congressional elections. American Politics
Research,42, 1096-1117.
Purba, M. B., Kouris-Blazos, A., Wattanapenpaiboon, N., Lukito, W., Rothenberg, E. M., Steen, B. C., & Wahlqvist, M. L. (2001). Skin wrinkling : Can food make a difference? Journal of the
American College of Nutrition, 20, 71-80.
Puts, D. A., Jones, B. C., & DeBruine, L. M. (2012). Sexual selection on human faces and voices. The
Journal of Sex Research, 49, 227-243.
Re, D. E., & Perrett, D. I. (2014). The effects of facial adiposity on attractiveness and perceived leadership ability. Quarterly Journal of Experimental Psychology, 67, 676-686.
Ritts, V., Patterson, M. L., & Tubbs, M. E. (2016). Expectations, impressions, and judgments of physically attractive students: a review. Review of Educational Research, 62, 413-426.
Rosseel, Y. (2012). lavaan: An R package for structural equation modeling. Journal of Statistical
Software, 48, 1-36.
Samson, N., Fink, B., & Matts, P. J. (2010). Visible skin condition and perception of human facial appearance. International Journal of Cosmetic Science, 32, 167-184.
Scott, I. M. L., Pound, N., Stephen, I. D., Clark, A. P., & Penton-Voak, I. S. (2010). Does masculinity matter? The contribution of masculine face shape to male attractiveness in humans. PLoS ONE,
5, e13585.
Spencer, E. A., Appleby, P. N., Davey, G. K., & Key, T. J. (2003). Diet and body mass index in 38 000 EPIC-Oxford meat-eaters, fish-eaters, vegetarians and vegans. International Journal of Obesity,
27, 728-734.
Stephen, I. D., Coetzee, V., Smith, M. L., & Perrett, D. I. (2009). Skin blood perfusion and oxygenation colour affect perceived human health. PLOS ONE, 4, e5083.
on glycaemia and insulinaemia to a white rice-based meal in healthy adults. European Journal of
Nutrition, 53, 1719-1726.
Sun, L., Goh, H. J., Govindharajulu, P., Leow, M. K.-S., & Henry, C. J. (2020). Postprandial glucose, insulin and incretin responses differ by test meal macronutrient ingestion sequence (PATTERN study). Clinical Nutrition, 39, 950-957.
Tiddeman, B. P., Stirrat, M. R., & Perrett, D. I. (2005). Towards realism in facial image transformation: results of a wavelet MRF method. Computer Graphics Forum, 24, 449-456.
Touger-Decker, R., & Van Loveren, C. (2003). Sugars and dental caries. The American journal of
clinical nutrition, 78, 881S-892S.
Zelditch, M. L., Swiderski, D. L., & Sheets, H. D. (2012). Geometric Morphometrics for Biologists: A
Primer. Academic Press.
Zuniga, A., Stevenson, R. J., Mahmut, M. K., & Stephen, I. D. (2017). Diet quality and the attractiveness of male body odor. Evolution and Human Behavior, 38, 136-143.
Zuur, A. F., Ieno, E. N., & Elphick, C. S. (2010). A protocol for data exploration to avoid common statistical problems. Methods in Ecology and Evolution, 1, 3-14.
419 420 421 422 423
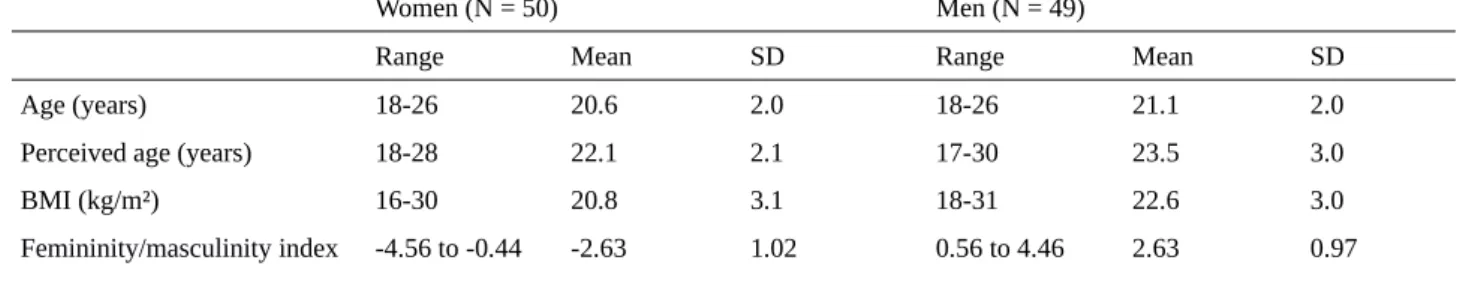
Table 1. Descriptive statistics of the physical characteristics of the women and men used as stimuli.
Women (N = 50) Men (N = 49)
Range Mean SD Range Mean SD Age (years) 18-26 20.6 2.0 18-26 21.1 2.0 Perceived age (years) 18-28 22.1 2.1 17-30 23.5 3.0 BMI (kg/m²) 16-30 20.8 3.1 18-31 22.6 3.0
Femininity/masculinity index -4.56 to -0.44 -2.63 1.02 0.56 to 4.46 2.63 0.97
424
425 426
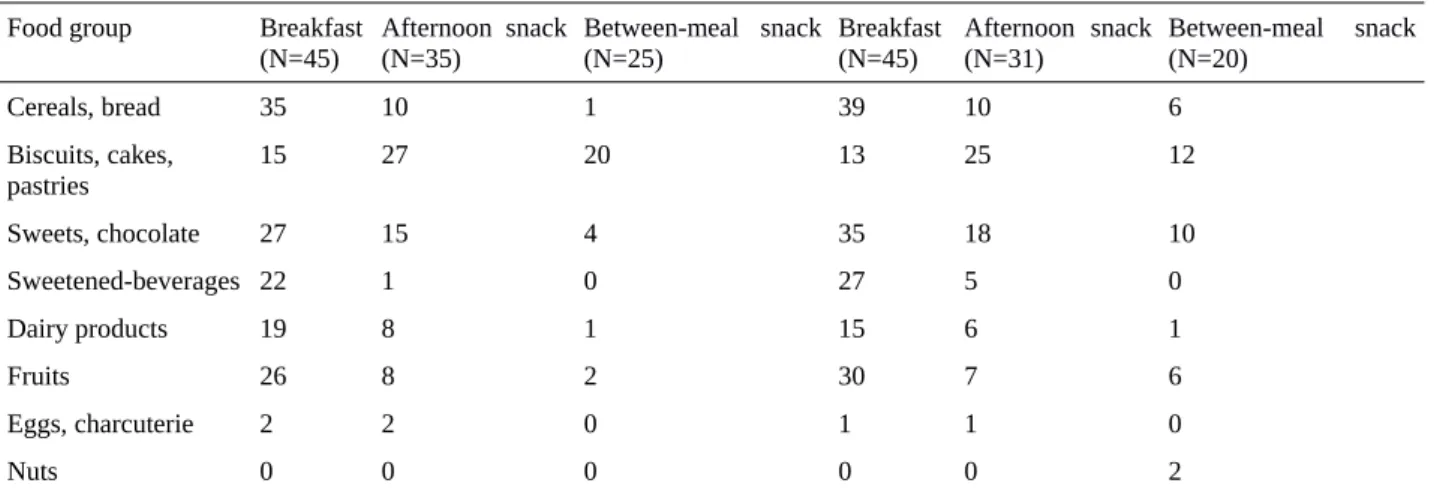
Table 2. Number of individuals consuming the different food groups for each meal. N indicates the number of
consumers among the 50 women, or among the 49 men subjects.
Women Men
Food group Breakfast
(N=45) Afternoon snack(N=35) Between-meal snack(N=25) Breakfast(N=45) Afternoon snack(N=31) Between-meal snack(N=20)
Cereals, bread 35 10 1 39 10 6 Biscuits, cakes, pastries 15 27 20 13 25 12 Sweets, chocolate 27 15 4 35 18 10 Sweetened-beverages 22 1 0 27 5 0 Dairy products 19 8 1 15 6 1 Fruits 26 8 2 30 7 6 Eggs, charcuterie 2 2 0 1 1 0 Nuts 0 0 0 0 0 2 427 428 429
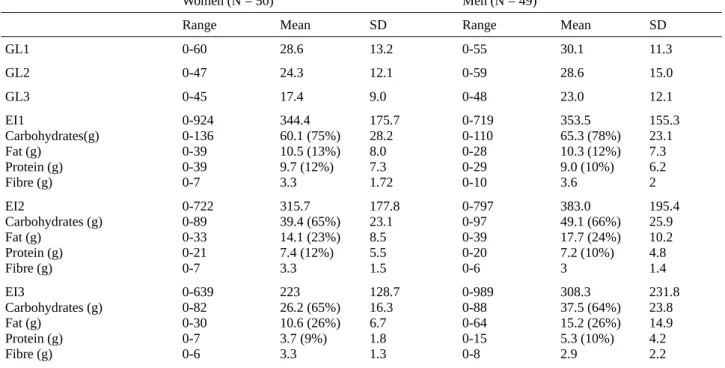
Table 3. Descriptive statistics of food consumption for the three meals. Mean and standard deviation (SD) are
given for consumers only. GL1, GL2 and GL3 are the three variables of glycaemic load. EI1, EI2 and EI3 are the three variables of energy intake (Kcal).
Women (N = 50) Men (N = 49)
Range Mean SD Range Mean SD GL1 0-60 28.6 13.2 0-55 30.1 11.3 GL2 0-47 24.3 12.1 0-59 28.6 15.0 GL3 0-45 17.4 9.0 0-48 23.0 12.1 EI1 Carbohydrates(g) Fat (g) Protein (g) Fibre (g) 0-924 0-136 0-39 0-39 0-7 344.4 60.1 (75%) 10.5 (13%) 9.7 (12%) 3.3 175.7 28.2 8.0 7.3 1.72 0-719 0-110 0-28 0-29 0-10 353.5 65.3 (78%) 10.3 (12%) 9.0 (10%) 3.6 155.3 23.1 7.3 6.2 2 EI2 Carbohydrates (g) Fat (g) Protein (g) Fibre (g) 0-722 0-89 0-33 0-21 0-7 315.7 39.4 (65%) 14.1 (23%) 7.4 (12%) 3.3 177.8 23.1 8.5 5.5 1.5 0-797 0-97 0-39 0-20 0-6 383.0 49.1 (66%) 17.7 (24%) 7.2 (10%) 3 195.4 25.9 10.2 4.8 1.4 EI3 Carbohydrates (g) Fat (g) Protein (g) Fibre (g) 0-639 0-82 0-30 0-7 0-6 223 26.2 (65%) 10.6 (26%) 3.7 (9%) 3.3 128.7 16.3 6.7 1.8 1.3 0-989 0-88 0-64 0-15 0-8 308.3 37.5 (64%) 15.2 (26%) 5.3 (10%) 2.9 231.8 23.8 14.9 4.2 2.2 430 431 432 433
Table 4. Effects of different variables on the probability of being chosen during the test of attractiveness for
male or female faces. Raters were instructed to choose the individual found to be the most attractive between two facial photographs. GL1, GL2 and GL3 are the three variables of glycaemic load. For each variable, the difference between the two individuals presented was integrated into the model. The estimate (β), standard error of the mean (SE), χ2 statistic, and corresponding P-value are given. Bold characters indicate significant (P <
0.05) effects.
Male faces evaluated by female raters Female faces evaluated by male raters
β SE χ2 P(>χ2) β SE χ2 P(>χ2) Intercept 0.074 0.173 -0.208 0.165 GL1 0.132 0.148 0.799 0.371 -0.195 0.176 1.228 0.268 GL2 -0.001 0.154 0.001 0.992 0.106 0.170 0.392 0.531 GL3 0.564 0.171 10.79 0.001 0.468 0.174 7.226 0.007 Age 0.445 0.159 7.843 0.005 0.284 0.229 1.539 0.215 BMI -0.399 0.172 5.359 0.021 -0.792 0.168 22.35 < 10-5 Scholarship level -0.170 0.147 1.345 0.246 0.105 0.171 0.376 0.540 Smoker 0.273 0.251 0.893 0.345 -0.259 0.252 1.055 0.304 Age departure from actual age 0.401 0.167 5.883 0.015 -0.415 0.191 4.708 0.030
Femininity/masculinity index 0.069 0.162 0.183 0.669 -0.298 0.168 3.139 0.076 Contraceptive Pill - - - - -0.252 0.281 0.800 0.371 434 435 436 437 438 439
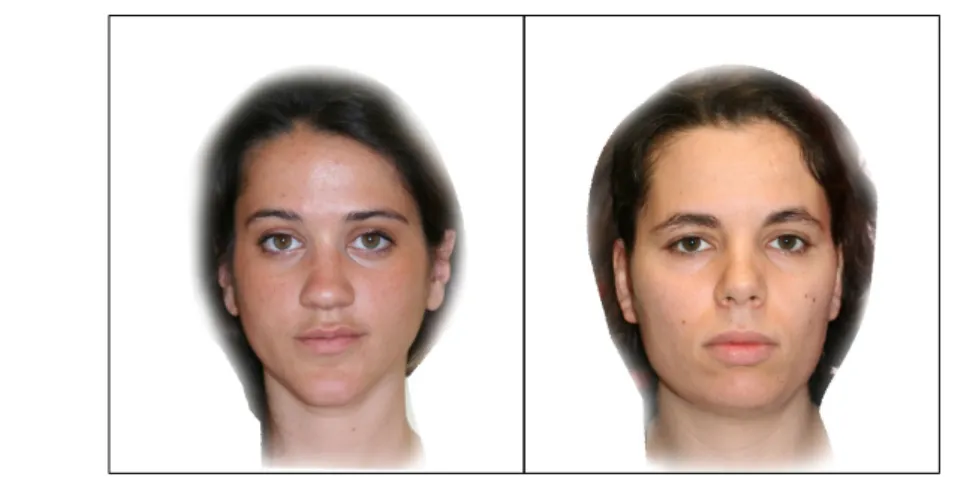
Figure 1. Example of a pair of faces used during evaluation of women’s facial attractiveness by male
raters. For each pair of women, the rater was instructed to click on the photograph of the woman that he found the most attractive. Photographs reproduced with permission.
440 441 442 443 444 445 446 447 448 449 450 451
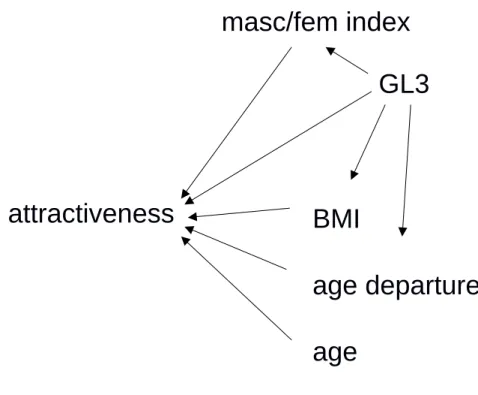
Figure 2. Hypothesised path model to explain attractiveness with the variables of the generalised linear mixed
model. Only independent variables displaying P < 0.1 are considered. For men, the variable fem/masc index representing the femininity/masculinity index is not present.
attractiveness
BMI
age departure
age
GL3
masc/fem index
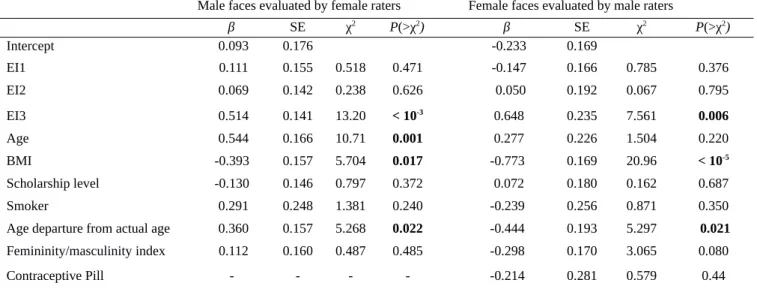
452 453 454 455 456 457 458 459 460 461 462 463 464 465 466 467 468 469 470 471 472 473 474 475Table S1. Effects of different variables on the probability of being chosen during the test of attractiveness for
male or female faces. Raters were instructed to choose the individual found to be the most attractive between two facial photographs. EI1, EI2 and EI33 are the three variables of energy intake. For each variable, the difference between the two individuals presented was integrated into the model. The estimate (β), standard error of the mean (SE), χ2 statistic, and corresponding P-value are given. Bold characters indicate significant (P <
0.05) effects.
Male faces evaluated by female raters Female faces evaluated by male raters
β SE χ2 P(>χ2) β SE χ2 P(>χ2) Intercept 0.093 0.176 -0.233 0.169 EI1 0.111 0.155 0.518 0.471 -0.147 0.166 0.785 0.376 EI2 0.069 0.142 0.238 0.626 0.050 0.192 0.067 0.795 EI3 0.514 0.141 13.20 < 10-3 0.648 0.235 7.561 0.006 Age 0.544 0.166 10.71 0.001 0.277 0.226 1.504 0.220 BMI -0.393 0.157 5.704 0.017 -0.773 0.169 20.96 < 10-5 Scholarship level -0.130 0.146 0.797 0.372 0.072 0.180 0.162 0.687 Smoker 0.291 0.248 1.381 0.240 -0.239 0.256 0.871 0.350 Age departure from actual age 0.360 0.157 5.268 0.022 -0.444 0.193 5.297 0.021
Femininity/masculinity index 0.112 0.160 0.487 0.485 -0.298 0.170 3.065 0.080 Contraceptive Pill - - - - -0.214 0.281 0.579 0.44 476 477 478 479 480 481 482 483 484