HAL Id: hal-00330265
https://hal.archives-ouvertes.fr/hal-00330265
Submitted on 3 Sep 2007HAL is a multi-disciplinary open access
archive for the deposit and dissemination of sci-entific research documents, whether they are pub-lished or not. The documents may come from teaching and research institutions in France or abroad, or from public or private research centers.
L’archive ouverte pluridisciplinaire HAL, est destinée au dépôt et à la diffusion de documents scientifiques de niveau recherche, publiés ou non, émanant des établissements d’enseignement et de recherche français ou étrangers, des laboratoires publics ou privés.
Gross community production and metabolic balance in
the South Pacific Gyre, using a non intrusive bio-optical
method
Hervé Claustre, Y. Huot, I. Obernosterer, B. Gentili, D. Tailliez, M. Lewis
To cite this version:
Hervé Claustre, Y. Huot, I. Obernosterer, B. Gentili, D. Tailliez, et al.. Gross community production and metabolic balance in the South Pacific Gyre, using a non intrusive bio-optical method. Biogeo-sciences Discussions, European GeoBiogeo-sciences Union, 2007, 4 (5), pp.3089-3121. �hal-00330265�
BGD
4, 3089–3121, 2007Gross community production in the South Pacific Gyre
H. Claustre et al. Title Page Abstract Introduction Conclusions References Tables Figures ◭ ◮ ◭ ◮ Back Close
Full Screen / Esc
Printer-friendly Version Interactive Discussion
EGU Biogeosciences Discuss., 4, 3089–3121, 2007
www.biogeosciences-discuss.net/4/3089/2007/ © Author(s) 2007. This work is licensed
under a Creative Commons License.
Biogeosciences Discussions
Biogeosciences Discussions is the access reviewed discussion forum of Biogeosciences
Gross community production and
metabolic balance in the South Pacific
Gyre, using a non intrusive bio-optical
method
H. Claustre1, Y. Huot1, I. Obernosterer2, B. Gentili1, D. Tailliez1, and M. Lewis3
1
CNRS, Laboratoire d’oc ´eanographie de Villefranche, 06230 Villefranche-sur-Mer, France; Universit ´e Pierre et Marie Curie-Paris 6, Laboratoire d’oc ´eanographie de Villefranche, 06230 Villefranche-sur-Mer, France
2
Universit ´e Pierre et Marie Curie-Paris6, UMR7621, F66650 Banyuls-sur-Mer, France; CNRS, UMR7621, 66650 Banyuls-sur-Mer, France
3
Department of Oceanography, Dalhousie University, Halifax, Nova Scotia B3H 4J1, Canada Received: 30 July 2007 – Accepted: 7 August 2007 – Published: 3 September 2007
BGD
4, 3089–3121, 2007Gross community production in the South Pacific Gyre
H. Claustre et al. Title Page Abstract Introduction Conclusions References Tables Figures ◭ ◮ ◭ ◮ Back Close
Full Screen / Esc
Printer-friendly Version Interactive Discussion
EGU
Abstract
The very clear waters of the South Pacific Gyre likely constitute an end-member of oligotrophic conditions which remain essentially unknown with respect to its impact on carbon fixation and exportation. We describe a non-intrusive bio-optical method to quantify the various terms of a production budget (Gross Community Production,
5
community losses, net community production) in this area. This method is based on the analysis of the diel cycle in Particulate Organic Carbon (POC), derived from high frequency measurements of the particle attenuation coefficient cp. We report very high
integrated rates of Gross Community Production within the euphotic layer (average of 846±484 mg C m−2d−1 for 17 stations) that are far above any rates determined using
10
incubation techniques for such areas. Furthermore we show that the daily production of POC is essentially balanced by the losses so that the system cannot be considered as net heterotoph. Our results thus agree well with geochemical methods, but not with incubation studies based on oxygen methods. We stress to the important role of deep layers, below the euphotic layer, in contributing to carbon fixation when incident
15
irradiance at the ocean surface is high (absence of cloud coverage). These deep lay-ers, not considered up to now, might fuel a part of the heterotrophic processes in the upper layer, in particular through dissolved organic carbon release. We further demon-strate that, in these extremely clear and stratified waters, integrated Gross Community Production is proportional to the POC content and surface irradiance via an efficiency
20
indexψ∗
GCP, the water column cross section for Gross Community Production. We
fi-nally discuss our results in the context of the role of oligotrophic gyre in global carbon budget and of the possibility of using optical proxy from space for the development of gross community rather than primary production global models.
BGD
4, 3089–3121, 2007Gross community production in the South Pacific Gyre
H. Claustre et al. Title Page Abstract Introduction Conclusions References Tables Figures ◭ ◮ ◭ ◮ Back Close
Full Screen / Esc
Printer-friendly Version Interactive Discussion
EGU
1 Introduction
Subtropical gyres are vast oceanic oligotrophic biomes representing 60% of the global ocean. Their metabolic state (magnitude of carbon fixation vs. respiration rates) and, consequently, their role in the global oceanic carbon cycle is still being debated (del Giorgio et al., 1997; Williams, 1998) which finds its roots in early discussions about the
5
magnitude of carbon fixation in these systems (Jenkins, 1982; Lewis et al., 1986; Jenk-ins, 1988). On one hand, and based on in vitro biological techniques performed in the euphotic zone and having characteristic time scales of ∼1 day, it is generally concluded that the ocean is in a net heterotrophic state: rates of carbon fixation are low and the whole community respiration rate (R) exceeds the gross primary production (GPP) (del
10
Giorgio et al., 1997; del Giorgio and Duarte, 2002), so that the so-called Net Commu-nity Production (NCP=GPP–R) is always negative. On the other hand, studies based on geochemical tracer distributions with larger relevant space/time scales support net production and export rates one order of magnitude higher (Jenkins, 1982; Jenkins, 1988; Lewis et al., 1986). As a result, the upper ocean ecosystems are considered
15
on average to be autotrophic which suggests that in vitro experiments are affected by biases or not representative of larger space or time scales. Modelling studies conclude that mesoscale activity and the so-called eddy-pumping processes cannot explain the discrepancies between both approaches (Oschlies, 2002), and that unaccounted bi-ological processes, such as N2-fixation (Gruber, 2005), export of dissolved organic
20
carbon (Dietze and Oschlies, 2005) or episodic primary production events generally missed by classical sampling strategies (Karl et al., 2003; Williams et al., 2004), may be responsible. It has been suggested that primary production rates are as much as 3–5 times higher in these vast ocean regions than what has been estimated using clas-sical strategies/methods (Karl et al., 2003). Given the vast extent of the oligotrophic
25
gyres, the implications for carbon dynamics at the global scale are profound.
Siegel et al. (1989) presented the first data of a daily cycle in the attenuation co-efficient, cp, a proxy of particle load, in the upper layers (>100 m) of the oligotrophic
BGD
4, 3089–3121, 2007Gross community production in the South Pacific Gyre
H. Claustre et al. Title Page Abstract Introduction Conclusions References Tables Figures ◭ ◮ ◭ ◮ Back Close
Full Screen / Esc
Printer-friendly Version Interactive Discussion
EGU waters of the North Pacific Gyre. Increase of particle load was observed during
day-time, while a decrease of similar amplitude was observed during nighday-time, allowing the conclusion that particle production was balanced at the daily scale. At the western bor-der of the South Pacific Gyre (SPG, precisely at 150◦W, 16◦S), similar observations were obtained by Claustre et al. (1999) down to 160 m. Furthermore, as cp can be
5
calibrated into Particulate Organic Carbon (POC) concentration (e.g. Gardner et al., 1993; Loisel and Morel, 1998; Claustre et al., 1999), daily cycle incp likely embeds information into the various terms involved in the upper ocean carbon budget. Thus, the first aim of the present study is to develop a method, based on the analysis of the daily cycle in optically-resolved POC, allowing to quantify the various terms of the
10
production budget in an oligotrophic area.
The South Pacific Gyre (SPG) is likely the most oligotrophic oceanic area (Claus-tre and Maritorena, 2003) of the global ocean with the clearest waters ever reported (Morel et al., 2007) associated with undetectable surface nitrate and the deepest nitr-acline (Raimbault et al., 2007). Obviously, any conclusion reached about the carbon
15
production terms in this oligotrophic condition end-member might constitute a reference for subtropical gyres as a whole. Therefore, as part of the BIOSOPE cruise (Claustre et al., 20071) which was carried out in the South East Pacific and crossed the SPG in its most oligotrophic part, we here focus on the analysis and interpretation of the diel cycle incpfor a ∼3000 km subset of the transect where the oligotrophic conditions
20
appeared to be the most extreme.
1
Claustre, H., Sciandra, A., and Vaulot, D.: Introduction to the special section: bio-optical and biogeochemical conditions in the South East Pacific in late 2004 – the BIOSOPE program. Biogeosciences Discuss., in preparation, 2007.
BGD
4, 3089–3121, 2007Gross community production in the South Pacific Gyre
H. Claustre et al. Title Page Abstract Introduction Conclusions References Tables Figures ◭ ◮ ◭ ◮ Back Close
Full Screen / Esc
Printer-friendly Version Interactive Discussion
EGU
2 Methods
2.1 Cruise description and station selection
The BIOSOPE cruise onboard RV Atalante took place during austral summer from 26 October to 11 December 2004 from Marquesas Island toward the Chilean coast. The ∼8000 km transect encompassed a wide range of hydrodynamic and trophic conditions
5
(Claustre et al., 20071). Two types of stations were investigated (Fig. 1), the so-called long (more than 2 days of occupation) and short (less than one day of occupation) stations (Claustre et al., 20071). For the present study we will mainly focus on the most oligotrophic waters. They are here defined as those waters for which the eu-photic zone depth (the depth where the Photosynthetically Available Radiation (PAR,
10
in the visible range 400–700 nm) is reduced to 1% of its surface value) is greater than 100 m. Actually such criteria delineates waters with surface Chlorophyll a (Chla) con-centration lower than ∼0.08 mgm−3 (Morel et al., 2007, equation in the legend of their
Fig. 9). Such waters represent ∼30% of the global ocean (Antoine et al., 2005, their Fig. 8). In the area investigated during BIOSOPE, these oligotrophic stations include
15
the long station GYR (Fig. 1), west of Easter Island. We will focus on this station to develop our approach and apply it elsewhere. From the real-time ocean color im-ages, this station was selected as having the lowest surface Chla concentration (see also supplementary information http://www.biogeosciences-discuss.net/4/3089/2007/ bgd-4-3089-2007-supplement.pdf). The GYR station was occupied for five days and
20
eight casts a day were performed. Additionally, 13 “oligotrophic” short stations (St2 to St15 and St19, Fig. 1) were investigated and at least three casts were performed during the day period.
2.2 Particle attenuation coefficient : treatment and significance
The attenuation coefficient, c (m−1) was determined using a Wetlabs C-star
transmis-25
BGD
4, 3089–3121, 2007Gross community production in the South Pacific Gyre
H. Claustre et al. Title Page Abstract Introduction Conclusions References Tables Figures ◭ ◮ ◭ ◮ Back Close
Full Screen / Esc
Printer-friendly Version Interactive Discussion
EGU cast was performed down to 500 m. Data treatment was performed as described in
Loisel and Morel (1998) and Claustre et al. (1999). Briefly, in order to take into account any possible variation due to changes in the cleanliness of the optical window, attenu-ation coefficient profiles were corrected assuming that deep waters are optically stable and close to pure water (c=0.364 m−1). The average attenuation coefficient between
5
450 and 500 m was thus taken as a reference for each cast.
In open ocean waters, the beam attenuation coefficient at 660 nm measured by a transmissiometer, once corrected for absorption by pure water, is essentially a mea-surement of the attenuation coefficient by particles, cp(m−1), because absorption
coef-ficients by dissolved material is negligible at this wavelength (Loisel and Morel, 1998).
10
Furthermore, the absorption by particles (detrital and vegetal) is also negligible so that cpis equivalent to the particle scattering coefficient. Thus, the main source of variation incpis the numerical abundance and size of particles while second order sources are refractive index and shape of particles (Gardner et al., 1993). For a standard particle size distribution (Junge type with a –4 exponent), the particles to which the
transmis-15
siometer is most sensitive lie in the 0.5–10µm size range (Stramski and Kiefer, 1991) which typically corresponds to the size domain of the living (pico- and nanophytoplank-ton, cyanobacteria, heterotrophic and photo-heterotrophic bacteria pico- and nano-zooplankton,) and non-living particles (detritus). It has been suggested (Morel, 1988) and subsequently verified (e.g. Gardner et al., 1993 ; Loisel and Morel, 1998; Claustre
20
et al., 1999) that cp is linearly related to POC (mg m−3). Some significant regional
differences in this relationship have been reported. In particular a relationship with a slope of 502 mg C m−3m−1 was reported for the North western part of South Pacific
gyre (Claustre et al., 1999) which was at least twice as large as those found for other oceanic regions (Siegel et al., 1989; Walsh et al., 1995). As part of the present study
25
and using 35 simultaneouscpand POC measurements, the high slope was confirmed
(POC=502 cp+ 10) and also recently corroborated by new regional relationships
ob-tained for the North Pacific Gyre (slope = 560) and the equatorial Pacific (slope = 552) (Gardner et al., 2006). Therefore, the slightly rounded relationship POC = 500 cp
pro-BGD
4, 3089–3121, 2007Gross community production in the South Pacific Gyre
H. Claustre et al. Title Page Abstract Introduction Conclusions References Tables Figures ◭ ◮ ◭ ◮ Back Close
Full Screen / Esc
Printer-friendly Version Interactive Discussion
EGU posed by Claustre et al. (1999) is adopted for the present study. This conversion factor
is equivalent to an attenuation cross section of 2 m2gC−1. 2.3 Other measurements
Total sun radiation was measured onboard (every min) using an Eppley pyranometer. PAR (in energy units) was subsequently derived, assuming it represents 43% of the
5
total irradiance at the ocean surface.
For the pigment analysis, 5.6 L of seawater were filtered onto GF/F filters which were subsequently stored in liquid nitrogen. Within 3 months after collection, pigments were extracted in methanol and analyzed by HPLC using a method dedicated for low con-centration samples (Ras et al., 20072). The HPLC absorbance detector was also set at
10
770 nm to detect bacteriochlorophylla (Bchla) (limit of quantitation of 0.0004 mg m−3).
The euphotic zone limit, Ze (m) was derived from in situ radiometric measurements using an LICOR irradiance profiler (Morel et al., 2007). On some occasions, when ir-radiances measurements were not performed, Ze was derived from the vertical profile of Chla (Ras et al., 20072).
15
For the determination of POC, up to 8.2 L of seawater were collected from Niskin bottles and filtered onto precombusted GF/F filters. Carbon analysis was performed using a CEC 440HA Organic Elemental Analyzer after the filters had been treated with 0.25 ml of 10% HCl to remove inorganic carbon (Stramski et al., 20073).
On two occasions at the GYR station (12 November and 14 November), net
com-20
munity production and community respiration were measured using 24-h light and dark incubations, respectively, of unfiltered seawater in 120-ml biological oxygen demand
2
Ras, J., Uitz, J., and Claustre, H.: Spatial variability of phytoplankton pigment distribution in the South East Pacific, Biogeosciences Discuss., in preparation, 2007.
3
Stramski, D., Reynolds, R. A., Babin, M., Claustre, H., Kaczmarek, S., Lewis, M. R., Rottgers, R., Sciandra, A., Stramska, M., and Twardowski, M. S.: Relationships between the particulate organic carbon concentration and optical properties of surface waters in the South East Pacific and Atlantic Oceans, Biogeosciences Discuss., in preparation, 2007.
BGD
4, 3089–3121, 2007Gross community production in the South Pacific Gyre
H. Claustre et al. Title Page Abstract Introduction Conclusions References Tables Figures ◭ ◮ ◭ ◮ Back Close
Full Screen / Esc
Printer-friendly Version Interactive Discussion
EGU (BOD) bottles. Seawater was collected at six depths in the upper 200 m and in situ
in-cubations started at 06:00 a.m. The BOD bottles were filled by siphoning the seawater from 10-L acid-rinsed polycarbonate (PC) carboys, using silicon tubing and allowing the BOD bottles to overflow. Prior to sampling, the BOD bottles were rinsed with 1N HCl, Milli-Q water and seawater (3x) from the respective depth layer. Measurements of
5
net community production and respiration were performed in five replicate BOD bottles. Gross primary production and community respiration were calculated as the difference between the initial and final dissolved oxygen concentrations in the light and dark in-cubations, respectively. The concentration of dissolved oxygen was determined by Winkler titration of whole bottles. Titration was done with an automated
potentiomet-10
ric end-point detection system (Metrohm DMS 716). The mean standard error of the oxygen concentration determination was 0.15µmole O2L−1 (coefficient of variation of
0.061%).
3 Results and discussion
3.1 Main patterns observed along the transect
15
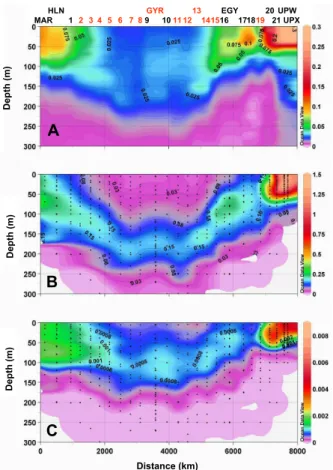
The main hydrodynamic patterns crossed along the BIOSOPE transect are described elsewhere (Claustre et al., 20071). The distribution in cp (Fig. 2) is in accordance with these patterns. At both extremities, in the vicinity of Marquesas islands (west) and associated with the Peru Chile Current (east), highcpvalues are recorded in the
upper layers (up to 0.5 m−1 in the upwelling conditions off the Chilean coast). In the
20
central part of the transect (∼km 2000 to km 4500), associated with undetectable ni-trates in the 0–150 m layer (Raimbault et al., 2007), low surface Chla and the presence of a pronounced deep Chla maximum (DCM, sometimes extending to 180 m and be-low), cp takes its lowest values, especially at st7 and st8. St7 indeed represents the
clearest waters (Morel et al., 2007) with the euphotic zone depth extending down to
25
maxi-BGD
4, 3089–3121, 2007Gross community production in the South Pacific Gyre
H. Claustre et al. Title Page Abstract Introduction Conclusions References Tables Figures ◭ ◮ ◭ ◮ Back Close
Full Screen / Esc
Printer-friendly Version Interactive Discussion
EGU mum incparound ∼100 m. The distribution of cpin this layer roughly parallels that of
BChla, an indicator of photoheterotrophs performing anoxygenic photosynthesis. East-wards, outside the core of the oligotrophic part of the Gyre, station 19 still presents oligotrophic characteristics with an euphotic zone depth of ∼105 m, surface Chla of ∼0.06 mg m−3andcp<0.06 m−1in the upper layer. Actually, nutrient distribution at this
5
station (∼2.8 mM at the surface) reveals that it corresponds to a High Nutrient Low Chla situation (Raimbault et al., 2007; Claustre et al., 20071).
3.2 POC budget at the daily cycle: case study at the GYR station 3.2.1 The various terms of the budget
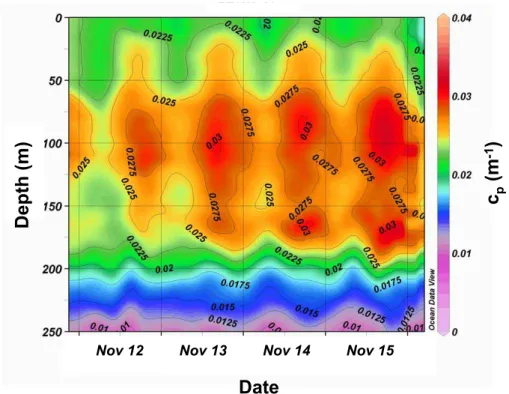
At the GYR station, high frequency CTD transmissiometry measurements allow the
10
variations ofcpto be highlighted at the daily scale (Fig. 3). Thecpmeasurements
dis-played conspicuous daily variations with a sunrise minimum and sunset maximum, an observation previously reported for other oligotrophic and mesotrophic areas (Siegel et al., 1989; Claustre et al., 1999). While this cycle was detectable down to 220–240 m, there are two zones in the upper layer where it is stronger: the zone of the DCM and the
15
layer around ∼100 m (zone of BChla maximum, see Fig. 2). Once calibrated in terms of POC and integrated over pre-defined layers (Fig. 4), the clear increase of POC during the day followed by a decrease of roughly similar amplitude during nightime, suggests that production and loss of POC are balanced over 24 h (see also supplementary infor-mation). In a less oligotrophic part of the South Pacific Gyre (16◦S 150◦W, with surface
20
concentration of ∼ 0.07 mg Chla m−3), it was demonstrated that phytoplankton does not contribute to more than 20% of thecp-derived POC (Claustre et al., 1999). As part of BIOSOPE, this value was confirmed by Grob et al. (2007) throughout the gyre. If phytoplankton alone would be responsible of the daily change in POC, this would im-ply uncomfortably high growth rates (Claustre et al., 1999). Therefore, it is suggested
25
that the increase in POC reported here not only reflects the sole photo-autotrophic production of POC but also the POC production by other heterotrophic components
BGD
4, 3089–3121, 2007Gross community production in the South Pacific Gyre
H. Claustre et al. Title Page Abstract Introduction Conclusions References Tables Figures ◭ ◮ ◭ ◮ Back Close
Full Screen / Esc
Printer-friendly Version Interactive Discussion
EGU of the microbial community (actually the production of living particles that are seen
by a transmissiometer). Given that the increase in POC occurs during the day, the increase of heterotrophic biomass thus appears also stimulated (positively related) to photo-trophic processes. We thus propose that a budget of the various production and loss terms can be derived from the variations in the integrated content in POC at the
5
daily scale (Fig. 5).
Over a given oceanic layer, the light stimulated Gross Community Production (GCP, mg C m−2 d−1) seen by a transmissiometer, is here defined as the sum of Gross
Pri-mary Production (GPP, excluding dissolved production) and of the production by the microbial (heterotrophic) community. The Net Community Production (NCP, mg C m−2
10
d−1) represents the difference between GCP and community losses (CL, mg C m−2
d−1, the consequence of grazing, viral lysis, settling, and respiration rates).
NCP=GCP−CL (1)
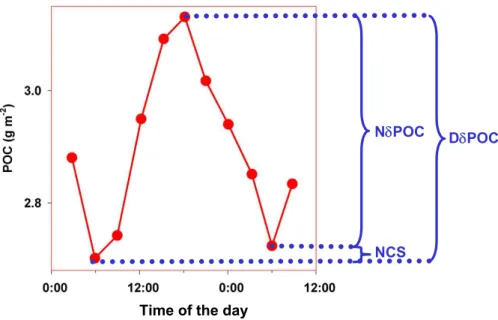
For the duration of the night period (Nt, d), the Gross Community Production is null, so the night time decrease in POC, NδPOC (mg m−2, taken as a positive number), can
15
be considered as an estimation of CL : CL=NδPOC
Nt (2)
rearranging Eq. (1) and (2): GCP=NCP +NδPOC
Nt (3)
At this stage, another constraint can be imposed, which is derived from the observation
20
of Fig. 4. Actually, over a full day, the daily increase in POC, DδPOC (mg m−2) roughly
balances NδPOC. NCP presents slight positive and negative variations from day to day at station GYR (Fig. 4). However, over the 4 days of investigation the average NCP is not significantly different from zero. Defining the Net Carbon Stock (NCS , mg m−2)
(Fig. 5) as the product of NCP by a given time interval (day), null NCP implies:
25
BGD
4, 3089–3121, 2007Gross community production in the South Pacific Gyre
H. Claustre et al. Title Page Abstract Introduction Conclusions References Tables Figures ◭ ◮ ◭ ◮ Back Close
Full Screen / Esc
Printer-friendly Version Interactive Discussion
EGU It comes that :
DδPOC=NδPOC (5)
Applying this new constraint, the equation can be finally rewritten as:
GCP=DδPOC 1−Nt =
NδPOC
Nt (6)
Thus, only the increase (decrease) in POC during day (night) time and the night (day)
5
length are required to estimate GCP. 3.2.2 Model development
The sampling frequency at the GYR station was sufficient to encompass the full range of day-night variations in POC. This was not the case for other stations (see Fig. 2) which were sampled only 3 times during daytime. To obtain GCP from these data,
10
we need to provide additional information in the form of simple model. We base this model on the rather regular daily variations in POC observed at the GYR station, which suggests that they can be accurately modelled using an empirical formulation. A poly-nomial of third degree was chosen with the following constraints. The rates of change of POC are equal to zero at sunrise (tsr, h) and sunset (tss, h), respectively, and
maxi-15
mal (inflexion point) at noon (tno, h). Using these constraints, the time variation in POC,
POC(t), can be modelled as:
[POC(t)] = [POCtno] + RPOCtno(t − tno)
" 1 − (t − tno) 2 3 (tsr − tno)2 # (7)
where [POCtno] (mg m−2) and RPOCtno (mg m−2 h−1) represents the [POC] content and the instantaneous production in [POC] at noon (tno, h), respectively. Actually,
20
RPOCtno represents the maximal instantaneous rate of change in POC. Equation (7) was fitted to the GYR data using the Gauss-Newton method. The model performs well
BGD
4, 3089–3121, 2007Gross community production in the South Pacific Gyre
H. Claustre et al. Title Page Abstract Introduction Conclusions References Tables Figures ◭ ◮ ◭ ◮ Back Close
Full Screen / Esc
Printer-friendly Version Interactive Discussion
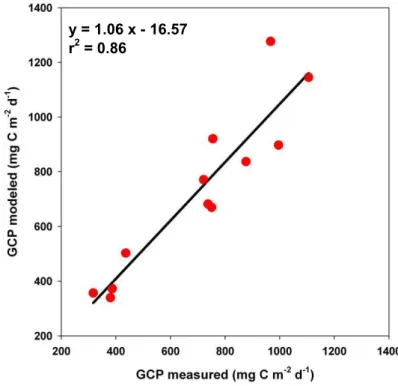
EGU for the four days of investigation and for the 3 layers investigated (Fig. 6). Actually fitted
GCP compares well with measured GCP estimated from the difference between the minimal and maximal values (Fig. 7).
3.3 Gross and net community production in oligotrophic regimes
The average GCP within the euphotic zone over four diel cycles is ∼734 (±97) mg C
5
m−2 d−1 (Table 1). This production is balanced by losses [721 (±159) mg C m−2d−1], and average NCP (over 4 days) is not significantly different from zero.
On days 1 and 3, using classical measurements of O2 changes in light/dark bottles
incubated over a 24-h period, Gross Primary Production (O2-GPP) and Community Respiration (O2-CR) were determined in the euphotic zone. O2-GPP, once converted
10
to carbon units with a photosynthetic quotient of 1.1 (Laws, 1991), is significantly lower [473 (±223) mg C m−2 d−1] than GCP (Table 1). By contrast, and assuming a
respi-ratory quotient of 1.1, the CR of 768 (±65) mg C m−2 d−1 is in the same range as the loss rates determined by the optical method.
The net community production computed solely using O2measurements leads to the
15
usual conclusion that the upper ocean is in metabolic deficit (O2-NCP = –295 (±158)
mg C m−2 d−1) (Table 1). Being the most oligotrophic oceanic region, it is not surpris-ing that our O2based production rates are lower than those previously reported for the less oligotrophic North Pacific Gyre [O2-GPP = 657 (±52) mg C m−2 d−1; O
2-CR =
920 (±39) mg C m−2 d−1]. Our O2-NCP values for the SPG are however essentially
20
equivalent to those for the North Pacific Gyre [–270 (±49) mg C m−2 d−1]. Contrary to incubation methods, our optical method is non-intrusive as are geochemical ap-proaches. In addition, unlike geochemical observations, we integrate over the same time scales (hours to day) as incubation measurements.
When the model is applied to all oligotrophic stations (using only three
measure-25
ments a day), the high GCP values recorded at GYR are confirmed (Fig. 8). On av-erage, GCP amounts 452±264, 846±484 and 1093±520 mg C m−2d−1 for 0–0.5 Ze,
BGD
4, 3089–3121, 2007Gross community production in the South Pacific Gyre
H. Claustre et al. Title Page Abstract Introduction Conclusions References Tables Figures ◭ ◮ ◭ ◮ Back Close
Full Screen / Esc
Printer-friendly Version Interactive Discussion
EGU 0-Ze and 0–1.5 Ze layers, respectively. These high in situ estimates are comparable
to the very high values of GPP (greater than 1 g m−2d−1) reported at station ALOHA
using an in situ, non-intrusive technique based on triple oxygen isotope measurements (Juranek and Quay, 2005). Our results, when compared to other BIOSOPE results, remain, however, higher than primary production rates measured at the GYR station
5
using O2in vitro techniques. Furthermore these rates are much higher that the average
rates derived for all the oligotrophic stations, using in vitro incubation with either13C labelling (Raimbault and Garcia, 2007) (180±60 mg C m−2d−1) or 14C labelling (Van Wambeke et al., 2007) (153±48 mg C m−2d−1). It should be noted, that contrarily to
the O2-based method, those measurements based on isotope labelling do not take
10
into consideration Dissolved Organic Carbon (DOC) excretion, a process which can be of major significance in such systems (see below).
While optical measurements indicate that POC production is roughly balanced over five days, consistent with geochemical approaches, the oxygen measurements imply net heterotrophy. We argue that photosynthetic processes occurring in extremely dim
15
light conditions could explain the missing ∼300 mg C m−2d−1 estimated with O2
mea-surements (Table 1) to obtain the balanced production observed by the optical ap-proaches.
Significant production rates were recorded in the deep layer (160–240 m) where the remaining light represents between 1% and 0.1% of surface radiation, i.e. below the so
20
called euphotic zone (Table 2). A diurnal trend was not observed in this layer during our first day on this station, which had experienced overcast conditions for at least 2 days (Fig. 4). A clear cycle became apparent, however, in the last three days (13 to 15 November). SPG surface waters are the clearest of the global ocean (Morel et al., 2007); thus short term fluctuations in surface irradiance are reflected in the 160–240 m
25
layer. They undoubtedly impact photosynthesis (and hence GCP) at these depths. This process was previously suggested for highly stratified oligotrophic systems (Karl et al., 2002) but had been never evidenced. Actually in this deep layer, the GCP increased by a factor of seven over the four days of investigation (from 45 mg to 319 mg C m−2d−1)
BGD
4, 3089–3121, 2007Gross community production in the South Pacific Gyre
H. Claustre et al. Title Page Abstract Introduction Conclusions References Tables Figures ◭ ◮ ◭ ◮ Back Close
Full Screen / Esc
Printer-friendly Version Interactive Discussion
EGU (Table 2). Over the same period, GCP in the euphotic zone increased by 34% reflecting
to some extent saturation of photosynthesis at high light intensities. Furthermore, on some days (e.g. cycle 4, 15 November), production in the deep layer could account for more than the average discrepancy between the oxygen and optical method observed for the 0–160 m layer. Over the 4 days of investigation, the mean GCP in this deep
5
layer (176 mg C m−2d−1, Table 2) accounts for ∼60% of this discrepancy. About 40% of this discrepancy remains to be explained.
The concentration of dissolved organic carbon (DOC) in the euphotic layer (∼120 µM) is the highest ever reported (Raimbault et al., 2007) for a subtropical gyre. It is indeed about 20% higher than maximal values reported for the North Pacific Gyre
10
(Church et al., 2002), and values as high as 90µM were still recorded at the 0.1% of surface radiation. Most of this DOC is likely of refractory nature and given the shape of the profile, these high concentrations must result from local production accumu-lating over time. For the North Pacific Gyre, it has been advanced that phototrophic production of DOC could represent up to 50% of GPP (Karl et al., 1998). The
opti-15
cal method does not measure this dissolved fraction. However, in a tightly coupled system with a rapid turnover, the fraction of this dissolved production is labile and can fuel heterotrophic and photo-heterotrophic production in the SPG, especially during the daylight period (Church et al., 2004; Karl et al., 1998).
We observed a peak in cp at ∼100 m that is not associated with any Chla features
20
(Fig. 2), and which shows clear daily oscillations and thus contribute to GCP. Thiscp maximum is collocated with the BChla maximum lying 80 m above the Chla maximum, a feature present throughout a large part of the SPG. BChla-containing bacteria can use both light and dissolved organic material to sustain their growth and carbon re-quirements (Sieracki et al., 2006). However, their photosynthesis is anoxygenic
(Sier-25
acki et al., 2006; Kolber et al., 2001), and thus not accounted for by measurements based on changes in oxygen. Furthermore, besides photoheterotrophy performed by these BChla-containing bacteria, it is very likely that other photoheterotrophic organ-isms might intervene in POC build-up (Church et al., 2004; Beja et al., 2001). These
BGD
4, 3089–3121, 2007Gross community production in the South Pacific Gyre
H. Claustre et al. Title Page Abstract Introduction Conclusions References Tables Figures ◭ ◮ ◭ ◮ Back Close
Full Screen / Esc
Printer-friendly Version Interactive Discussion
EGU processes might be particularly important in the nutrient impoverished environments
of subtropical gyres (Karl, 2002). We therefore suggest that part of the apparent metabolic unbalance reported for the euphotic zone of SPG and more generally of subtropical oligotrophic gyres based on in vitro oxygen techniques could be due to unaccounted photoheterotrophic processes, including anoxygenic carbon fixation
pro-5
cesses. These processes would be sustained by deep (below the euphotic zone) pho-tosynthesis intracellular products, which would represent the required organic source that is often referred to when trying to understand the metabolic unbalance of these systems (e.g. del Giorgio et al., 1997).
The fact that, in these extremely clear oligotrophic waters, processes below the
so-10
called euphotic zone (1% depth) have not to date received much attention, might be surprising. Indeed, even if it is widely recognized that the deep chlorophyll maximum prevailing in oligotrophic gyres might be in large part the result of photo-adaptation processes, its presence nevertheless remains a clear indication that oxygen photosyn-thesis does occur in deep layers. Actually, at the GYR station, more than 60% of the
15
water Chla content was located in the layer comprised between the euphotic depth (Ze) and 1.5 Ze. Other studies did not succeed to measure production (O2, 14C) in very deep layer (below Ze). This is very likely linked to the difficulty of keeping “deep samples” in extremely dim light (not to say dark) conditions during sample processing at sea. We suggest here that in most cases, deep populations receive unavoidable
20
light damage during their sampling, manipulation and bottle deployment at sea. Our optical method, operating at the same time scale than in vitro measurements, is not intrusive (like geochemical ones) and thus avoid any light hazard of that sort.
During the present investigation, surface irradiance varied tremendously, by a factor of 6 (more than the seasonal variation in surface irradiance) over 6 days.
Neverthe-25
less, the investigated area remained in metabolic balance (even in slight autotrophic state) which means that such highly stratified systems have a large capacity to adapt and to stabilize their metabolic status under strongly variable environmental conditions (here light, which is likely the most important forcing variable in subtropical oligotrophic
BGD
4, 3089–3121, 2007Gross community production in the South Pacific Gyre
H. Claustre et al. Title Page Abstract Introduction Conclusions References Tables Figures ◭ ◮ ◭ ◮ Back Close
Full Screen / Esc
Printer-friendly Version Interactive Discussion
EGU gyres).
3.4 Potential extrapolation of our observations
The estimations based on the bio-optical method presented here were conducted at a location and a period representative for the most extreme oligotrophic conditions of the global ocean (see supplementary information). In this context, the rates estimated
5
for this maximum of oligotrophy can be considered as a minimum reference for olig-otrophic gyres in general (60% of the global ocean). From the GCP rates measured (846±484 mg C m−2d−1) the annual carbon fixation rates for subtropical gyres are thus estimated to be at least 67 Pg for the euphotic layer. These values are equivalent or higher than estimates derived from bio-optical models for the global ocean (Antoine et
10
al., 1996; Behrenfeld et al., 2005). The subtropical gyres, therefore, might have a much larger impact than anticipated on ocean carbon cycle.
Furthermore, we believe that the method presented here is potentially useful in the context of bio-optical modelling of production. Bio-optical models for the estimation of depth integrated primary production are of the general form :
15
P = PAR(0+) × B × Ψ (8)
which expresses that the carbon fixation rate P (g C m−2 d−1) is proportional to the product of the column integrated content of the biomass (B) of phototrophic organism by the irradiance at the ocean surface, PAR(0+). B is generally depicted by areal Chla (mg Chla m−2
). Ψ is an efficiency term which convolves the irradiance absorption
ca-20
pability of B together with its efficiency in converting absorbed photons into chemical energy. Depending on the units chosen for PAR(0+) (quanta- or energy based), differ-ent ways of expressing Ψ have been proposed (Falkowski, 1981; Malone, 1987; Morel, 1991). The most simple expression of Ψ is achieved when B is expressed in terms of integrated Chlaconcentration and PAR(0+) is expressed in MJ m−2d−1 and converted
25
BGD
4, 3089–3121, 2007Gross community production in the South Pacific Gyre
H. Claustre et al. Title Page Abstract Introduction Conclusions References Tables Figures ◭ ◮ ◭ ◮ Back Close
Full Screen / Esc
Printer-friendly Version Interactive Discussion
EGU as :
Ψ∗= 39P/[PAR(0+)Chla] (9)
Ψ∗ (m2 g Chla −1) is here defined as the Chla specific water column photosynthetic
cross section. For the global ocean, within the layer comprised between the sur-face and 1.5 Ze, Ψ* varies within a relatively narrow range around a central value of
5
Ψ*=0.070±0.035 m2 gChla−1. This means that 7% of the incident PAR is converted
into stored chemical energy when 1g of Chla is present in the upper lit layers.
All the studies investigating such bulk water column efficiency indexes have only considered the biomass of photo-autotrophic organisms depicted by Chla. The present study clearly demonstrates that phytoplankton alone cannot explain the daily increase
10
in particulate carbon; heterotrophs (bacteria and possibly pico and nano-heterotrophs) as well as photo-heterotrophs also participate in this process. From Fig. 8, it is clear that GCP in all investigated layers appear to be reduced in the vicinity of 120◦W, when surface irradiance was drastically reduced (2 MJ m−2 d−1 vs an average value over 10 MJ m−2d−1 for the other stations). Figure 9 provides an analyses, for each layer,
15
of the possible dependency of GCP with respect to biomass (here expressed in POC) and surface irradiance. Clearly GCP appears proportional to the product of POC and surface irradiance. This coupling suggests that, in the same way that a photosynthetic cross section was defined earlier, the Gross Community Production cross section with respect to carbon can be defined, Ψ*GCP:
20
Ψ∗
GCP=39GCP/[PAR(0
+)POC] (10)
Actually the slopes of the regression presented in Fig. 9 have units of m2MJ−1. Using the conversion factor (between energy and carbon), Ψ*GCPis estimated to 2.28×10⁻³,
1.63×10⁻³ and 1.63×10⁻³m2g C−1 for 0–0.5 Ze, 0-Ze and 0–1.5 Ze layers,
respec-tively. In other words, ∼0.2% of the surface irradiance is converted to chemical energy
25
when 1 g of POC is present. If the values are normalized by the generic 0.07 m2g Chla−1 for photosynthetic cross section a reasonable POC/Chla ratio of ∼40 is
esti-BGD
4, 3089–3121, 2007Gross community production in the South Pacific Gyre
H. Claustre et al. Title Page Abstract Introduction Conclusions References Tables Figures ◭ ◮ ◭ ◮ Back Close
Full Screen / Esc
Printer-friendly Version Interactive Discussion
EGU mated within the 0–1.5 Ze layer. This represents, at least, a partial validation of the
estimations.
Beside the estimation of a carbon- rather than a Chla-based water column efficiency for production, the present approach has also a potential interest for the bio-optical modelling of production. Recently, it has been proposed that carbon-based, rather than
5
Chla-based, models could be an improved way to estimate the rate of ocean carbon fixation from remote sensing data (Behrenfeld et al., 2005). The premise of carbon-based models is that the particle backscattering coefficient, bbp, retrieved from space
is an (accurate) estimation of phytoplankton carbon. This assumption is, however, questionable. Indeed, optical proxies (eithercpof bbp) derived either from space or in
10
situ measurements are primarily related to the particle load (POC content in oceanic waters). This includes, together with phytoplankton, heterotrophic components (bac-teria, flagellates) and also bio-detritus; thus, their relationship to phytoplankton carbon is not straightforward, if any exists. Therefore, because community production likely integrates the contribution of all organisms depicted by bbp, the proper rate of carbon
15
fixation that should be associated with this optical proxy of particle load would better be the community production rather than the sole primary production.
It is interesting to note that using the carbon-based model, Behrenfeld et al. (2005) ends up with much higher primary production rates for the tropical ocean than using a Chla-based model, while the discrepancies are much lower for other oceanic
ar-20
eas. One possibility for such discrepancies is that phytoplankton carbon derived from space would be overestimated in tropical environments; some dedicated studies have indeed clearly shown that the contribution of phytoplankton to cp can be low in such
oligotrophic environment (Claustre et al., 1999). The production rates derived for these environments would possibly be more closely related to gross community
(phytoplank-25
ton and small heterotrophs) rather than to primary production rates.
Based on the use of optical proxies of biogenic particles (not exclusively phytoplank-ton) from space, we thus believe that bio-optical model of Gross Community Production (GCP) would thus likely provide a more reliable estimate of carbon fixation, especially
BGD
4, 3089–3121, 2007Gross community production in the South Pacific Gyre
H. Claustre et al. Title Page Abstract Introduction Conclusions References Tables Figures ◭ ◮ ◭ ◮ Back Close
Full Screen / Esc
Printer-friendly Version Interactive Discussion
EGU in oligotrophic tropical environments where microbial communities play en essential
role. Indeed, GCP is a photo-driven process which, besides the POC formation by phytoplankton, also integrates DOC excretion and its subsequent use by microbial or-ganisms. DOC release is certainly a key process (see Karl et al., 1998) that would require much more attention in view of implementing such models.
5
Acknowledgements. We thank the captain and crew of the R/V Atalante for their pleasant
co-operation during the BIOSOPE cruise. C. Marec is warmly thanked for their efficient help in CTD rosette management. We are grateful to D. Stramski for providing POC data used for the calibration of the attenuation coefficient and J. Ras for pigment data. This is a contribu-tion of the BIOSOPE project of the LEFE-CYBER program. This research was funded by the 10
Centre National de la Recherche Scientifique (CNRS), the Institut des Sciences de l’Univers (INSU), the Centre National d’Etudes Spatiales (CNES), the European Space Agency (ESA), The National Aeronautics and Space Administration (NASA) and the Natural Sciences and Engineering Research Council of Canada (NSERC).
References
15
Antoine, D., Andr ´e, J. M., and Morel, A.: Oceanic primary production 2. Estimation at global scale from satellite (coastal zone color scanner) chlorophyll, Global Biogeochemical Cycles, 10, 57–69, 1996.
Antoine, D., Morel, A., Gordon, H. R., Banzon, V. F., and Evans, R. H.: Bridging ocean color observations of the 1980’s and 2000’s in search of long-term trends, J. Geophys. Res., 110, 20
C06009, doi:10.10219/2004JC002620, 2005.
Behrenfeld, M. J., Boss, E., Siegel, D. A., and Shea, D. M.: Carbon-based ocean produc-tivity and phytoplankton physiology from space, Global Biogeochem. Cycles, 19, GB1006, doi:10.1029/2004GB002299, 2005.
Beja, O., Spudich, E. N., Spudich, J. L., Leclerc, M., and DeLong, E. F.: Proteorhodopsin 25
phototrophy in the ocean, Nature, 411, 786–789, 2001.
Church, M. J., Ducklow, H., and Karl, D.: Multiyear increases in dissolved organic matter inven-tories at station ALOHA in the North Pacific Gyre, Limnol. Oceanogr., 47, 1–10, 2002.
BGD
4, 3089–3121, 2007Gross community production in the South Pacific Gyre
H. Claustre et al. Title Page Abstract Introduction Conclusions References Tables Figures ◭ ◮ ◭ ◮ Back Close
Full Screen / Esc
Printer-friendly Version Interactive Discussion
EGU
Church, M. J., Ducklow, H. W., and Karl, D. A.: Light dependence of [H-3]leucine incorporation in the oligotrophic North Pacific ocean, Appl. Environ. Microbiol., 70, 4079–4087, 2004. Claustre, H. and Maritorena, S.: The many shades of ocean blue, Science, 302, 1514–1515,
2003.
Claustre, H., Morel, A., Babin, M., Cailliau, C., Marie, D., Marty, J. C., Tailliez, D., and Vaulot, D.: 5
Variability in particle attenuation and chlorophyll fluorescence in the Tropical Pacific: Scales, patterns, and biogeochemical implications, J. Geophys. Res., 104, 3401–3422, 1999. del Giorgio, P. A. and Duarte, C. M.: Respiration in the open ocean, Nature, 420, 379–384,
2002.
del Giorgio, P. A., Cole, J. J., and Cimbleris, A.: Respiration rates in bacteria exceed phyto-10
plankton production in unproductive aquatic systems, Nature, 385, 148–151, 1997.
Dietze, H. and Oschlies, A.: Modeling abiotic production of apparent oxygen utilisation in the oligotrophic subtropical North Atlantic, Ocean Dyn., 55, 28–33, 2005.
Falkowski, P. G.: Light-shade adaptation and assimilation numbers, J. Plankton Res., 3, 203– 216, 1981.
15
Gardner, W. D., Walsh, I. D., and Richardson, M. J.: Biophysical forcing of particle production and distribution during a spring bloom in the North Atlantic. Deep Sea Research Part II: Topical Studies in Oceanography, 40, 171–195, 1993.
Gardner, W. D., Mishonov, A. V., and Richardson, M. J.: Global POC concentrations from in-situ and satellite data. Deep Sea Research Part II: Topical Studies in Oceanography, 53, 20
718–740, 2006.
Grob, C., Ulloa, O., Claustre, H., Alarcon, G., Huot, Y., and Marie, D.: Contribution of picoplank-ton to the particulate attenuation coefficient (cp) and organic carbon concentration (POC) in the eastern South Pacific, Biogeosciences Discuss., 4, 1461–1497, 2007.
Gruber, N.: A bigger nitrogen fix, Nature, 436, 786, 2005. 25
Jenkins, W. J.: Oxygen utilization rates in North Atlantic subtropical gyre and primary produc-tion in oligotrophic systems, Nature, 300, 246–248, 1982.
Jenkins, W. J.: Nitrate flux into the euphotic zone near Bermuda, Nature, 331, 521–523, 1988. Juranek, L. W. and Quay, P. D.: In vitro and in situ gross primary and net community
produc-tion in the North Pacific Subtropical Gyre using labeled and natural abundance isotopes of 30
dissolved O2, Global Biogeochem. Cycles, 19, GB3009, doi:10.1029/2004GB002384, 2005. Karl, D.: Hidden in a sea of microbes, Nature, 415, 590–591, 2002.
BGD
4, 3089–3121, 2007Gross community production in the South Pacific Gyre
H. Claustre et al. Title Page Abstract Introduction Conclusions References Tables Figures ◭ ◮ ◭ ◮ Back Close
Full Screen / Esc
Printer-friendly Version Interactive Discussion
EGU
production and phototrophic microbial community structure in the North Pacific subtropical gyre. Phytoplankton productivity. Carbon assimilation in marine and freshwater ecosystems, edited by: Williams, P. J. L., Thomas, D. N., and Reynolds, C. S., Blackwell publishing, 222– 264, 2002.
Karl, D., Laws, E. A., Morris, P., Williams, P. J. l., and Emerson, S.: Metabolic balance of the 5
open sea, Nature, 426, 32, 2003.
Karl, D. M., Hebel, D. V., Bjorkman, K., and Letelier, R. M.: The role of dissolved organic matter release in the productivity of the oligotrophic North Pacific Ocean, Limnol. Oceanogr., 43, 1270–1286, 1998.
Kolber, Z., Plumley, F. G., Lang, A. S., Beatty, J. T., Blankenship, R. E., VanDover, C. L., 10
Vetriani, C., Koblizek, M., Rathberger, C., and Falkowski, P. G.: Contribution of aerobic pho-toheterotrophic bacteria to the carbon cycle in the ocean, Science, 292, 2492–2495, 2001. Laws, E. A.: Photosynthetic quotients, new production and net community production in the
open ocean, Deep-Sea Res., 38, 143–167, 1991.
Lewis, M. R., Harrison, W. G., Oakey, N. S., Hebert, D., and Platt, T.: Vertical Nitrate Fluxes In 15
The Oligotrophic Ocean, Science, 224, 870–873, 1986.
Loisel, H. and Morel, A.: Light scattering and chlorophyll concentration in case 1 waters: A reexamination, Limnol. Oceanogr., 43, 847–858, 1998.
Malone, T. C.: Primary production of the ocean water column as a function of surface light intensity, Deep-Sea Res., 34, 139, 1987.
20
Morel, A.: Optical modeling of the upper ocean in relation to its biogenous matter content (Case 1 waters), J. Geophys. Res., 93, 10 749–10 768, 1988.
Morel, A.: Light and marine photosynthesis: A spectral model with geochemical and climato-logical implications, Progress Oceanogr., 26, 263–306, 1991.
Morel, A., Huot, Y., Gentili, B., Werdell, P. J., Hooker, S. B., and Franz, B. A.: Examining the 25
consistency of products derived from various ocean color sensors in open ocean (Case 1) waters in the perspective of a multi-sensor approach. Remote Sensing of Environment, in press, 2007.
Morel, A., Gentili, B., Claustre, H., Babin, M., Bricaud, A., Ras, J., and Tieche, F.: Optical properties of the “clearest” natural waters, Limnol. Oceanogr., 52, 217–229, 2007.
30
Oschlies, A.: Can eddies make ocean deserts bloom?, Global Biogeochem. Cycles, 16, 1106, doi:10.1029/2001GB001830, 2002.
BGD
4, 3089–3121, 2007Gross community production in the South Pacific Gyre
H. Claustre et al. Title Page Abstract Introduction Conclusions References Tables Figures ◭ ◮ ◭ ◮ Back Close
Full Screen / Esc
Printer-friendly Version Interactive Discussion
EGU
the South Pacific Ocean. Evidence for long-term accumulation of organic matter in nitrogen-depleted waters, Biogeosciences Discuss., accepted, 2007.
Raimbault, P. and Garcia, N.: Carbon and nitrogen uptake in the South Pacific Ocean: Evidence for efficient dinitrogen fixation and regenerated production leading to large accumulation of dissolved organic matter in nitrogen-depleted waters, Biogeosciences Discuss., accepted, 5
2007.
Siegel, D. A., Dickey, T. D., Washburn, L., Hamilton, M. K., and Mitchell, B. G.: Optical de-termination of particulate abundance and production variations in the oligotrophic ocean, Deep-Sea Res., 36, 211–222, 1989.
Sieracki, M. E., Gilg, I. C., Thier, E. C., Poulton, N. J., and Goericke, R.: Distribution of 10
planktonic aerobic anoxygenic photoheterotrophic bacteria in the northwest Atlantic, Limnol. Oceanogr., 51, 38–46, 2006.
Stramski, D. and Kiefer, D. A.: Light scattering by microorganisms in the open ocean, Progress Oceanogr., 28, 343–383, 1991.
Van Wambeke, F., Obernosterer, I., Moutin, T., Duhamel, S., Ulloa, O., and Claustre, H.: Het-15
erotrophic bacterial production in the South East Pacific: longitudinal trends and coupling with primary production, Biogeosciences Discuss., accepted, 2007.
Walsh, I. D., Chung, S. P., Richardson, M. J., and Gardner, W. D.: The diel cycle in the integrated particle load in the Equatorial Pacific: A comparison with primary production, Deep-Sea Res., 42, 465–477, 1995.
20
Williams, P. J. L., Morris, P. J., and Karl, D. M.: Net community production and metabolic balance at the oligotrophic ocean site, station ALOHA, Deep-Sea Res., 51, 1563–1578, 2004.
Williams, P. J. l. B.: The balance of plankton respiration and photosynthesis in the open oceans, Nature, 394, 55–57, 1998.
BGD
4, 3089–3121, 2007Gross community production in the South Pacific Gyre
H. Claustre et al. Title Page Abstract Introduction Conclusions References Tables Figures ◭ ◮ ◭ ◮ Back Close
Full Screen / Esc
Printer-friendly Version Interactive Discussion
EGU
Table 1. Comparative carbon production and loss rates in the South Pacific Gyre.
Process measured Rate obtained Oxygen Optical Oxygen Optical method method method method Gains O2-GPP GCP 473±223 734±97 Losses O2-CR CL 768±65 721±159 Balance O2-NCP NCP –295±158 14±73
Measurements were obtained using two techniques in the euphotic zone (0–160 m) at the GYR station. Values are expressed in mg C m−2d−1
± one standard deviation. A photosynthetic and respiratory quotient of 1.1 is assumed (Laws, 1991).
BGD
4, 3089–3121, 2007Gross community production in the South Pacific Gyre
H. Claustre et al. Title Page Abstract Introduction Conclusions References Tables Figures ◭ ◮ ◭ ◮ Back Close
Full Screen / Esc
Printer-friendly Version Interactive Discussion
EGU
Table 2. Day-to-day variations in the carbon production and loss rates in the South Pacific
Gyre. GCP CL NCP GCP Surface (0–240 m) (0–240 m) (0–240 m) (160–240 m) irradiance Cycle 1 663 607 56 45 26.6 Cycle 2 920 881 39 123 44.5 Cycle 3 911 888 23 219 38.4 Cycle 4 1148 1211 -63 319 44.4 Mean 910±198 897±247 14±53 176±119
The 240 m depth corresponds to 1.5 times the euphotic depth as traditionally defined, and is a depth where 0.1% of surface irradiance is available. Production terms are expressed in mg C m−2d−1
BGD
4, 3089–3121, 2007Gross community production in the South Pacific Gyre
H. Claustre et al. Title Page Abstract Introduction Conclusions References Tables Figures ◭ ◮ ◭ ◮ Back Close
Full Screen / Esc
Printer-friendly Version Interactive Discussion
EGU
Fig. 1. Transect of the BIOSOPE cruise superimposed on a SeaWiFS composite image of Chla
BGD
4, 3089–3121, 2007Gross community production in the South Pacific Gyre
H. Claustre et al. Title Page Abstract Introduction Conclusions References Tables Figures ◭ ◮ ◭ ◮ Back Close
Full Screen / Esc
Printer-friendly Version Interactive Discussion
EGU
HLN GYR EGY UPW
MAR 1 2 3 4 5 6 7 89 1011 12 13 141516 171819 20 UPX 21 D e p th (m ) D e p th (m ) D e p th (m ) Distance (km)
Claustre et al., Figure 2 A
B
C
Fig. 2. Distribution of key biogeochemical quantities along the BIOSOPE transect. (A) The
attenuation coefficient, cp. (B) the concentration in Chla (sum of mono- and Divinyl-Chla) (C)
the concentration in bacteriochlorophylla (mg m−3). On the upper part of panel (A) are reported the positions of stations (see also Fig. 1). The “oliogotrophic stations” examined in this study are identified in red.
BGD
4, 3089–3121, 2007Gross community production in the South Pacific Gyre
H. Claustre et al. Title Page Abstract Introduction Conclusions References Tables Figures ◭ ◮ ◭ ◮ Back Close
Full Screen / Esc
Printer-friendly Version Interactive Discussion EGU 0:00 0:00 0:00 0:00 0:00
D
e
p
th
(m
)
c
p(m
-1)
Nov 12 Nov 13 Nov 14 Nov 15
Date
Fig. 3. Daily variations in the vertical distribution ofcp within the 0–300 m layer at the GYR
BGD
4, 3089–3121, 2007Gross community production in the South Pacific Gyre
H. Claustre et al. Title Page Abstract Introduction Conclusions References Tables Figures ◭ ◮ ◭ ◮ Back Close
Full Screen / Esc
Printer-friendly Version Interactive Discussion
EGU
Fig. 4. Daily variations in integrated particulate organic carbon content, derived fromcp
mea-surements, over various optical depth intervals. Red: 0–240 m corresponds to the range of 100%–0.1% of surface irradiance; Blue: 80–160 m (10%–1%); Black: 0–80 m (100%–10%); Green: 160–240 m (1%–0.1%). Surface irradiance is plotted as a grey line and the number inside each daily irradiance cycle refers to the daily dose of photons (moles quanta m−2). The dotted square identifies the portion of the cycle which is used for the schematic presented in Fig. 5.
BGD
4, 3089–3121, 2007Gross community production in the South Pacific Gyre
H. Claustre et al. Title Page Abstract Introduction Conclusions References Tables Figures ◭ ◮ ◭ ◮ Back Close
Full Screen / Esc
Printer-friendly Version Interactive Discussion
EGU
NCS
Time of the day
NδPOC DδPOC
Fig. 5. Schematic of the various terms of the metabolic balance that can be inferred from
the diel change incpor POC. See text for definition. The data corresponds to the third cycle presented in Fig. 4 (dotted square).
BGD
4, 3089–3121, 2007Gross community production in the South Pacific Gyre
H. Claustre et al. Title Page Abstract Introduction Conclusions References Tables Figures ◭ ◮ ◭ ◮ Back Close
Full Screen / Esc
Printer-friendly Version Interactive Discussion
EGU
Fig. 6. Modelling diurnal variations in optically determined POC in various optical layers (0–
0.5 Ze, 0-Ze, 0–1.5 Ze) at the GYR station. The red dot corresponds to the original data while the blue line represents the fitting of Eq. (7) to the data.
BGD
4, 3089–3121, 2007Gross community production in the South Pacific Gyre
H. Claustre et al. Title Page Abstract Introduction Conclusions References Tables Figures ◭ ◮ ◭ ◮ Back Close
Full Screen / Esc
Printer-friendly Version Interactive Discussion
EGU
y = 1.06 x - 16.57
r2 = 0.86
Fig. 7. Comparison of fitted (using the polynomial model) and measured GCP at the GYR
BGD
4, 3089–3121, 2007Gross community production in the South Pacific Gyre
H. Claustre et al. Title Page Abstract Introduction Conclusions References Tables Figures ◭ ◮ ◭ ◮ Back Close
Full Screen / Esc
Printer-friendly Version Interactive Discussion
EGU
Fig. 8. Variations in POC and GCP in oligotrophic stations along the BIOSOPE transect. Only
oligotrophic stations reported in red in Fig. 2 are here considered. The three upper panels correspond to three optical layers (0–0.5 Ze, 0-Ze, 0–1.5 Ze). The lower panel presents daily dose of PAR.
BGD
4, 3089–3121, 2007Gross community production in the South Pacific Gyre
H. Claustre et al. Title Page Abstract Introduction Conclusions References Tables Figures ◭ ◮ ◭ ◮ Back Close
Full Screen / Esc
Printer-friendly Version Interactive Discussion
EGU
Fig. 9. The Estimation ofψ*GCP, the cross section for Growth Community Production in
olig-otrophic regime. ψ*GCPrepresents the slope of the regression between GCP and the product of surface irradiance by the carbon content. Data from station 13 have been excluded from this analysis for the 0-Ze and 0–1.5 Ze layer because internal waves have made the DCM (and the associatedcppeak) shift from above Ze to below Ze between consecutive casts.