HAL Id: hal-01623760
https://hal.archives-ouvertes.fr/hal-01623760
Submitted on 25 Oct 2017
HAL is a multi-disciplinary open access
archive for the deposit and dissemination of
sci-entific research documents, whether they are
pub-lished or not. The documents may come from
teaching and research institutions in France or
abroad, or from public or private research centers.
L’archive ouverte pluridisciplinaire HAL, est
destinée au dépôt et à la diffusion de documents
scientifiques de niveau recherche, publiés ou non,
émanant des établissements d’enseignement et de
recherche français ou étrangers, des laboratoires
publics ou privés.
information in early-phase dose-finding paediatric
studies
Caroline Petit, Adeline Samson, Satoshi Morita, Moreno Ursino, Vincent
Jullien, Emmanuelle Comets, Sarah Zohar
To cite this version:
Caroline Petit, Adeline Samson, Satoshi Morita, Moreno Ursino, Vincent Jullien, et al.. Unified
approach for extrapolation and bridging of adult information in early-phase dose-finding paediatric
studies. Statistical Methods in Medical Research, SAGE Publications, 2018, 27 (6), pp.1860-1877.
�10.1177/0962280216671348�. �hal-01623760�
Unified approach for
extrapolation and bridging of
adult information in early-phase
dose-finding paediatric studies
Journal Title XX(X):2–30
c
The Author(s) 0000
Reprints and permission:
sagepub.co.uk/journalsPermissions.nav DOI: 10.1177/ToBeAssigned www.sagepub.com/ 1
Caroline P
ETIT1, Adeline S
AMSON2, Satoshi M
ORITA3, Moreno U
RSINO1, Jérémie
2G
UEDJ4, Vincent J
ULLIEN5, Emmanuelle C
OMETS4,6, Sarah Z
OHAR13
Abstract
The number of trials conducted, and the number of patients per trial are typically small in paediatric clinical studies. This is due to ethical constraints and the complexity of the medical process for treating children. While incorporating prior knowledge from adults may be extremely valuable, this must be done carefully. In this paper, we propose a unified method for designing and analysing dose-finding trials in paediatrics, while bridging information from adults. The dose-range is calculated under three extrapolation options, linear, allometry and maturation adjustment, using adult pharmacokinetic data. To do this, it is assumed that target exposures are the same in both populations. The working model and prior distribution parameters of the dose-toxicity and dose-efficacy relationships are obtained using early-phase adult toxicity and efficacy data at several dose levels. Priors are integrated into the dose-finding process through Bayesian model selection or adaptive priors. This calibrates the model to adjust for misspecification if the adult and pediatric data are very different. We performed a simulation study which indicates that incorporating prior adult information in this way may improve dose selection in children.
dose-finding, bridging, extrapolation, adults observations, paediatrics trials, bayesian inference
1
Introduction
6Phase I dose-finding studies represent the first transition from laboratory work to a clinical setting and aim
7
to obtain reliable information on the pharmacokinetics (PK), safety and tolerability of a drug. Typically,
8
these trials are performed on healthy subjects unless the drug is intended for the treatment of malignancies
9
(i.e., oncology).
10
In paediatric clinical trials, invasive procedures are avoided or at least minimised for ethical reasons and
11
the usefulness of clinical trials in children has been widely debated over the last decades1, as highlighted
12
by two papers recently published in the journal of the American Academy for Paediatrics2;3. Several
13
authors and specialists have reported a critical need for more clinical studies in paediatrics combined with
14
an improvement in the methodologies used in practice. Some authors have argued that incorporating prior
15
knowledge from adults should help attain a better understanding of the paediatric population. However,
16
other studies have shown that children should not be considered small adults but rather a specific population
17
with a different metabolism that is not necessarily linearly related to growth1;4.
18
1
INSERM, UMRS 1138, CRC, Team 22, Univ. Paris 5, Univ. Paris 6, Paris, France.
2
LJK, UMR CNRS 5224, Univ. Grenoble Alpes, Grenoble, France.
3
Department of Biomedical Statistics and Bioinformatics, Kyoto University Graduate School of Medicine, 54 Kawahara-cho, Shogoin, Sakyo-ku, Kyoto 606-8507, Japan.
4
INSERM, IAME, UMR 1137, F-75018 Paris, France; Univ Paris Diderot, Sorbonne Paris Cité, F-75018 Paris, France.
5
Pharmacology Department, Univ. Paris 5, Sorbonne Paris Cité, Inserm U1129, HEGP, Paris, France.
6INSERM, CIC 1414, Univ. Rennes 1, Rennes, France.
Corresponding author:
Sarah Zohar INSERM UMRS 1138
Centre de Recherche des Cordeliers, Escalier D, 1er étage
15 rue de l’école de médecine 75006 Paris
For dose-finding paediatric studies, guidelines have been suggested for the choice of starting subset doses6
19
(e.g., the starting dose should equal 80% of the adult recommended dose, and these doses should then
20
be increased by 30% to obtain the subset doses). However, these recommendations are arbitrary and
21
do not rely on any scientific justifications. As a result, to improve the selection of the dose-range that
22
should be used in a paediatric study based on the use of adult information, this information should be
23
investigated through (1) the choice of the dose-range for a paediatric trial, (2) the dose-finding model and
24
(3)its parametrisation.
25
Motivating example: Erlotinib is an oral inhibitor of the epidermal growth factor receptor (EGFR)
26
tyrosine kinase that blocks cell cycle progression and can slow down tumour progression. This anticancer
27
agent was approved by the Food and Drug Administration (FDA) for the treatment of glioblastoma in
28
adults. Several early-phase trials were conducted in adults to study the toxicity and PK of this drug at
29
different dose levels7–13, and two phase I paediatric studies were conducted after the publication of the
30
results in adults. However, only a small amount of the knowledge obtained from the adult trials was used in
31
the design and planning of the paediatric trials. Geoerger et al.14used 80% of the dose recommended for
32
adults as the starting dose and incremented this dose by steps of 25 mg/m2to obtain the subset dose levels;
33
however, these researchers provided no scientific justifications for these choices. Neither the available
34
adult information nor expert opinions were used to parametrise the model-based dose-finding design.
35
Jakacki et al.15also conducted a phase I dose-finding trial for erlotinib in paediatric subjects and selected
36
the starting dose level according to the bioavailability of the solution for injection. The authors did not
37
describe the method used for the selection of the subset dose levels, and information from studies on
38
the adult population was not used to build a more appropriate trial for the paediatric population. This
39
motivating example highlights the need for the development of proper extrapolation or bridging methods
40
that should be used when prior knowledge from the adult population is available.
41
In the developmentof a dose-finding model for the paediatric population, difficulties regarding the
42
evaluation of toxicity alone (except in oncology) have led to the use of a joint model for both toxicity
43
and efficacy instead of a model that evaluates toxicity prior to efficacy. Several statistical methods are
available for the design of early stage phase I/II clinical trials. Among them, Bayesian methods, such as
45
the EFFTOX design and the bivariate Continual Reassessment Method (bCRM), have been proposed16;17.
46
Although initially used in oncology settings, these methods have also been used for studies of the paediatric
47
population18. Additionally, Broglio et al.19proposed a method in which adult and paediatric trials are
48
performed simultaneously with dose-finding models for each population that share an identical slope but a
49
different intercept. Doussau et al.6reviewed the methods that could also be used in paediatrics, such as
50
’3+3’, CRM with its modifications and EWOC.
51
The use of an adaptive dose-finding method requires thatthreecomponents be fixed prior to initiation of
52
the trial:
53
(1) Dose-range: Misspecification of the dose-range in a clinical trial can lead to inappropriate dose
54
selection and invalidation of the trial. Because children have a specific metabolism, we proposed the
55
establishment of a dose-range that is more suitable to the paediatric metabolism5. For that purpose, we 56
proposed the estimation of paediatric PK parameters from adult PK data, which are often available long
57
before data for the paediatric population are available, using extrapolation techniques, such as allometry
58
and maturation.
59
(2) Working model (WM) or initial guess of dose-toxicity and dose-efficacy relationships: Working
60
models are usually selected based on information from experts. In some cases, a unique choice of WM
61
can be misleading and result in the selection of an inappropriate dose. One approach for overcoming this
62
issue is to use several WMs for toxicity and efficacy using the bCRM20;21and to select the best model
63
with based on the Watanabe-Akaike information criteria developed by Watanabe (WAIC)22;23.
64
(3) Prior distribution of the model parameter(s) to be estimated: Although using standard non-informative
65
priors is often advised, it is difficult to assess to what degree this choice is informative or non-informative.
66
Moreover, it may be interesting to include information in the priors while controlling the informativeness
67
in cases with a small effective sample size, particularly in paediatrics. Regarding the selection of priors,
68
we considered a method developed by S. Morita24;25, which consists of evaluating the informativeness of
69
a prior in terms of the effective sample size. The more informative a prior is, the more patients are needed
to compensate for it. In a paediatric setting, where the sample size is small, this scale is a strong asset for
71
evaluating a chosen prior. However, if the chosen prior is too informative or misspecified compared with
72
the paediatric reality, a non-informative alternative should be available. In this case, we have modified
73
a method proposed by Lee et al. and Zhang et al.26;27that introduced the concept of "adaptive-prior" 74
into dose-finding studies. The idea is to be able to switch during the trial to a less informative prior if a
75
misspecification in the prior choice is detected.
76
The aim of this paper is to propose a unified approach for the design of a paediatric dose-finding clinical
77
trial through the extrapolation and bridging of information gleamed from the adult population.We have
78
gathered and modified various methods that have been developed in different fields to propose a unified
79
approach. The novelty of our work consists of the proposal of extrapolation with maturation from adult PK
80
into the definition of the dose-range (1) and of the use of adult information from several sources to better
81
parameterise the dose-finding design (2)-(3) instead of leaving these decisions to arbitrary choices.In this
82
work, severaloptionsare proposed for the selection of the dose-range, the WM and/or the parametrisation
83
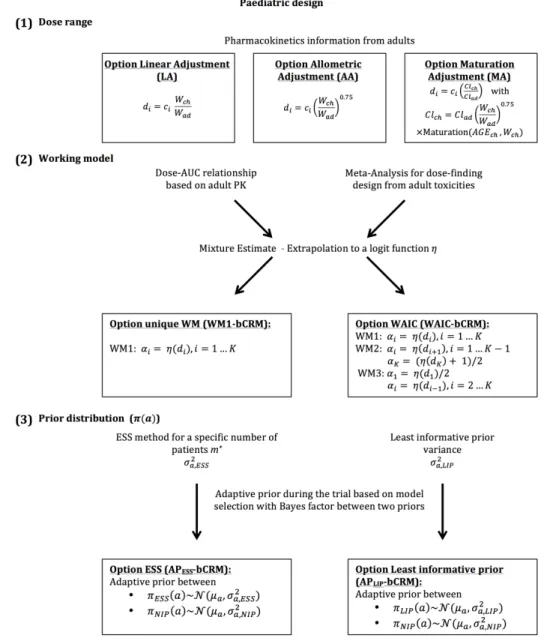
of the dose-finding design (Figure 1).Section 2 details the dose-finding model, illustrates the options for
84
specifying the dose-range and describes the parametrisation of the design using adult information. The
85
simulation settings and results are given in Sections 3 and 4. Finally, guidelines are proposed in Section 5
86
and, a discussion is provided in Section 6.
87
2
Model and methods
88
We considered the design of a phase I/II clinical trial in the paediatric population using the Bayesian bCRM
89
as the dose allocation method. Section 2.1 presents the bCRM method and the dose allocation algorithm.
90
The first step (1) consists of defining the doses to evaluate. We proposed three options for the selection of
91
the dose-range using adult to paediatric extrapolation methods, which use different adjustments of the
92
paediatric dose from the adult’s recommended dose: linear, related to weight with allometry, and related to
93
physiological processes with maturation functions to account for maturation differences between adults
94
and children. These three options are described in Section 2.2.1. Once the doses are defined, step (2)
consists of associating each dose with a given initial guess of the toxicity and efficacy probability, and
96
these relationships are called "working models" (WMs). The selected doses are supposed to be within
97
a desirable toxicity and efficacy interval to ensure that patients are not overtreated or undertreated. The
98
WMs are constructed by gathering several prior sources of information from the adult population, such as
99
pharmacokinetics, phase I trials, phase II trials, toxicity and clinical response. We proposed two options
100
for the WMs: using only one WM, or using several WMs and selecting the optimal WM using automatic
101
criteria. A description of the methods used to elaborate the WMs is given in Section 2.2.2. Finally, step
102
(3) involves the selection of the dose-response parameter density of the priors used in the bCRM. We
103
proposed two options for these priors: considering adult information or considering the case with the least
104
information. These are described in Section 2.2.3, and a summary of this general framework is presented
105
in Figure 1.
106
[Figure 1 about here.]
107
2.1
Bivariate Continual Reassessment Method (bCRM)
108
In this general framework, we used the bivariate continual reassessment method (bCRM) as phase I/II
109
dose-finding methods. This design proposes a joint model for both toxicity and efficacy17;28. The aim
110
of this method is to identify the safe most successful dose (sMSD) which is the most successful dose
111
under toxicity restriction. Let d1ă d2ă ... ă dK be the paediatric doses to be evaluated in the study, 112
with K the number of discrete dose levels, and n the total number of patients to be recruited.Choice
113
of doses is discussed in Section 2.2.1.Toxicity and efficacy are random binary variables (0,1) where
114
Yj“ 1 denotes a toxicity for patient j ( j P 1, ¨ ¨ ¨ , n) and Vj“ 1 denotes a positive response. The dose level 115
Xjis a random variable taking discrete values xj, where xjP td1, . . . , dKu. The probability of toxicity at 116
dose level Xj“ xjis given by Rpxjq “ PrpYj“ 1|Xj“ xjq, the probability of efficacy with no toxicity at 117
dose level Xj“ xjis given by Qpxjq “ PrpVj“ 1|Xj“ xj,Yj“ 0q and the overall success is obtained by 118
Ppdiq “ Qpdiqt1 ´ Rpdiqu. 119
Following the under-parametrised model approximation proposed by O’Quigley et al.28, we have 120 Rpdiq “ ψpdi, aq “ α exppaq i and Qpdiq “ φpdi, bq “ β exppbq
i where Rpdiq and Qpdiq are monotonic and
121
increasing with dose, a P R (resp. b P R).Parameters0 ă α1ă . . . ă αKă 1 (resp. 0 ă β1ă . . . ă βKă 1) 122
correspond to the working models (WM)to be chosen by the user (seeSection 2.2.2). The joint probability
123
density function is defined by:
124
f py, v ; di, a, bq “ ψpdi, aqyp1 ´ ψpdi, aqqp1´yqφpdi, bqvp1 ´ φpdi, bqqp1´vq. (1)
Under Bayesian inference, the prior distributions for a and b are respectively denoted by πpaq and πpbq.
125
Choice of the priors is discussed in Section 2.2.3.
126
The dose allocation rule is the following. Let us denoteaˆand ˆb theestimatedmeans of the posterior
127
distribution ofa given WM for the current available data of toxicity and efficacy already observed with the
128
included patients.The estimated probability of toxicity is ˆRpdiq – ψpdi, ˆaq and the efficacy ˆQpdiq – φpdi, ˆbq. 129
Finally, the overall probability of success is given by ˆPpdiq “ p1 ´ ˆRpdiqq ˆQpdiq. The recommended dose 130
for the new next cohort of patients is the sMSD d˚that is the dose maximising ˆPpd
1q, ˆPpd2q, ..., ˆPpdKq 131
under a constraint of toxicity target, defined with parameter τ, such that ˆRpd˚q ď τ.
132
In practice: For escalation, dose skipping was allowed only on doses already tested. A start-up phase was
133
implemented to gather data before estimating the model parameters. The first cohort of three patients were
134
treated at a specified dose x0. If no toxicity was observed, a new cohort of three patients would be included 135
at the direct higher dose. This process was repeated until at least a toxicity was observed or all doses
136
were tested. We then moved to the dose-finding algorithm using bCRM. For safety reason, a stopping-rule
137
was added to our algorithm, that is, if Prpψpd1, aq ą τq ą 0.9, the trial was terminated. At the opposite,
138
a second stopping rule was defined in case of non-efficacy. For a threshold of minimum efficacy τ1, if
139
PrpφpdK, bq ă τ1q ą 0.9 the trial was terminated. 140
2.2
Extrapolation from adult data to paediatrics
141
Similarly to any model-based phase I/II dose-finding method, the design can be sensitive to three settings:
142
(1) the choice of dose-range, (2) the WMs and (3) the prior distributions. In our proposed method, we
143
suggest that these settings be based on extrapolations from the adult to paediatric population.
144
2.2.1 Specification of a dose-range Paediatric data are often rare, and paediatric doses are usually
145
selected based on existing recommendations for adult doses.We proposed three options for the selection
146
of paediatric doses: linear and allometric extrapolation from adult doses, which are the current practices,
147
and use of maturation, which is a novel approach in this context.
148
Option linear adjustment (LA).Using the adult dose dad,i (i “ 1, ..., Kq, weight Wch of children and 149
average weight Wadof adults, the linear adjustment (LA) option consists of defining the paediatric dose di
150 as 151 di“ dad,iˆ Wch Wad . (2)
Option allometry adjustment (AA). This optionintroduces a scale parameter describing the rate at
152
which the weight increases, which is usually equal to 0.755:
153 di“ dad,iˆ ˆ Wch Wad ˙0.75 . (3)
Option maturation adjustment (MA). The use of maturation functions allows the adjustments to better 154
reflect the paediatric physiology4. We took advantage of this allometry-maturation approach29to propose
155
a paediatric dose-range calculation, denoted maturation adjustment (MA). Our method is based on the 156
available adult PK knowledge. For a given adult dose dad,i, the corresponding children’s dose diwas
157
defined such that the same exposure to the dose was achieved. This exposure can be quantified by the AUC 158
or Cmax, which depends on PK parameters (typically clearance). Let Clch(resp. Clad) be the paediatric
159
(resp. adult) clearance, and AUCpd,Clq “ d{Cl be the corresponding AUC. The goal of achieving equal 160
exposure in adults and children leads to the following definition for the paediatric dose di“ dad,iˆClClchad.
161
If the adult PK clearance is available from previously published PK studies, the paediatric clearance is 162
generally unknownbut might be extrapolated through allometry and maturation functions. The resulting
163
general equation defining the evolution of clearance in children according to age and weight for a specific
164 drug is 165 Clch Fch “ Cladˆ ÿ h
%CYPhMATCYPhpAGEq loooooooooooooooomoooooooooooooooon Clearance maturation ˆ F Fch loomoon Bioavailability maturation ˆˆ Wch Wad ˙0.75 looooomooooon Allometry (4)
Using allometry to account for size, the bioavailability and clearance sections of the equation account
166
for the maturation process in the paediatric population4;29. The maturation of clearance depends on
167
cytochromes (CYPs), which are responsible for the hepatic elimination process. In Eq. 4, %CYPhis the
168
proportion of the hepatic metabolism for hepatic CYP and MATCYPh, which is the maturation function
169
related to age. The maturation functions for each CYP can be developed empirically or obtained from
170
the literature (in particular, see Johnson et al.5). Bioavailability is defined as the fraction of the dose
171
(bioavailable fraction) that reaches the systemic circulation after oral administration. Indeed, only a
172
fraction of the dose is absorbed at the gut level, and this fraction is defined as fabs. Before reaching
173
the systemic circulation, the drug undergo a first pass effect in the gut and subsequently a second pass
174
effect in the liver due to the presence of CYPs. These pass effects are characterised by the gut extraction
175
coefficient EGand the hepatic extraction coefficient EH, respectively. The bioavailability in adults equals
176
F “ fabsp1 ´ EGqp1 ´ EHq. In the paediatric population, the amount of CYPs in the gut and liver might not
177
have reached the adult amount, and this process depends on age. Therefore, the bioavailability in children
178 Fchcan be expressed as 179 Fch“ fabsp1 ´ EGˆ ÿ g
%CYPgMATCYPgpAGEqqp1 ´ EH ÿ
h
where %CYPgand MATCYPgare similar to the above-described functions but applied to the gut. Using
180
Clch
Clad, this approach yields the following paediatric dose:
181
di“ dad,iˆ
ÿ
h
%CYPhMATCYPhpAGEq ˆ F Fch ˆˆ Wch Wad ˙0.75 (6) 182
The threeabove-described optionswere compared by building a dose-range for LA, AA and MA. The
183
adult average weight Wad was considered to equal 70 kg, and the average paediatric weight is not
184
properly defined. A population of N “ 100, 000 patients aged 0 to 21 years was then simulated using P3M
185
software30;31and for each simulated subject, the individual clearance Clch, j( j “ 1, . . . , N) was calculated. 186
In addition, for eachoption(LA, AA and MA) and for all individuals j “ 1, . . . , N, a set of doses di, j,
187
i “ 1, . . . , K, expressed in mg/kg, were computed. For a given age group, the ithdose was obtained by
188
averaging the mean across all patients belonging to that age group and rounding up to the closest multiple
189
of 5 (due to practice constraints).
190
2.2.2 Choice of working models using adult information After selecting the dose-range for the study,
191
the next step is to parametrise the model-based dose-finding method, i.e., the bCRM. In this method, the 192
WMs αiand βi, i “ 1, ..., K have to be chosen carefully.We proposed two options: defining a unique
193
WM (WM1-bCRM), and defining several WMs (WAIC-bCRM) and selecting the best one using an
194
automatic criteria. The methodology used to build a WM for both options follows three stages. First, the 195
toxicity probabilities are calculated based on adult PK information. We denoted γp`1qas the corresponding 196
probability of toxicity for the adult doses dad,`, ` “ 1, . . . , L tested in clinical trials. Assuming equal
197
exposure in adults and children, this approach yielded estimated toxicities γp`1qfor the children’s doses 198
d`, ` “ 1, . . . , L. Note that these doses are not necessarily concordant with the dose-range in the paediatric
199
population. Indeed, the doses tested in clinical trials dad,`may be different from the adult doses selected to
200
establish the paediatric dose-range. Second, information from toxicity studies (phase I and I/II clinical 201
trials) is gathered using a retrospective design of pooled data32. Details on this method can be found in
Appendix A. Through simulation and a power model with re-estimated parameters, the results were pooled 203
using a down-weighting method, yielding a second estimate γp`2qof the probabilities of toxicities for the 204
adult doses dad,`, or the equivalent children’s doses d`was available. The third step consists of defining a
205
mixture estimator of the toxicity probabilities γp`Tq“ λ`γ`p1q` p1 ´ λ`qγp`2q, where λ`is a weight selected
206
through a data-driven approachas defined by Liu et al.20using data collected from adult clinical trials.
207
The weights were defined as λ`“ LR`{pLR`` 1q where LR`is the estimated likelihood ratio between the
208
two estimated models for a dose level `:
209
LR`“
γp1qn`,toxp1 ´ γp1qqpn`´n`,toxq
γp2qn`,toxp1 ´ γp2qqpn`´n`,toxq
where n`,toxis the overall number of toxicities and n`is the number of patients given dose `. Finally, 210
if the doses d`, ` “ 1, . . . , L obtained through adult information did not match the paediatric dose-range 211
td1, . . . , dKu found as described in the previous section, a logit curve is fit to pd`, γp`Tqq to obtain a curve 212
ηpdq of the probability of toxicity, which allows the calculation of the probability of toxicity for the
213
paediatric doses di. 214
We now describe in detail the two proposed options.
215
Option unique WM (WM1-bCRM). We proposed the use of a unique WM extracted from the available
216
adult information:
217
WM1 : αi “ ηpdiq for i “ 1, ..., K (7)
Option WAIC (WAIC-bCRM). To reduce the arbitrariness of a unique choice of WM αi, i “ 1, ..., K, we 218
proposed the definition ofseveral WMs followed by model selection.FollowingLiu et al., two additional
219
WMs were built from the above-mentioned WM obtained as follows:
220 WM2 : αi “ ηpdi`1q for i “ 1, ..., K ´ 1 and αK“ ηpdKq ` 1 2 (8) WM3 : α1 “ ηpd1q 2 and αi“ ηpdi´1q for i “ 2, ..., K
The bCRM was performed for thethreeworking models,andmodel selection was based on the
Watanabe-221
Akaike information criteria (WAIC)22;23was applied. This approach selected the WM that best fit the
222
data and returned an estimate of parameters a and b for each dose i.
223
2.2.3 Specification of prior density In addition to the WMs, when using Bayesian model-based methods,
224
the prior density of the dose-response model needs to be specified. In our framework, the prior distributions
225
of the dose-toxicity model parameters were selected using two different parametrisations based on either
226
(i) the adult information (option ESS, APESS-bCRM) or (ii) least information (option Least informative 227
prior, APLIP-bCRM).In the first option, due to the sparsity of the data, it appears appropriate to attempt to 228
incorporate observations into the prior. However, the information introduced by the prior distributions to
229
the posterior should not overtake the information introduced by the likelihood distribution.
230
Option ESS (APESS-bCRM).LetπESSpaqbe the prior normal distribution
N
pµa, σ2a,ESSq. The variance231
σ2a,ESSwas fixed such that the information introduced by the prior would be equivalent to the information
232
introduced by a fixed number of patients, which was calibrated to control the amount of information24.
233
This approach is based on the effective sample size (ESS): the higher the ESS, the more informative 234
the prior. The variable m was set to a fixed hypothetical number of patients and Ym“ pY1, ...,Ymq is the
235
associated pseudo-data vector. The likelihood of Ymis fmpYm|aq “
śm
i“1f pYi; aq, where f pYi; aq is the
236
marginal likelihood obtained after integrating the likelihood of Eq. 1 with respect to the efficacy and the 237
dose. Then, a non-informative prior q0paq is introduced with the same expectation µaand a very large
238
variance. The ESS is defined as the sample size m such that the posterior qmpaq9 q0paq ˆ fmpYm|aq is
239
very close toπESSpaq. The proximity between qmand πESSpaqis evaluated by the distance between
240
the second derivatives of πESSpaq and qm with respect to a, Iπpa, µa, σ2a,ESSq “ B
2
Ba2log πESSpaq and
241
Iqmpa, m, µa, σ
2 a,ESSq “
ş B2
Ba2log qmpaqd fmpYm|aq:
242 δpm, µa, σ2a,ESSq “ ˇ ˇIπp ¯a, µa, σ2a,ESSq ´ Iqmp ¯a, m, µa, σ 2 a,ESSq ˇ ˇ (9)
where ¯ais the empirical mean of a, which is fixed using the pooling method32previously introduced
243
in the specification of the WMs. For an ESS m˚, parameters pµ
a, σ2a,ESSq were chosen such that 244
minmδpm, µa, σ2a,ESSq “ m˚.Details of the δ expression can be found in Appendix B. 245
246
Option Least informative prior (APLIP-bCRM).Another method proposed by Zhang et al.27considers
247
only information from the dose-toxicity model.Let πLIPpaq follow
N
pµa, σ2a,LIPq. The variance σ2a,LIP 248was defined such that all doses had the same probability of being the MTD. The parameter space of a
249
was divided into K intervalsI1“ ra0, a1s,I2“ ra1, a2s, ...,Ii“ rai´1, ais, ...,IK“ raK´1, aKs, where 250
a0and aK were the minimal and maximal possible values of a (resp. defined with ψpd1, a0q “ τ ` 0.05
251
and ψpdK, aKq “ τ ´ 0.05 ) and a1, ..., aK´1were the solutions of ψpdi, aiq ` ψpdi`1, aiq “ 2τ (value such 252
that dose i was the MTD). The method theoretically verifies that parameter a had the same chances of
253
belonging tothe K intervalsI1,I2, ...,IK. Therefore, σ2ais calculated such that the empirical variance of 254
the K probabilities of toxicity matches the variance of a discrete uniform distribution pK2´ 1q{1227.
255
256
However, the resulting variancesσ2a,ESSand σ2a,LIPmay be too narrow, leading to difficulties in reaching 257
the extremes in the dose-range (minimum and/or maximum doses).Both options were combined with
258
the adaptive prior method, which was introduced by Zhang et al.26;27and was used when the probability
259
of the MTD being the smallest or the highest dose was high. A second prior πNIPpaq „
N
pµa, σ2a,NIP), 260which is considered a non-informative prior, was associated with a higher variance σ2
a,NIPdefined from 261
the former intervalsI1,I2, ...,IKsuch that σ2a,NIPverified Prpa PI1YIKq “ 0.80. 262
263
The decision to switch from πESSpaq to πNIPpaq (option ESS; APESS-bCRM) or from πLIPpaq to
264
πNIPpaq (option least informative prior; APLIP-bCRM) was performed using the Bayes factor model 265
selection criterion. Three models were defined, each with a uniform distribution: M1: a PI1; M2: a P
266
I2Y ... YIK´1and M3: a PIKwith a uniform distribution within each model.This gave:
PrpYm|M1q “ ża1 a0 K ź i“1 ψpdi, aqyip1 ´ ψpdi, aqq1´yi 1 a1´ a0 da
for model M1and similar equations can be derived forPrpYm|M2q and PrpYm|M3q.The Bayes factor were 268
calculated as follows:
269
PrpM1|Ymq “
PrpM1qPrpYm|M1q
PrpM1qPrpYm|M1q ` PrpM2qPrpYm|M2q ` PrpM3qPrpYm|M3q
where PrpM1q “ PrpM2q “ PrpM3q “ 1{3,and similar equations can be obtained forPrpM2|Ymq and
270
PrpM3|Ymq. Using the rule proposed by Zhang et al.27, the following criteria was used: If PrpM3|Ymq ą 271
0.61 (Jeffrey’s rule), there was substantial evidence that model M3was more likely to be true, and a change
272
from priorπESSpaq or πLIPpaq to πNIPpaqwas thus made. 273
In practice, a comparison was performed betweenAPESS-bCRM which used the bCRM with the adaptive
274
prior from πESSpaq to πNIPpaq, and the APLIP-bCRM which used the bCRM adaptive prior from πLIPpaq 275
to πNIPpaq, respectively. 276
3
Simulations
277The aim of the simulation study was to evaluate and compare the performances of each dose-range and
278
model setting proposition, in terms of selected dose. Based on the motivating illustration, we proposed to
279
plan, conduct and analyse a hypothetical phase I/II dose-finding clinical trial for erlotinib in the paediatric
280
population. We used PK parameters as well as dose-finding toxicity and efficacy clinical trial data for
281
erlotinib obtained from the adult population for extrapolation and bridging.
282
(1)Specification of the dose-range: We hypothesised that the observed AUC in adults was similar in
283
the paediatric population for the three dose-range adjustments LA, AA and MA (linear, allometric and
maturation adjustments). In previous adult dose-finding studies, the doses ranged from 100 mg to 300 mg
285
and the MTD was 150 mg7;8. Based on these publications, the adult doses 100 mg, 150 mg, 200 mg,
286
250 mg and 300 mg were chosen as references for the calculation of paediatric doses. The corresponding
287
doses for children were extrapolated using the adult PK data published by Lu et al.33, which describe
288
the erlotinib PK as a one-compartment model with a clearance of 3.95 L/h. The maturation functions for
289
erlotinib used in the MAoptioncan be found in Appendix C. The dose-ranges associated with eachoption
290
(LA, AA and MA) for patients aged 2 to 5 years were generated according to Eqs. 2, 3 and 6, respectively.
291
The resulting dose-range for eachoption, which were rounded up to the nearest 5 mg/kg, are given in
292
Table 1.
293
(2)Choice of WMs using adult information: A WM needed to be specified for the initial dose-toxicity
294
relationships associated with each dose-range adjustment. These WMs were elaborated as described in
295
the Methods section with a mixture of PK, toxicity and efficacy data from adults. In the erlotinib setting,
296
the mixture was constructed using toxicity data and PK data from early-phase clinical trials in adults
297
(Figure 2). First, the toxicities associated with doses for children γp`1q, ` “ 1, ..., 4 were extrapolated using
298
PK data published by Thomas et al. under the assumption that the same exposure was achieved in the
299
adult and paediatric populations (AUC relationship with dose and clearance; Table 2)34. Second, using
300
the pooled data analysis proposed by Zohar et al. and based on adult toxicity data from seven clinical
301
trial studies on erlotinib, the second estimate γp`2qwas computed32for each dose ` (computation details
302
are given in the Appendix A). These clinical studies have reported that different dose levels of erlotinib
303
induce toxicity, defined as skin rash of grade 3 or more in adults. This information and the estimates of
304
γp`2q, ` “ 1, ..., 4 are summarized in Table 2. The resulting estimated mixture γp`Tqassociated with each dose
305
` can also be found in Table 2. Because the dose-range obtained with the different approaches (LA, AA or
306
MA) overlap and might correspond to different doses within the adult range, a logistic function was fit to
307
the mixture. The resulting logit function is given by ηpdq “ logit´1´
´3.78 ` 0.06Cld
ch
¯
, where Clchis 308
the average clearance across in 2 to 5 year old children. Given the dose-ranges generated as described
309
in the previous section and ηpdq, the first working model (WM1), computed with Eq. 7 was obtained by
reading the toxicities associated with each dose from the curve (Table 1). Then, WM2 and WM3 were
311
computed using Eq. 8.
312
For efficacy, data from adults treated for glioblastoma were considered because efficacy is strongly related
313
to the specific disease.In this setting, efficacy was defined as remission or stability regarding tumour
314
size according to RECIST criteria.Because most of the data were associated with one dose, a method
315
developed by Chung et al. was used to obtain the WM. The percentage of efficacy over all available
316
published data (Table 2) was 20%. We obtained the WM for efficacy reported in Table 1 using the function
317
getprior(halfwidth “ 0.05, target “ 0.2, nu “2, nblevels = 5) available in the dfcrm package in R35.
318
(3)Specification of prior densities: The prior densities for dose toxicity and dose efficacy parameters
319
πESSpaq, πLIPpaq, πNIPpaqand πpbq are given in Table 1. 320
With the ESS option, µaand σ2a,ESS, the pooling method employed for the WM specification32with a 321
power model, resulting in an estimate of the empirical mean ¯a “ logp0.88q; thus, Erexppaqs “ eµa`σ2a,ESS{2. 322
The expected chosen sample size was m˚“ 5 patients and σ2
a,ESSwas then computed with Eq. 9. 323
Then, σ2a,LIPwas calculated with the least informative prior option, and σ2a,NIPwas calculated using K “ 5 324
intervals by minimising Prpa PI1YIKq ´ 0.80 “ 0.
325
For efficacy, prior πpbq was selected as a non-informative normal distribution
N
p0, 1.34q.326
The performances of our unified approach were investigated through a simulation study under several
327
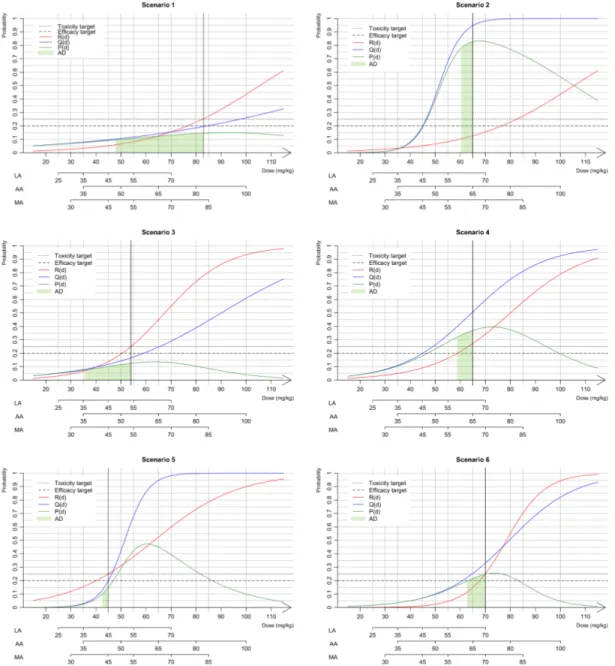
scenarios presented in Figure 3 for the three dose-rangesoptions(LA, AA, and MA). Extrapolation from
328
adults yielded an initial estimate of 48 mg/kg for the MTD associated with a toxicity target of 0.25. We
329
aimed to evaluate how this choice influences the performance of our proposed methods by selecting
330
scenarios in which the MTD and sMSD were different. Scenarios 1, 2 and 3 were based on the results
331
of two real paediatric trials conducted by Geoerger et al.14and Jakacki et al15. For all three scenarios,
332
we considered the same MTD that was found in each trial and the efficacy was simulated. In scenarios
333
1 and 2, the MTD (83 mg/kg) is equal to that reported by Geoerger et al. and is far from the efficacy
334
extrapolated from adult information (48 mg/kg). In scenario 1, the sMSD was similar to the MTD, whereas
335
in scenario 2, the sMSD was 65 mg/kg. In scenario 3, the MTD and the sMSD are equals to those reported
by Jakacki et al. (55 mg/kg) and close to the value extrapolated from adult information.Finally, we added
337
three scenarios: in scenario 4, the MTD (65 mg/kg) was equivalent to the MSD; in scenario 5, the MSD
338
was higher than the MTD (45 mg/kg); and in scenario 6, the sMSD is similar to the MTD (70 mg/kg).
339
For each scenario, we performed 1,000 simulated phase I/II trials with a maximal sample size of N “ 50
340
patients. Because maturation is known to differ among different paediatric age subgroups, we selected a
341
paediatric population with an age range of 2 to 5 years. We also chose a toxicity target of τ “ 0.25 and a
342
minimum efficacy target of τ1“ 0.20 (a realistic target for glioblastoma).
343
For each approach, the percentage of correct dose selection (PCS) of the sMSD was computed. We
344
also evaluated the percentage of acceptable doses (ADs) that includes the closest dose to the sMSD
345
for each approach; if this dose existed, we evaluated the next lower dose for which the probability of
346
success P was included in rPpsMSDq ´ 0.05; PpsMSDqs.For the three dose-range options ( LA, AA
347
and MA), we evaluated the methods as follows: (i) option unique WM (WM1-bCRM) compared with
348
WAIC (WAIC-bCRM) using a non-informative prior (
N
p0, 1.34q) for parameter a of the dose-toxicity349
relationship, and (ii) adaptive prior under option ESS (APESS-bCRM) compared with adaptive prior under 350
option Least informative prior (APLIP-bCRM). 351
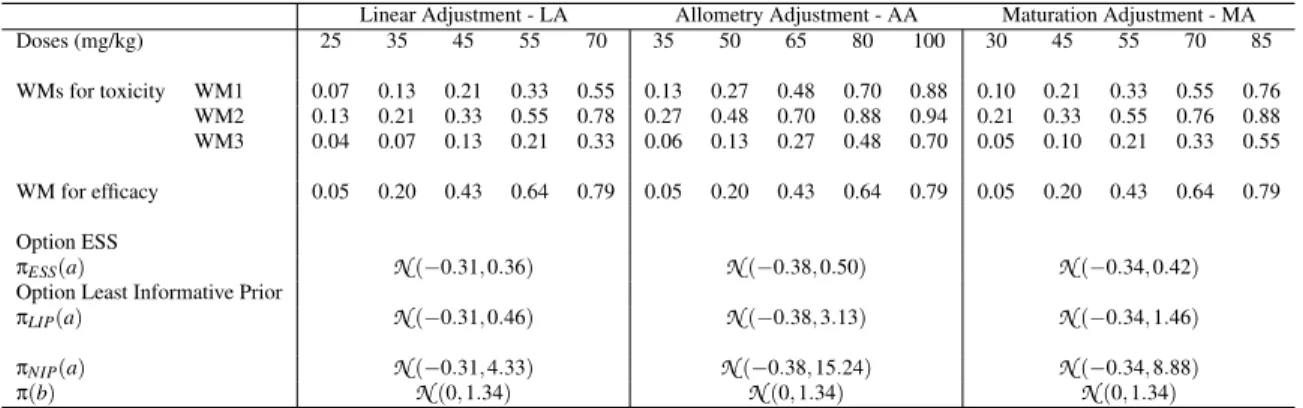
[Table 1 about here.]
352
[Figure 2 about here.]
353
[Figure 3 about here.]
354
[Table 2 about here.]
355
4
Results
356
Based on the toxicity results reported by Geoerger et al.14, scenarios 1 and 2 shared the same MTD of
357
83 mg/kg. However, the sMSDs differed depending on the efficacy differed with 83 mg/kg for scenario 1
358
and 65 mg/kg for scenario 2 (Figure 3).
The LA, for a dose of 83 mg/kg dose was out of range; thus, for scenario 1, the last dose (70 mg/kg) was
360
the only option for the recommended dose. The obtained PCSs for alloptionswas greater than 70%, and
361
in approximately 10% of cases, the trials was stopped due to inefficiency (Table 3). In scenario 2, the exact
362
dose of 65 mg/kg dose was not within the dose-range, and the closest dose was 70 mg/kg. As a result,
363
the model hesitated between doses of 55 mg/kg and 70 mg/kg. In this case,the adaptive prior and WAIC
364
optionsrecommended doses between these two values for approximately half of the trials. Using the AA
365
option, the closest corresponding dose to the sMSD was 80 mg/kg in scenario 1, and the PCS ranged from
366
45.2% to59.1%for allmethods. However, because the probability of success for the doses 65 mg/kg and
367
80 mg/kg doses in scenario 1 (the green area under the curve of Ppdq) were very close, both doses were
368
considered admissible. In this case, the percentage of AD was greater than 94%. In scenario 2, the sMSD
369
was 65 mg/kg, and the PCS was greater than 90% for all options. With the MA, the sMSD was not within
370
the dose-range; thus, the model hesitated between two doses with average percentages of AD equal to
371
90% for scenario 1 and 50% for scenario 2.
372
In scenario 3, the sMSD was equal to the MTD (i.e., the 54 mg/kg dose). In the case of AA, the closest
373
dose to the MTD was 50 mg/kg, and the PCSs for all options were greater than 71%.
374
In scenario 4, the sMSD and MTD were similar (the 65 mg/kg dose). In the case of AA, the dose was within
375
the dose-range, and the PCSs of WAIC-bCRM and WM1-bCRM were 70.5% and 75.2%, respectively.
376
However, the APESS-bCRM gave a lower PCS (63.9%) compared with that obtained with the APLIP-bCRM 377
(73.6%). In scenario 5, the recommended dose was 45 mg/kg, which is within the dose-range obtained
378
with LA and MA. In this case, all options gave high PCS values greater than 60%. If the dose was not
379
within the range, as was the case with AA, the PCS decreased an average of 10%. In scenario 6, the
380
recommended dose was 70 mg/kg. Even if the dose was only in the ranges obtained with the LA and MA
381
options, high PCS values (above 90%) were obtained for all dose-range options.
382
The comparison of the performances of APESS-CRM and APLIP-CRM, revealed similar performances 383
over all dose-range options and scenarios. However, WM1-bCRM and WAIC-bCRM generally provided
384
better recommendations in terms of the admissible dose.
In the case of a too-toxic scenario (sMSD of 20 mg/kg, data not shown), the stopping rules allowed the
386
trial to be stopped if a toxic reaction was observed in 90% of the cases, regardless of the method.
387
In general, if the sMSD was within the dose-range, the PCS and AD percentages were high, whereas if the
388
dose was close but not within the range, a lower PCS percentage and a rather high AD percentage were
389
obtained.
390
[Table 3 about here.]
391
5
Guidelines
392Based on the results of our simulations, we suggest the following settings for the proposed approach:
393
1. For dose-range selection: use either options AA or MA.
394
2. For the WM choice: use option WAIC-bCRM because our results indicates that it is better to use
395
several WMs in the model selection process than a unique WM.
396
3. For prior distribution: if the quantity and quality of the adult information is high, use the APESS
-397
bCRM option; however, if there is some doubt regarding the available adult information, use the
398
APLIP-bCRM option.
399
6
Discussion
400
In this work, we present a unified approach for planning, conducting and analysing paediatric dose-finding
401
clinical trials. This unified approach is based on several possible methods that aim to improve the choices
402
made in the design of paediatric trials. For the analysis of the paediatric population, for which only a small
403
number of clinical trials have been conducted and which typically includes a small number of patients, the
404
bridging of information from the adult population (when possible) to the paediatric population, particularly
405
using PK extrapolation tools such as allometry and maturation functions, is highly relevant.
We based our unified method on the bCRM, which jointly models toxicity and efficacy with a dose-finding
407
allocation rule because in paediatric populations, safety takes priority over efficacy. Our unified approach
408
includes all stages in the dose-finding process, ranging from dose-range selection to the choice of prior
409
distributions for dose responses.
410
The first step of our work proposed three different dose-range adjustments (i.e., linear, allometry or
411
maturation adjustment (LA, AA or MA)). The resulting dose-ranges overlapped, and a wider range was
412
obtained with AA. In this study, we used the specific context of erlotinib, a drug that has been investigated
413
in both adult and paediatric populations for cancer treatment. Both dose-finding and PK studies in adults
414
and children are available. We thus used the available adult information to plan a paediatric trial using the
415
proposed extrapolation and bridging methods and used the children’s dose-finding data to build scenarios
416
for the simulation study, which allowed us to evaluate our design choices.
417
Our extrapolation and bridging approach used data from more than 580 adult observations. We based three
418
of our scenarios for the simulation study on the toxicity observations reported by Geoerger et al.14and
419
Jakacki et al.15, who performed trials that evaluated 16 and 19 children, respectively. Thus, the estimation
420
of the MTD or recommended dose in each trial was associated with high variability due to the small
421
sample size. In this case, it is difficult to assess how far from reality is our model from the true paediatric
422
population. In general, our results show that in cases in which the MTD and sMSD are far from our initial
423
guess (as in scenarios 1 and 2), our proposed dose-finding designs based on either model selection criteria
424
or adaptive priors performed well. A similar finding was obtained for scenario 3, in which the MTD and
425
the sMSD were not far from our initial guess. These results are in favour of the implemented methods
426
because misspecified initial choices do not impact the performance of our proposition.
427
To date, there is no clear recommendation for the selection of the dose-range that should be used in
428
paediatric dose-finding clinical trials. Allometric scaling was initially introduced by West et al.36for
429
identifying measurements that work across and within species. Several studies have suggested that the
430
allometric coefficient may be different in early childhood36;37. The discrepancy between size-based scaling
and effective changes in paediatric patients, particularly neonates and infants, can also be explained by
432
differences in physiological processes due to maturation.
433
The second step of our work was to propose dose-finding design choices for the dose allocation process
434
using adult clinical trial observations. Because not all of the calculated doses were used for adults, we
435
needed to build a logit function based on mixture estimates in adults. For this purpose, we assumed that
436
the exposure was similar in both adults and children. Adult pharmacokinetics combined with maturation
437
served as the first source of information for the toxicity probability, which was defined in terms of PK
438
(AUC or Cmax). A direct curve was reported by Thomas et al.34. The second source of information
439
was toxicity from early-phase clinical trials in adults. This method allowed us to propose tools for the
440
establishment of the WMs and for the prior distributions of dose-toxicity parameters.
441
For simplicity reasons, we maintained the same scenarios for all dose-ranges, which led to different
442
sMSDs. In cases in which the model hesitated between two doses, a lower PCS was obtained primarily
443
because the real dose was not exactly within the dose-range. Other scenario choices could have favoured
444
one adjustment method over the other, although this situation occured due to arbitrary choices. Other
445
methods that jointly model toxicity and efficacy for dose-finding, such as EFFTOX, can also benefit from
446
our proposed approach, although some may only need to use part of our model16. In our case, power
447
function modelling of the dose-toxicity or dose-efficacy curves was selected for simplicity. However,
448
several other models, such as the logit model, could easily be used in our setting.
449
In conclusion, the bridging and extrapolation of adult data for the design of paediatric dose-finding clinical
450
trials appeard to improve the results of these studies. Our proposition may prove helpful for physicians
451
and statisticians who wish to plan and conduct early-phase trials in this population. We attempted to unify
452
and modify existing methods to obtain a clear stream of decision-making regarding several crucial choices
453
that need to be made prior to initiation of a trial. We believe that this approach will improve and allow
454
better use of the available information sources for the planning of new trials.
Aknowledgements
456Caroline Petit was supported during this work by a grant IDEX from the Université Sorbonne Paris
457
Cité (2013, project 24). Sarah Zohar, Emmanuelle Comets and Moreno Ursino were funded by the
458
InSPiRe (Innovative Methodology for Small Populations Research) Project of the European Union
459
Seventh Framework Programme for Research, Technological Development, and Demonstration under
460
grant agreement FP HEALTH 2013-602144. During this work, Adeline Samson was partially supported
461
by the LabEx PERSYVAL-Lab (ANR-11-LABX-0025-01) funded by the French program Investissement
462
d’avenir.
463
References
4641. Brasseur D. Paediatric research and the regulation "better medicines for the children in europe". Eur J Clin
465
Pharmacol, 67 Supp:1–3, 2011.
466
2. Denne S. Pediatric clinical trial registration and trial results: An urgent need for improvement. Pediatrics,
467
129:1320–1, 2012.
468
3. Thall P.F., Nguyen HW., Zohar S., and Maton P. Optimizing sedative dose in preterm infants undergoing treatment
469
for respiratory distress syndrome. J Am Stat Assoc, 109:931–943, 2014.
470
4. Anderson B.J. and Holford N.H.G. Mechanistic basis of using body size and maturation to predict clearance in
471
humans. Drug. Metab. Pharmacokinet., 24:25–36, 2009.
472
5. Johnson T.N. The problems in scaling adult drug doses to children. Arch. Dis. Child., 93:207–211, 2008.
473
6. Dousseau A., Geoerger B., Jiménez I., and Paoletti X. Innovations for phase I dose-finding designs in pediatric
474
oncology clinical trials. Contemp. Clin. Trials, 47:217–227, 2016.
475
7. Prados M.D., Lamborn K.R., Chang S., Burton E., Butowski N., Malec M., Kapadia A., Rabbitt J., Page M.S.,
476
Fedoroff A., Xie D., and Kelley S.K. Phase 1 study of erlotinib HCl alone and combined with temozolomide in
477
patients with stable or recurrent malignant glioma. Neuro. Oncol., 8:67–78, 2006.
478
8. Thepot S., Boehrer S., Seegers V., Prebet T., Beyne-Rauzy O., Wattel E., Delaunay J., Raffoux E., Hunault
479
M., Jourdan E., Chermat F., Sebert M., Kroemer G., Fenaux P., Adès L., and Groupe Francophone des
Myelodysplasies (GFM). A phase I/II trial of erlotinib in higher risk myelodysplastic syndromes and acute
481
myeloid leukemia after azacitidine failure. Leuk Res., 38:1430–4, 2014.
482
9. Calvo E., Malik S.N., Siu L.L., Baillargeon G.M, Irish J., Chin S.F., Santabarbara P., Kreisberg J.I., Rowinsky
483
E.K., and Hidalgo M. Assessment of erlotinib pharmacodynamics in tumors and skin of patients with head and
484
neck cancer. Ann. Oncol., 18:761–7, 2007.
485
10. Raizer J., Abrey L., Lassman L., Chang S., Lamborn K., Kuhn J., Yung A., Gilbert M., Aldape K., Wen P., Fine
486
H., Mehta M., DeAngelis L., Lieberman F., Cloughesy T., Robins H., Dancey J., and Prados P. for the North
487
American Brain Tumor Consortium. A phase II trial of erlotinib in patients with recurrent malignant gliomas and
488
nonprogressive glioblastoma multiforme postradiation therapy. Neuro-Oncology, 12:95–103, 2010.
489
11. van den Bent M., Brandes A., Rampling R., Kouwenhoven M., Kros J., Carpentier A., Clement P., Frenay M.,
490
Campone M., Baurain J-F., Armand J-P., Taphoorn M., Tosoni A., Kletzl H., Klughammer B., Lacombe D., and
491
Gorlia T. Randomized phase II trial of erlotinib versus temozolomide or carmustine in recurrent glioblastoma:
492
Eortc brain tumor group study 26034. J. Clin. Oncol., 27:1258–74, 2009.
493
12. Sheikh N. and Chambers C. Efficacy vs. effectiveness: Erlotinib in previously treated non-small-cell lung cancer.
494
J Oncol Pharm Practice, 19:228–236, 2012.
495
13. Hoffmann-La Roche. A study of management of tarceva - induced rash in patients with non-small
496
cell lung cancer. Available at https://clinicaltrials.gov/ct2/show/NCT00531934?term=
497
00531934&rank=1, February 2015. NCT00531934.
498
14. Geoerger B., Hargrave D., Thomas F., Ndiaye A., Frappaz D., Andreiuolo F., Varlet P., Aerts I., Riccardi R.,
499
Jaspan T., Chatelut E., Le Deley M.C., Paoletti X., Saint-Rose C., Leblond P., Morland B., Gentet J.C., Méresse
500
V., Vassal G., and ITCC (Innovative Therapies for Children with Cancer) European Consortium. Innovative
501
therapies for children with cancer pediatric phase I study of erlotinib in brainstem glioma and relapsing/refractory
502
brain tumors. Leuk Res., 38:1430–4, 2011.
503
15. Jakacki R., Hamilton M., Gilbertson R., Blaney S., Tersak J., Krailo M., Ingle A., Voss S., Dancey J., and
504
Adamson P. Pediatric phase I and pharmacokinetic study of erlotinib followed by the combination of erlotinib
505
and temozolomide: A children’s oncology group phase I consortium study. J. Clin. Oncol., 26:4921–27, 2008.
16. Thall P. and Cook J. Dose-finding based on efficacy-toxicity trade-offs. Biometrics, 60:684–693, 2004.
507
17. Zohar S. and O’Quigley J. Identifying the most successful dose (msd) in dose-finding studies in cancer.
508
Pharmaceut. Statist., 5:187–199, 2006.
509
18. Pressler R., Boylan G., Marlow N., Blennow M., Chiron C., Cross J., de Vries L., Hallberg B.,
Hellström-510
Westas L., Jullien V., Livingstone V., Mangum B., Murphy B., Murray D., Pons G., Rennie J., Swarte R., Toet
511
M., Vanhatalo S., Zohar S., and NEonatal seizure treatment with Medication Off-patent (NEMO) consortium.
512
Bumetanide for the treatment of seizures in newborn babies with hypoxic ischaemic encephalopathy (nemo): an
513
open-label, dose finding, and feasibility phase 1/2 trial. Lancet Neurol, 14:469–77, 2015.
514
19. Broglio K., Sandalic L., Albertson T., and Berry S. Bayesian dose escalation in oncology with sharing of
515
information between patient population. Contemp. Clin. Trials, 44:56–63, 2015.
516
20. Liu S., Pan H., Xia J., Huang Q., and Yuan Y. Bridging continual reassessment method for phase I clinical trials
517
in different ethnic populations. Stat. Med., 34:1681–1694, 2015.
518
21. Yin G. and Yuan Y. Bayesian model averaging continual reassessment method in phase I clinical trials. JASA,
519
104:954–968, 2009.
520
22. Daimon T., Zohar S., and O’Quigley J. Posterior maximization and averaging for Bayesian working model choice
521
in the continual reassessment method. Stat. Med., 30:1563–73, 2011.
522
23. Watanabe S. Asymptotic Equivalence of Bayes cross vallidation and widely applicable information criterion in
523
singular learning theory, volume 11. 2010.
524
24. Morita S., Thall P.F., and Müller P. Determining the effective sample size of a parametric prior. Biometrics,
525
64:595–602, June 2008.
526
25. Morita S. Application of the continual reassessment method to a phase I dose-finding trial in japanese patients:
527
East meets west. Stat. Med., 30:2090–2097, July 2011.
528
26. Lee S. and Cheung Y. Calibration of prior variance in the bayesian continual reassessment method. Stat. Med.,
529
30:2081–89, 2011.
530
27. Zhang J., Braun T., and J. Taylor. Adaptive prior variance calibration in the bayesian continual reassessment
531
method. Stat. Med., 32:2221–34, 2013.
28. O’Quigley J., Hughes M., and Fenton T. Dose-finding designs for hiv studies. Biometrics, 57:1018–29, 2001.
533
29. Petit C., Jullien V., Samson A., Guedj J., Kiechel J.R., Zohar S., and Comets E. Designing a paediatric study for
534
an antimalarial drug including prior information from adults. Antimicrob. Agents Chemother., 60(3):1481–1491,
535
2015.
536
30. Price P., Conolly R., Chaisson C., Gross E., Young J., Mathis E., and Tedder D. Modeling inter-individual
537
variation in physiological factors used in pbpk models of humans. Crit. Rev. Toxicol., 33:469–503, 2003.
538
31. The Lifetime Group. P3M. Software available at http://www.thelifelinegroup.org/p3m/
539
library.php. Version 1.3.
540
32. Zohar S., Katsahian S., and O’Quigley J. An approach to meta-analysis of dose-finding studies. Stat. Med.,
541
30:2109–2116, 2011.
542
33. Lu J-F., Eppler S. M., Wolf J., Hamilton M., Rakhit A., Bruno R., and Lum B. L. Clinical pharmacokinetics
543
of erlotinib in patients with solid tumors and exposure-safety relationship in patients with non–small cell lung
544
cancer. Clin Pharmacol Ther, 80:136–45, 2006.
545
34. Thomas F., Rochaix P., White-Koning M., Hennebelle I., Sarini J., Benlyazid A., Malard L., Lefebvre J.L.,
546
Chatelut E., and Delord J.P. Population pharmacokinetics of erlotinib and its pharmacokinetic/pharmacodynamic
547
relationships in head and neck squamous cell carcinoma. Eur J Cancer, 45:2316–23, 2009.
548
35. Ken Cheung. Package ’dfcrm’. Available at https://cran.r-project.org/web/packages/
549
dfcrm/dfcrm.pdf, August 2013. Version 0.2-2.
550
36. West G.B., Brown J.H., and Enquist B.J. A general model for the origin of allometric scaling laws in biology.
551
Science, 276:122–126, April 1997.
552
37. Peeters M.Y.M., Allegaert K., Blussé van Oud-Albas H.J., Cella M., Tibboel D., Danhof M., and Knibbe C.A.J.
553
Prediction of propofol clearance in children from an allometric model developed in rats, children and adults
554
versus a 0.75 fixed-exponent allometric model. Clin. Pharmacokinet., 49:269–275, 2010.
555
38. Anderson B.J. and Holford N.H.G. Mechanism-based concepts of size and maturity in pharmacokinetics. Annu.
556
Rev. Pharmacol. Toxicol., 48:303–332, 2008.
39. Rakhit A., Pantze M., Fettner S., Jones H., Charoin J-E., Riek M., Lum B., and Hamilton M. The effects
558
of CYP3A4 inhibition on erlotinib pharmacokinetics: computer-based simulation (SimCYP) predicts in vivo
559
metabolic inhibition. Eur. J. Clin. Pharmacol., 64:31–41, 2008.
560
40. Johnson T.N., Rostami-Hodjegan A., and Tucker G.T. Prediction of the clearance of eleven drugs and associated
561
variability in neonates, infants and children. Clin. Pharmacokinet., 45:931–956, 2006.
A
Appendix - Pooling method
563The retrospective pooled data method evaluates retrospectively data from several clinical trials. It aims
564
at estimating the parameter of a toxicity model from several models. Let nip jq “řlj“11pxl“ diq be 565
the number of observations at dose level diafter j patients and tip jq “řlj“1yl1pxl“ diq the number of 566
toxicities observed at dose level diamong the first j patients. The following approach allows to compute
567
an estimate of the parameter a:
568
1. First, gather the number of observed DLTs at each dose level ti(i “ 1, . . . , k) and the number of
569
patients included at each dose level, ni, from all available clinical trials. 570
2. Then, compute the empirical probability of toxicity associated with each dose level by dividing tiby
571
ni. 572
3. For each dose i, after n patients, define a weight wnpdiq. It is calculated by a simulation study based 573
on a model of interest and marginal frequencies provided by observations. To calculate these weights,
574
we simulate CRM studies of size n under the scenario generated by the empirical probability of
575
toxicities. The weights wnpdiq are the percentages of the total allocation for each dose level di. 576
4. Estimate ˆa, the estimate of parameter a, by solving
Wnpaq “ k ÿ i“1 wnpdiqUinpaq “ 0 and Uinpaq “ Htnipnqu „ tipnq nipnq ψ1 ψpdi, aq ` " 1 ´ tipnq nipnq * ˆ ´ψ 1 1 ´ ψpdi, aq i “ 1, . . . , k
where the coefficient Hpsq “1ps ‰ 0q, i.e., a function taking the value 1 when s is not equal to 0, and
577
zero otherwise, and, in order to cover all cases, we use the convention that 0/0 is equal to 1.Uinpaq 578
can be interpreted as a score representing the weighted average across the dose level. This is the
average of some function of the dose toxicity working model for the patients experiencing toxicity
580
and an average of a similar function of the dose toxicity working model for the non-toxicities.
581
5. An estimate for the probability of toxicity at each of the available dose levels i can be computed
582
with ψpdi, ˆaq. 583
In the present paper, for the adult doses of pd1, d2, d3, d4q “ (100 mg, 150 mg, 200 mg and 250 mg) with 584
a power model ψpdi, aq “ αai we obtained the observed toxicty probabilities ti{niof p0, 0.37, 0.11, 0.50q 585
respectively, the weights wip0.02, 0.31, 0.31, 0.36q, which lead to the resulting estimate of ˆa “ 0.88 and 586
the following estimates of the probability of toxicity p0.07, 0.19, 0.35, 0.49q.
587
B
Appendix - Prior specification
588We defined q0paq as a normal
N
pµa, cσ2aq where c “ 10, 000. We first calculated Iqm:589 qmpaq 9 1 a 2πcσ2 a e´ 1 2cσ2apa´µaq 2 ˆ m ź j“1
ψpa, xjqYjp1 ´ ψpa, xjqqp1´Yjq 590
For the jthpatient receving dose x
j, let rxjs “ 1, ..., K the number giving the corresponding dose subscript. 591
We have the derivative and second derivative:
592 Blogqm Ba paq “ ´ pa ´ µaq cσ2 a ` logpαrxjsq m ÿ j“1 ¨
˝Yjexppaq ´ p1 ´Yjq
exppaqαexppaqrx js 1 ´ αexppaqrx js ˛ ‚ B2logqm Ba2 paq “ ´ 1 cσ2 a ` logpαrxjsq exppaq m ÿ j“1 ¨ ˚ ˝Yj´ p1 ´ Yjq αexppaqrx js ´ 1 ` exppaq logpαrxjsq ´ α exppaq rxjs ¯ ´ 1 ´ αexppaqrx js ¯2 ˛ ‹ ‚ 593 Therefore, we had 594
Iqmpa, m, µa, σ2aq “ ´ 1 cσ2 a ` ż Ym ż Xm m ÿ j“1 logpαrxjsq exppaq ¨ ˚ ˝Yj´ p1 ´ Yjq αexppaqrx js ´ 1 ` exppaq logpαrxjsq ´ α exppaq rxjs ¯ ´ 1 ´ αexppaqrx js ¯2 ˛ ‹ ‚f pYm|XmqgpXmqdYmdXm 595
where f is the marginal distribution of Ym|Xmand g the distribution of Xm. We calculated Iπpaq “ ´1
σ2a 596 and obtained δpm, µa, σ2aq “ ˇ ˇIπp ¯a, µa, σ2aq ´ Iqmp ¯a, m, µa, σ 2 aq ˇ ˇ. 597
Since δ was non-computable, due to the dependency of Ymand Xm, the criterion δ was calculated using
598
Monte-Carlo simulations. In order to calculate pµa, σ2aq, we computed the ESS for several value of pµa, σ2aq 599
and we chose pµa, σ2aq such that minmpδpm, µa, σ2aq “ m˚q. 600
C
Appendix - Specification of clearance for erlotinib in children
601Erlotinib is administered as tablets. It is partly absorbed by the enterocyte cells. Before reaching the
602
portal vein, a part of erlotinib is metabolised by the cytochrome CYP3A4 through the gut wall and
603
the hepatic barrier. The bioavailability F in adults is 60% with no food intake and 100% otherwise.
604
However, due to ingestion problems, erlotinib is often given with no food intake. We therefore considered
605
a 60% bioavailability. Once in the blood stream, erlotinib bounds to albumin very strongly. The unbound
606
fraction of drug in plasma fuis 0.05. Erlotinib elimination is mainly hepatic, with a very small renal
607
elimination (about 9%). We neglected that proportion for the maturation process. The cytochrome CYP3A4
608
is responsible for about 70% of erlotinib elimination while CYP1A2 is responsible for the other 30%39.
609
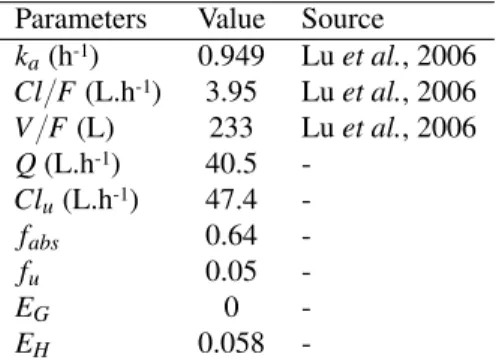
The adult apparent clearance Cl{F is 3.95 L/h. We assimilated the global clearance to the hepatic clearance
610
ClH. Therefore, we can deduce the hepatic extraction ratio with the hepatic plasmatic flow Qhep. The
611
hepatic blood flow is 90 L/h. Correcting by the hematocrit, we obtained Q “ 40.5 L/h, as reported in
612
Table 4 and we had EH“QClH
hep“
Cl{FˆF
Qhep “ 0.058. Considering the hepatic extraction ratio and the fact
613
that CYP1A2, responsible for 30% of the clearance, are not present in the gut wall, we considered a gut
614
wall extraction ration null Eg“ 0. We then calculated the fraction absorbed fabs“1´FEH “ 0.64. Adult
information gathered in Table 4 were used in the computation of paediatric individual clearance. Based on
616
Eq. 5, we have
617
Fch“ fabsp1 ´ EGˆ MATCY P3A4pAGEqqp1 ´ EHˆ p0.70 MATCY P3A4pAGEq ` 0.30 MATCY P1A2pAGEqqq
with the maturation function characterised by T. Johnson40given by MATCY P3A4pAGEq “ AGE
0.83
0.31`AGE0.83
618
and MATCY P1A2pAGEq “ AGE
1.41
1.13`AGE1.41. The heapatic clearance Clchis related to CYP3A4 and CYP1A2,
619
which vary with age up to the adults values. As a results, Eq. 4 of the paediatric clearance becomes for
620
erlotinib:
621
Clch
Fch
“ Cl ˆ p0.70 MATCY P3A4` 0.30 MATCY P1A2q
F Fch ˆˆ Wch Wad ˙0.75 622
[Table 4 about here.]
Linear Adjustment - LA Allometry Adjustment - AA Maturation Adjustment - MA Doses (mg/kg) 25 35 45 55 70 35 50 65 80 100 30 45 55 70 85 WMs for toxicity WM1 0.07 0.13 0.21 0.33 0.55 0.13 0.27 0.48 0.70 0.88 0.10 0.21 0.33 0.55 0.76 WM2 0.13 0.21 0.33 0.55 0.78 0.27 0.48 0.70 0.88 0.94 0.21 0.33 0.55 0.76 0.88 WM3 0.04 0.07 0.13 0.21 0.33 0.06 0.13 0.27 0.48 0.70 0.05 0.10 0.21 0.33 0.55 WM for efficacy 0.05 0.20 0.43 0.64 0.79 0.05 0.20 0.43 0.64 0.79 0.05 0.20 0.43 0.64 0.79 Option ESS πESSpaq Np´0.31, 0.36q Np´0.38, 0.50q Np´0.34, 0.42q
Option Least Informative Prior
πLIPpaq Np´0.31, 0.46q Np´0.38, 3.13q Np´0.34, 1.46q πNIPpaq Np´0.31, 4.33q Np´0.38, 15.24q Np´0.34, 8.88q
πpbq Np0, 1.34q Np0, 1.34q Np0, 1.34q
Table 1. Model settings for simulations. APESS-bCMR uses adaptive prior fromπESSpaq „Npµa, σ2a,ESSqto