Affinity-based capture and identification of
protein effectors of the growth regulator ppGpp
The MIT Faculty has made this article openly available.
Please share
how this access benefits you. Your story matters.
Citation
Wang, Boyuan et al. "Affinity-based capture and identification of
protein effectors of the growth regulator ppGpp." Nature Chemical
Biology 15, 2 (December 2018): 141–150 © 2018, The Author(s),
under exclusive licence to Springer Nature America, Inc.
As Published
http://dx.doi.org/10.1038/s41589-018-0183-4
Publisher
Springer Science and Business Media LLC
Version
Author's final manuscript
Citable link
https://hdl.handle.net/1721.1/123670
Terms of Use
Article is made available in accordance with the publisher's
policy and may be subject to US copyright law. Please refer to the
publisher's site for terms of use.
Affinity-based capture and identification of protein effectors of
the growth regulator ppGpp
Boyuan Wang1, Peng Dai2, David Ding1, Amanda Del Rosario4, Robert A. Grant1, Bradley L.
Pentelute2,4,5,6, and Michael T. Laub1,3,* 1.Department of Biology
2.Department of Chemistry
3.Howard Hughes Medical Institute 4.Koch Institute for Cancer Research
5.Center for Environmental Health Sciences MIT, Massachusetts Institute of Technology,
Cambridge, MA 02139
6.Broad Institute of Harvard and MIT, Cambridge, MA 02142
Abstract
The nucleotide ppGpp is a highly conserved regulatory molecule in prokaryotes that helps tune growth rate to nutrient availability. Despite decades of study, how ppGpp regulates growth remains poorly understood. Here, we develop and validate a capture-compound mass spectrometry
approach that identifies >50 putative ppGpp targets in Escherichia coli. These targets control many key cellular processes and include 13 enzymes required for nucleotide synthesis. We demonstrate that ppGpp inhibits the de novo synthesis of all purine nucleotides by directly targeting the enzyme PurF. By solving a structure of PurF bound to ppGpp, we design a mutation that ablates ppGpp-based regulation, leading to a dysregulation of purine nucleotide synthesis following ppGpp accumulation. Collectively, our results provide new insights into ppGpp-based growth control and a nearly comprehensive set of targets for future exploration. The capture compounds developed will also now enable the rapid identification of ppGpp targets in any species, including pathogens.
Introduction
Guanosine tetraphosphate or pentaphosphate, denoted as (p)ppGpp, is a universally
conserved second messenger in bacteria and archaea that helps regulate cell growth1,2. In the
Users may view, print, copy, and download text and data-mine the content in such documents, for the purposes of academic research, subject always to the full Conditions of use:http://www.nature.com/authors/editorial_policies/license.html#terms
*corresponding author laub@mit.edu.
Author Contributions B.W., P.D. and B.L.P. designed and synthesized capture compounds. D.D. performed phylogenetic analyses. A.D.R. analyzed proteomics data. R.A.G helped with X-ray structure determination. B.W. performed all other experiments. B.W. and M.T.L designed experiments, analyzed data, prepared figures, and wrote the manuscript.
HHS Public Access
Author manuscript
Nat Chem Biol
. Author manuscript; available in PMC 2019 June 17.Published in final edited form as:
Nat Chem Biol. 2019 February ; 15(2): 141–150. doi:10.1038/s41589-018-0183-4.
A
uthor Man
uscr
ipt
A
uthor Man
uscr
ipt
A
uthor Man
uscr
ipt
A
uthor Man
uscr
ipt
Gram-negative bacterium E. coli and many other species, (p)ppGpp is rapidly produced following amino acid starvation during the so-called stringent response3,4. The synthetase RelA, which associates with ribosomes and senses uncharged tRNAs in the A-site during amino-acid starvation, can produce millimolar levels of pppGpp from ATP and GTP within minutes5 (Supplementary Fig. 1a). (p)ppGpp can also be synthesized by the enzyme SpoT in response to starvation for other nutrients, including various fatty acids, phosphate, and certain carbon sources6. SpoT also harbors a hydrolase domain that can remove the 3’-pyrophosphate from (p)ppGpp, helping to reset cells following (p)ppGpp induction6. E. coli produces GppA, a phosphatase that efficiently converts pppGpp to ppGpp such that the latter is the dominant species7.
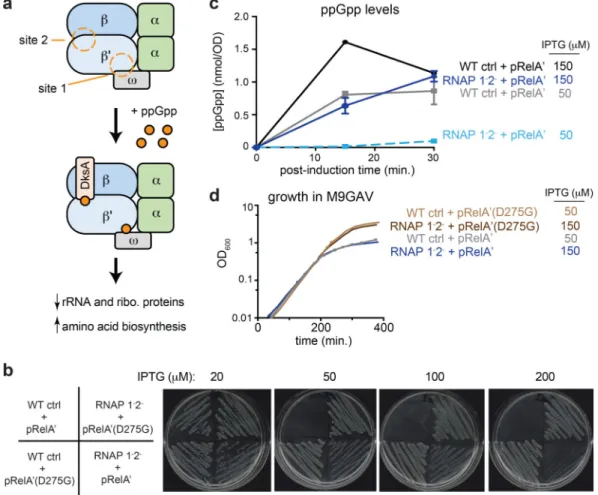
ppGpp down-regulates DNA replication, transcription, translation, and various metabolic pathways3,4,8. These changes help bacteria enter into a dormant state that enables them to survive starvation, stress, and antibiotics. ppGpp is also critical for biofilm formation and virulence of many pathogens9,10. Despite its central importance to bacterial physiology and nearly five decades of study, precisely how (p)ppGpp regulates cell growth remains incompletely understood as the full set of effector proteins is unknown. Over the years, ~25 E. coli proteins have been reported to bind or be inhibited by ppGpp in vitro (Supplementary Table 1). However, the physiological relevance of these targets remains largely untested, with the exception of RNA polymerase (RNAP) (Fig. 1a). ppGpp binds RNAP at two sites to suppress the expression of rRNA and ribosomal protein genes (Fig. 1a), while also activating some genes involved in amino-acid synthesis11,12.
A more comprehensive identification of ppGpp targets is needed to fully understand the physiological impacts of ppGpp on E. coli, and other bacteria. Two recent studies used differential-radial-capillary-action-of-ligand-assays, or DRaCALAs, to screen for (p)ppGpp effectors13,14. This assay measures the mobility of radiolabeled ppGpp on nitrocellulose filters treated with lysate from cells overproducing a single protein and thus requires the laborious construction of overexpression libraries. As a non-equilibrium assay, DRaCALA also likely misses targets with fast off-rates. Application of DRaCALA to Staphylococcus aureus identified 7 targets, including five GTPases involved in ribosomal biogenesis14. For E. coli, it identified 12 putative new targets and 9 known ppGpp-binding proteins, but missed 11 others that bind ppGpp in vitro, underscoring that assay’s high false-negative rate13.
Here, we designed and synthesized ppGpp-peptide conjugates for covalently capturing ppGpp-binding proteins in cell lysates with subsequent identification by mass spectrometry. Our systematic approach identified 56 hits from E. coli, including almost all previously characterized effectors. We validate the new proteins identified, and then focus on one, PurF, which catalyzes the committed step of de novo purine synthesis. Structural, biochemical, and genetic analyses indicate that the inhibition of ATP and GTP synthesis through PurF is an important, but largely overlooked, aspect of ppGpp-based growth control. More generally, our development of ppGpp capture compounds provides a global view of how ppGpp controls growth and candidate effectors for future study.
A
uthor Man
uscr
ipt
A
uthor Man
uscr
ipt
A
uthor Man
uscr
ipt
A
uthor Man
uscr
ipt
Results
ppGpp inhibits growth independent of targeting RNAP
RNA polymerase (RNAP) is often regarded as the primary target of ppGpp in E. coli. To assess whether ppGpp can inhibit growth independent of its effects on RNAP, we generated a strain harboring (i) mutations in rpoC and rpoZ, hereafter called RNAP 1-2- (Fig. 1a), that abrogate ppGpp binding to RNAP11 and (ii) the plasmid pRelA’, which carries an IPTG-inducible fragment of the ppGpp synthetase RelA that constitutively produces ppGpp15. We also generated a wild-type (WT) control strain harboring the same pRelA’ plasmid. Addition of IPTG inhibited growth of both strains on LB agar plates in a dose-dependent manner, though less effectively for the RNAP 1-2- strain compared to the WT control (Fig. 1b). The inhibition was ppGpp-dependent as expression of a catalytically-inactive RelA’(D275G) had no detectable effect on growth.
The difference in IPTG-sensitivity could indicate that the RNAP 1-2- strain grows better than the WT following ppGpp accumulation. Alternatively, it could reflect a difference in RelA’ levels in the two strains. Consistent with the latter, we found that when grown in M9GAV (M9+glucose+amino acids+vitamins), a synthetic rich medium (Supplementary Fig. 1b), the RNAP 1-2- strain produced less RelA’ protein (Supplementary Fig. 1c) and less cytoplasmic ppGpp at the same concentration of IPTG (Fig. 1c). To circumvent this complication, we adjusted the IPTG dosage so that post-induction ppGpp levels would be roughly equal for the two strains, reaching 1 nmol/OD600, or ~1.5 mM in cytoplasm, after 30 min (Fig. 1c).
Strikingly, in these conditions the growth of both strains was similarly inhibited following an induction of RelA’ (Fig. 1d) indicating that ppGpp can arrest cell growth through effectors other than RNAP.
Design and synthesis of photo-crosslinkable ppGpp analogs
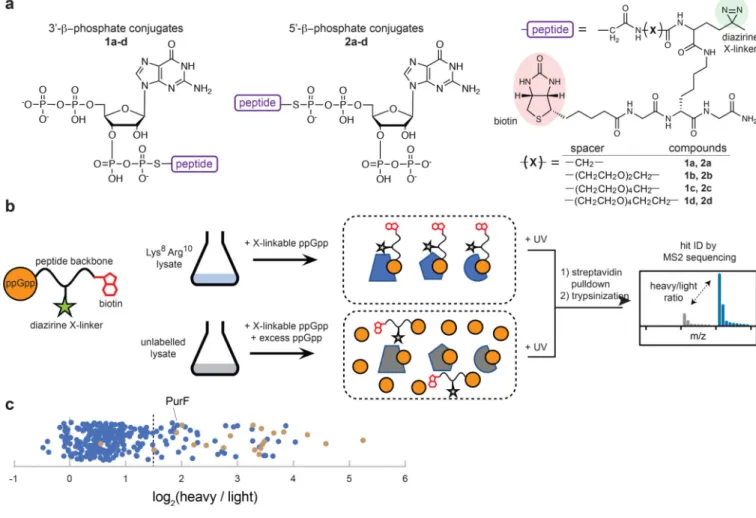
To understand how ppGpp regulates growth independent of RNA polymerase, we sought to systematically identify the protein effectors of ppGpp by covalently capturing these effectors via photocrosslinking chemistry16. We designed a series of “crosslinkable” ppGpp variants, each possessing a diazirine crosslinker and a biotin residue as an affinity handle (Fig. 2a). When added to cell lysates, these molecules should bind ppGpp effectors and, upon UV-activation, covalently biotinylate them to enable affinity enrichment, with subsequent identification through mass spectrometry (Fig. 2b).
We synthesized crosslinkable ppGpp molecules by conjugating ppGpp to peptides furnishing the crosslinker and biotin. We used Fmoc chemistry to synthesize four peptide precursors, each with a bromoacetyl group and a spacer; the length of this spacer was varied to
maximize the likelihood of efficient protein capture (Fig. 2a). The peptides were conjugated to ppGpp analogs bearing a thiophosphate nucleophile, ppGpp(5’βS) and ppGpp(3’βS), which were synthesized using the GDP pyrophosphokinase YjbM17 and thiophosphate-analogs of ATP and GDP (Supplementary Fig. 2a-b). In total, we generated 8 crosslinkable ppGpp variants at milligram scales (Supplementary Fig. 2c-d) that were combined and used as a cocktail. Although the peptide moiety attached to the ppGpp analogs could, in principle, interfere with binding to target proteins, we noted that in known ppGpp-effector complex
A
uthor Man
uscr
ipt
A
uthor Man
uscr
ipt
A
uthor Man
uscr
ipt
A
uthor Man
uscr
ipt
structures at least one β-phosphate of ppGpp remains solvent-exposed (Supplementary Table 2).
Mass spectrometry identification of ppGpp effectors
To identify ppGpp effectors, we used E. coli strain AT713, a lysine and arginine auxotroph that facilitates stable-isotope labeling in culture, or SILAC, mass spectrometry
experiments18. We generated two lysates, one from cells grown with heavy isotope-labeled lysine/arginine and the other from cells grown with regular lysine/arginine (Fig. 2b). We added crosslinkable ppGpp to both lysates, but added an excess of unmodified ppGpp only to the unlabeled lysate. After UV exposure to drive crosslinking, the two reactions were combined and biotinylated proteins were enriched by streptavidin pull-down, followed by trypsin-digestion and mass-spectrometry to identify tryptic fragments with an enrichment of heavy isotopes (Fig. 2b, Supplementary Fig. 2e).
We performed this capture-identification approach on three independent biological replicates. In total, the mass spectrometry identified 290 cytoplasmic proteins with at least two unique peptides in at least two replicates (Supplementary Dataset). Importantly, peptide fragments from 20 of 28 proteins shown previously to bind or be inhibited by ppGpp in vitro had high (> 2.8, or 1.5 on a log2 scale) heavy-to-light ratios (Fig. 2c, Supplementary Table
1). These observations indicated that our SILAC-based mass spectrometry approach has high sensitivity for identifying ppGpp-binding proteins. Of the 8 proteins not identified, 7 had no peptide fragments detected in our mass spectrometry (5 of these 7 are not highly expressed during exponential phase growth19) and one, RpoC, was detected but had a heavy-to-light ratio < 2.8, possibly because its binding site cannot accommodate our crosslinkable ppGpp11.
To generate a list of possible ppGpp effectors, we selected those proteins with average heavy-to-light ratios greater than 2.8, yielding 56 hits, or ~20% of the 290 proteins identified (Table 1, Fig. 2c). This set included 17 proteins involved in translation and 32 metabolic enzymes. The translation-related proteins included 15 GTPases that participate in various aspects of ribosome biogenesis and the translation process itself20. These proteins each bind tightly to GTP and/or GDP, and, perhaps not surprisingly, also bind the structurally similar nucleotide ppGpp, although not all GTPases were identified in our screen. The metabolic enzymes identified participate in multiple pathways, many of whose functions are essential to growth in our culturing conditions (Table 1). The targeting of some, or all, of these enzymes by ppGpp may contribute to the growth arrest of cells, including in the RNAP 1-2- strain where RNA polymerase is ppGpp-insensitive. To test this hypothesis, we sought to validate these metabolic enzymes as ppGpp-binding proteins.
In vitro validation of candidate ppGpp effector proteins
We recombinantly expressed and purified 7 enzymes shown previously to bind ppGpp in vitro and 11 new hits, chosen to span the range of heavy-to-light ratios above 2.8, and then tested the ability of each to bind ppGpp using ITC (Supplementary Table 3). For 15 of these 18 hits, we observed sigmoidal or hyperbolic isotherms during titrations with ppGpp, with KD values for ppGpp ranging from ~1 μM for the tightest binders up to several hundred μM
A
uthor Man
uscr
ipt
A
uthor Man
uscr
ipt
A
uthor Man
uscr
ipt
A
uthor Man
uscr
ipt
for the weakest. These data demonstrate that the capture compound approach has high sensitivity and identified both strong and weak binders of ppGpp.
To further validate these hits, beyond just their ability to bind ppGpp, we reconstituted the known biochemical reactions catalyzed by 13 of the targets identified, including 7 hits not previously implicated as ppGpp targets (Supplementary Table 3). For each reaction, key substrates and allosteric effectors were included at levels approximating their steady-state concentrations in exponential-phase, glucose-fed E. coli21 (see Online Methods). We found that ppGpp at 1 mM activated GpmA by ~50% and inhibited SpeC, Gpt, Hpt, Gsk, and PurF more than 75% each, with 7 others showing more modest (< 20%) effects.
ppGpp drives a decrease in purine nucleotide synthesis
One of the enzymes inhibited only partially by ppGpp was Upp, uracil
phosphoribosyltransferase (PRTase, Supplementary Fig. 3a). This modest effect could reflect the moderate KD of Upp for ppGpp (47 μM) and the fact that ppGpp competes for binding to
Upp with GTP, which was initially included at 1 mM (Supplementary Fig. 3b). Although GTP levels are in the low mM range during exponential growth21, they may drop during the stringent response in E. coli22. Strikingly, we found that if GTP levels were reduced to 100 μM, ppGpp became a much more potent inhibitor of Upp (Supplementary Fig. 3b). Thus, a decrease in GTP during the stringent response may potentiate the ability of ppGpp to inhibit Upp, and other enzymes that rely on GTP.
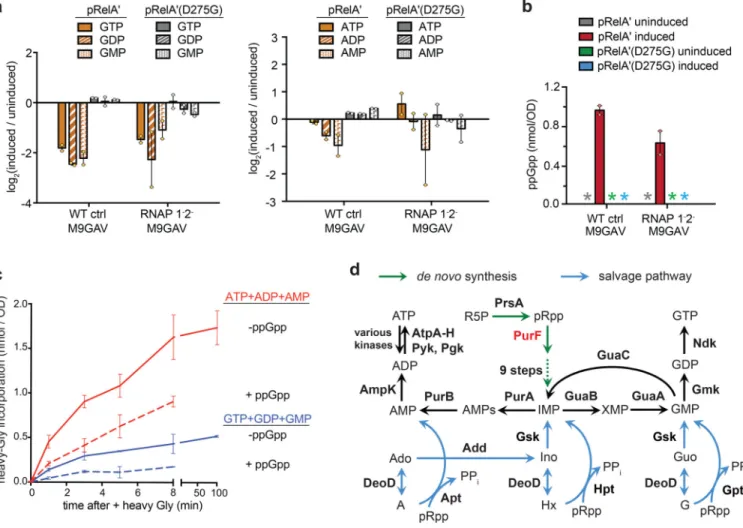
To directly test whether ppGpp triggers a change in the levels of GTP, we extracted and profiled soluble metabolites from E. coli cells using hydrophilic chromatography in tandem to mass spectrometry (pHILIC-MS). We profiled the WT control and RNAP 1-2- strains, each expressing RelA’, or RelA’(D275G) as a control. Strikingly, we found that the levels of all guanosine 5’-nucleotides (GTP, GDP, and GMP) decreased significantly following RelA’ induction in both the WT control and RNAP 1-2- strains (Fig. 3a, left), while ppGpp
accumulated in both strains, as expected (Fig. 3b). The strains in this experiment were grown in M9GAV, a medium in which cells must synthesize their purine nucleotides de novo. Thus, our results strongly indicate that ppGpp blocks the de novo synthesis of guanosine 5’-nucleotides, and does so independent of its effects on transcription through binding to RNAP.
We did not see a significant decrease in ATP or other adenosine 5’-nucleotides after inducing ppGpp (Fig. 3a, right). However, we hypothesized that ppGpp may block the synthesis of adenosine nucleotides and also decrease its consumption, leading to minimal net change in the abundance of adenosine 5’-nucleotides. To directly test this idea, we pulse-treated MG1655 cells in M9GAV medium with 13C215N-glycine either before or 5-minutes
after ppGpp induction, a building block for purine synthesis (Supplementary Fig. 3b). Metabolites were then extracted from cells over time and the incorporation of heavy isotopes into purine nucleotides was monitored by LC-MS. The rate of both ATP and GTP synthesis decreased by ~65% following ppGpp induction, based on the initial velocity of heavy-glycine incorporation into adenosine and guanosine 5’-nucleotides, respectively (Fig. 3c). These results demonstrated that ppGpp inhibits the de novo synthesis of all purine nucleotides.
A
uthor Man
uscr
ipt
A
uthor Man
uscr
ipt
A
uthor Man
uscr
ipt
A
uthor Man
uscr
ipt
ppGpp inhibits de novo purine synthesis by targeting PurF
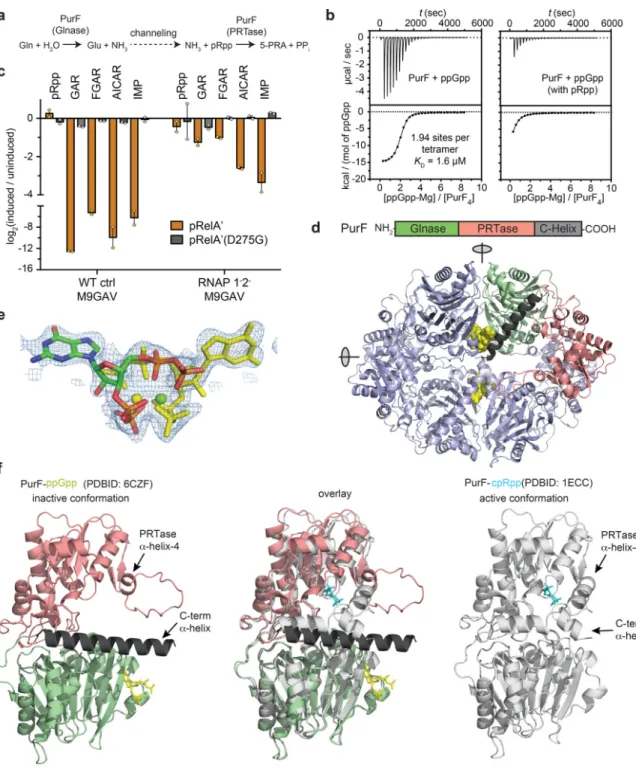
How does ppGpp block de novo synthesis of purine nucleotides? E. coli, like most organisms, assembles non-purine building blocks into IMP, which then feeds into the synthesis of adenosine and guanosine nucleotides (Fig. 3d). No enzymes specific to IMP biosynthesis have previously been implicated as ppGpp targets, but our screen identified PurF, which catalyzes the first step of the pathway23 (Table 1, Fig. 3d). PurF is a glutamine amido-PRTase that consists of an N-terminal glutaminase (Glnase) domain, a middle PRTase domain, and a helical sequence at the C-terminus. The enzyme forms a homotetramer in solution23,24. During catalysis, ammonia generated at the Glnase center is channeled to the PRTase center where it substitutes the diphosphate group in pRpp to give rise to 5’-phosphoribosylamine24 (Fig. 4a). Using ITC, we found that ppGpp binds two sites in the PurF tetramer, with identical KD of 1.6 μM (Fig. 4b, left). Titrating in ppGpp also led to
strong inhibition of PurF activity in vitro, and the inhibition was competitive with respect to the substrate pRpp (Supplementary Fig. 4a).
To assess whether ppGpp targets PurF in vivo, we examined metabolite profiles of E. coli before or after ppGpp induction via pRelA’. IMP biosynthesis requires ten sequential steps, the first eight of which take input only from PurF activity25 (Supplementary Fig. 3b). Strikingly, for WT control cells grown in M9GAV, we observed a dramatic (>30-fold) decrease of all three detectable intermediates downstream of PurF, as well as IMP, following the induction of ppGpp (Fig. 4c). These results strongly support the conclusion that ppGpp targets PurF in vivo. GMP and AMP, two other known PurF inhibitors23 cannot account for the observed inhibition of PurF as their abundance also dropped upon RelA’ expression (Fig. 3a). Similar, though less pronounced, decreases in the IMP synthesis intermediates was seen for the RNAP 1-2- strain suggesting that ppGpp may affect purine synthesis both
transcriptionally and post-transcriptionally (Fig. 4c). ppGpp binding disrupts the PRTase active site of PurF
To better understand how ppGpp directly inhibits PurF, we solved a crystal structure of E. coli PurF bound to ppGpp to a resolution of 1.95 Å (Supplementary Table 4). The
asymmetric unit of the crystal was a PurF tetramer with D2 symmetry (Fig. 4d). The ppGpp binding sites are located where Glnase domains interact across a two-fold symmetry axes. Pairs of binding sites overlap across this two-fold axis, precluding the binding of ppGpp to one site if the neighboring site is occupied, which explains why the symmetric tetramer only binds two ppGpp molecules (Fig. 4d-e). The electron density for all sites was equivalent, indicating that ppGpp binds in both possible orientations with one half occupancy (Fig. 4e, Supplementary Fig. 4b). The nucleotide adopts a compact conformation in which all four phosphate groups coordinate a Mg2+ cation with a slightly distorted square-planar octahedral configuration (Supplementary Fig. 4c, also see Online Methods). Notably, PurF adopts an inactive conformation in complex with ppGpp, based on comparison to a prior structure in complex with the substrate analog, carboxylic pRpp (cpRpp) that is thought to represent the active state24 (Fig. 4f, Supplementary Fig. 4d). In particular, the fourth α-helix of the PRTase domain, which normally constitutes part of the active site in the cpRpp analog-bound, active conformation, appears partially unwound in
A
uthor Man
uscr
ipt
A
uthor Man
uscr
ipt
A
uthor Man
uscr
ipt
A
uthor Man
uscr
ipt
our ppGpp-bound structure (Fig. 4f). Additionally, binding of ppGpp appears to disrupt a loop near the Glnase active site and promote contacts between this loop and the C-terminal helix of PurF (Supplementary Fig. 4d, left). The C-terminal helix is thus drawn away from the PRTase active site (Fig. 4f) such that the side chain of Asp484 no longer stabilizes the dipole of α-helix-4 of the PRTase domain, as it does in the active, cpRpp-bound state (Supplementary Fig. 4d, right). These observations are consistent with our finding that ppGpp competitively inhibits PurF (Supplementary Fig. 4a) even though it binds at an allosteric site. In agreement with this competitive-inhibition model, the presence of pRpp at 0.5 mM, an order of magnitude higher than the Km of this substrate23, strongly diminished
binding by ppGpp in ITC studies (Fig. 4b, right).
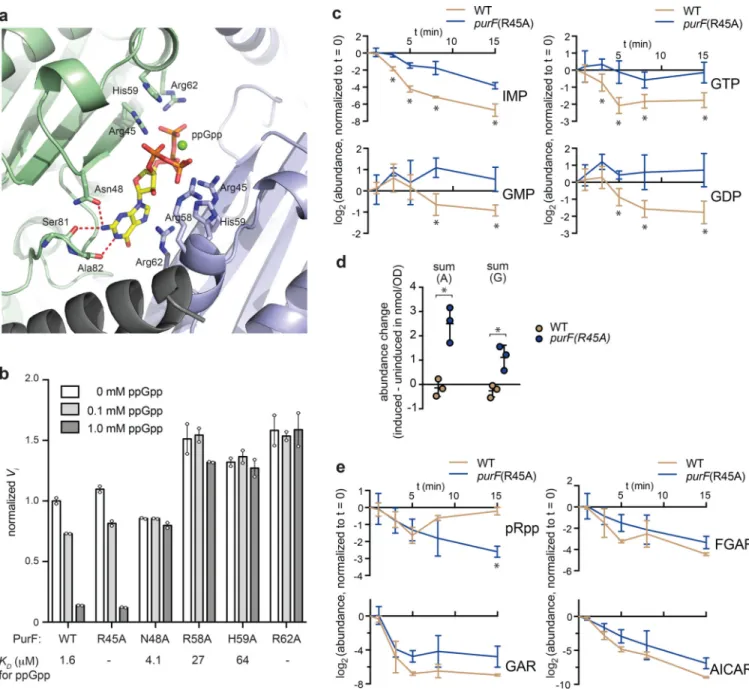
The binding of ppGpp to PurF involved four basic residues from one or both subunits: Arg45, Arg58, His59, and Arg62 (Fig. 5a). The side chain of each residue appears to stabilize the anionic phosphate cluster of ppGpp through electrostatic interactions, with one Arg62 π-stacking to the guanine base. The guanine base also acts as a hydrogen-bond donor to the Ala82 backbone and the Asn48 side chain whose orientation is stabilized by
hydrogen-bonding to the backbone of Ser81 (Fig. 5a). To validate these interactions, we purified PurF variants in which Arg45, Asn48, Arg58, His59 or Arg62 was mutated to Ala, and assayed each mutant for binding to and inhibition by ppGpp. Strikingly, both R45A and R62A completely abolished binding to ppGpp, while R58A and H59A increased the KD by
16 and 39 fold, respectively (Fig. 5b). Each of these four mutations rendered PurF insensitive to ppGpp up to 1 mM, while retaining activity comparable to, or even slightly higher, than the WT PurF in the absence of ppGpp (Fig. 5b).
PurF is inhibited by ppGpp in vivo
To assess whether the ppGpp-PurF interaction seen in vitro also occurs in vivo, we introduced the R45A mutation into purF at its native locus on the E. coli chromosome. Importantly, although PurF(R45A) is incapable of binding to ppGpp, it preserves a wild-type level of catalytic activity and remained sensitive to the known feedback inhibitors AMP and GMP (Fig. 5b, Supplementary Fig. 5a). We transformed the purF(R45A) mutant, and a WT strain for comparison, with the pRelA’ plasmid and then grew each strain to mid-exponential phase in M9GAV before inducing the production of ppGpp. We extracted metabolites immediately before and at several time points after inducing ppGpp for up to 15 minutes. Notably, ppGpp accumulated at comparable rates and plateaued 8 minutes post-induction at a similar level in both strains (Supplementary Fig. 5b). We found that IMP, GMP, GDP, and GTP all decreased substantially in the wild-type, but not as much in the purF(R45A) strain (Fig. 5c). In fact, the summed levels of all guanosine nucleotides, including (p)ppGpp, and of all adenosine nucleotides increased significantly in the purF(R45A) mutant but not the WT (Fig. 5d, Supplementary Fig. 5b).
These results support the conclusion that PurF(R45A) is not properly inhibited by ppGpp leading to an increased production of purine nucleotides relative to the wild-type strain. However, our metabolite profiling indicated that intermediate species downstream of PurF, namely GAR, FGAR and AICAR, still decreased in the purF(R45A) mutant (Fig. 5e). These decreases likely reflect the inhibition of pRpp synthase by ADP26, which accumulates in
A
uthor Man
uscr
ipt
A
uthor Man
uscr
ipt
A
uthor Man
uscr
ipt
A
uthor Man
uscr
ipt
both strains following ppGpp induction, probably from the AMP generated concomitantly with ppGpp production (Fig. 5e, Supplementary Fig. 5b-d). In the wild type, ADP levels initially increased while pRpp levels decreased, followed by recovery of both to pre-induction levels. In contrast, the purF(R45A) mutant showed higher and sustained
accumulation of ADP and a concomitant, continued decrease in pRpp over the 15 min time course. Notably, accumulation of two inhibitors of the PurF(R45A), AMP and GMP (Fig. 5c, Supplementary Fig. 5b-d), in the mutant strain did not lead to the recovery of pRpp levels to those observed in the wild type, indicating that a limitation of pRpp production is the primary cause of the depletion of IMP-biosynthesis intermediates in the purF(R45A) strain.
In sum, our metabolite profiling indicates that E. coli harboring a ppGpp-insensitive PurF(R45A) accumulates purine nucleotides following ppGpp induction, likely because of continued synthesis by the PurF(R45A) mutant and a decrease in consumption due to rRNA synthesis inhibition. Taken all together, our results strongly support the conclusion that PurF is normally inhibited by ppGpp in vivo and that relieving this inhibition leads to a
dysregulation of purine nucleotide synthesis.
Discussion
ppGpp plays a central role in regulating the growth rate of virtually all prokaryotes. Despite its importance and intense study over several decades, a comprehensive list of ppGpp targets has been elusive. Development of a capture compound for systematically identifying its effectors by mass spectrometry provides an unprecedented global view of how ppGpp regulates cellular activities in E. coli. Our approach identified 56 candidate ppGpp-binding proteins, including almost all of those previously identified, and more than 25 not previously implicated as targets (Table 1).
Notably, some proteins identified bound to ppGpp with a KD in the mid-to-high micromolar
range, but 1 mM ppGpp had no significant impact of their biochemical activities in vitro. For these proteins, enzymatic inhibition by ppGpp may require the inclusion of substrates, co-factors, or other proteins present in cell lysates but not included in vitro. Some of these proteins may also represent false positives, or have been identified by interacting with a bona fide ppGpp effector and getting crosslinked as a result of their close proximity. Detailed studies, like done here for PurF, are needed to validate the candidates identified and assess their in vivo relevance.
ppGpp has long been known to inhibit DNA replication, transcription, translation, and various anabolic processes4, but the set of direct effectors had been elusive. In E. coli, ppGpp directly binds to RNAP, and RNAP is often considered the primary target of ppGpp. However, cells producing a variant of RNAP that no longer binds ppGpp are still growth inhibited by ppGpp (Fig. 1d) indicating transcription-independent mechansisms for inhibiting cell growth. Our capture compound-based method identified dozens of putative targets that control a wide range of cellular and metabolic processes, suggesting that ppGpp orchestrates the shut-down of many physiological processes in parallel.
A
uthor Man
uscr
ipt
A
uthor Man
uscr
ipt
A
uthor Man
uscr
ipt
A
uthor Man
uscr
ipt
One highly enriched set of putative targets were GTPases, 15 of which are conserved proteins involved in translation and ribosome biogenesis20 (Table 1). For EF-G, EF-Tu, and IF2, the binding of ppGpp instead of GTP disrupts translation in vitro27,28. How ppGpp affects the other GTPases is not known, but likely leads to a similar disruption in translation. Testing the physiological relevance of individual GTPases as targets will be difficult as mutations that eliminate binding of ppGpp to one or even several GTPases may have little effect on translation. This difficulty may highlight a key feature of ppGpp-based control; targeting multiple GTPases is a potentially fail-safe mechanism for inhibiting translation. Another highly enriched set of ppGpp targets are enzymes involved in nucleotide
metabolism. (p)ppGpp was previously shown to block GTP synthesis in the distantly-related Gram-positive B. subtilis by inhibiting the guanylate kinase Gmk29. Blocking GTP synthesis was suggested to be important for inhibiting rRNA transcription, which relies on GTP as the initiating nucleotide30, as (p)ppGpp does not target B. subtilis RNAP. However, we found that GTP synthesis is also blocked in E. coli suggesting that blocking GTP synthesis has a broader relevance during the stringent response. Lowering GTP levels may significantly slow growth as GTP is needed for transcription and translation. The decrease in GTP also potentiates ppGpp as a competitor for some GTP-activated enzymes, as shown here for Upp, and a drop in GTP synthesis may prevent the excessive accumulation of ppGpp, enabling an eventual resetting of the stringent response and a resumption of cell growth.
How does ppGpp inhibit purine nucleotide biosynthesis? Prior studies found that ppGpp inhibits the salvage of guanine and hypoxanthine nucleobases or nucleosides by targeting Hpt and Gpt31, two proteins also identified here (Fig. 3d). In addition, our results
demonstrate that ppGpp blocks de novo purine synthesis by directly targeting PurF, which catalyzes the first dedicated step of the pathway. We found that ppGpp strongly inhibits PurF in vitro (Supplementary Fig. 4a) and the induction of ppGpp in vivo led to a significant decrease in metabolites downstream of PurF (Fig. 4c) as well as a decrease in the rates of purine nucleotide synthesis (Fig. 3c). Notably, in cells producing PurF(R45A), which retains wild-type PurF activity and regulation except by ppGpp, we found that purine nucleotide levels increased significantly following ppGpp induction compared to the wild type (Fig. 5d), underscoring the physiological relevance of PurF as a direct target.
In sum, our work indicates that inhibiting nucleotide synthesis is a critical facet of growth control by ppGpp in E. coli, and probably other bacteria, with PurF a key, direct target. More broadly, our capture-compound approach indicates that ppGpp regulates cell growth by targeting a range of cellular and metabolic processes, and the specific targets identified can now be examined in detail. Our capture compounds can also be used to rapidly identify the stringent-response effectors in a range of microbes, including pathogens, many of which rely on ppGpp to survive in their hosts10. A comparison of effectors in phylogenetically diverse organisms will also begin revealing how the stringent response has evolved.
A
uthor Man
uscr
ipt
A
uthor Man
uscr
ipt
A
uthor Man
uscr
ipt
A
uthor Man
uscr
ipt
Online Methods
Growth conditionsEscherichia coli was grown in LB (10 g/L NaCl, 10 g/L tryptone, 5 g/L yeast extract) or M9-based defined media. All solid media contained 1.2% agar. M9 base medium (14 g/L Na2HPO4-7H2O, 3 g/L KH2PO4, 0.5 g/L NaCl, 1 g/L NH4Cl, 1 mM MgSO4, 30 μM CaCl2)
was made into defined media by supplementing nutrients as follows:
M9G-casamino acids medium: 1.0% glucose, 0.2% casamino acids and 25 μM Fe(SO4
)-EDTA chelate.
M9G-amino acid-vitamin (M9GAV) medium: 0.4% glucose, 0.25% each of serine and L-threonine, 0.0375% each of L-asparagine and L-glutamine, 0.015% each of all 16 other natural amino acids, and 1X Kao & Michayluk Vitamins.
SILAC medium: 0.4% glucose, 0.0125% each of L-asparagine and L-glutamine, 0.01% each of L-arginine and L-lysine (regular or 13C- and 15N-labeled), 0.005% each of all 16 other natural amino acids and 1X Kao & Michayluk Vitamins.
Cells were cultured at 37 °C and 200 rpm on an orbital shaker (for liquid cultures). Prior to liquid-culture growth, individual colonies were selected by growth overnight on LB agar plates. Antibiotics were used at the following concentrations: carbenicillin (100 μg/mL), kanamycin (50 μg/mL), chloramphenicol (25 μg/mL) and tetracycline (12.5 μg/mL), unless otherwise noted.
Plasmid construction
See Supplementary Table 5 for all DNA oligo primer sequences used in this study.
The IPTG-inducible RelA’ expression plasmid (pR1–1His) was modified from pALS13 (ref
15), a gift from Susan Lovett (Brandeis University). To insert an octahistidine tag at the
C-terminus of the RelA’ open reading frame, the plasmid was PCR-amplified with primers “R1–1 His8ins RP” and “R1–1 His8ins RP” and the PCR reaction treated with DpnI prior to transformation into E. coli DH5α. pR1–1His were extracted from a transformant.
Plasmids for recombinant protein production were constructed from a vector backbone (Supplementary Table 6) and a PCR fragment of the target protein-coding sequence (insert DNA, Supplementary Table 7) through Gibson Assembly. pET30-His6-Sumo-CfaN and
pTXB1-Ub-Cfa were generous gifts from Tom Muir (Princeton)33.
Single-point mutagenesis were performed on expression plasmids for PurF (pG23–1Cfa) and RelA’. Briefly, the original plasmid was PCR-amplified using primer pairs bearing the desired mutation and each PCR reaction was treated with DpnI prior to transformation into E. coli DH5α. Mutant plasmids were extracted from transformants.
See Supplementary Table 8 for a summary of plasmids in this study.
A
uthor Man
uscr
ipt
A
uthor Man
uscr
ipt
A
uthor Man
uscr
ipt
A
uthor Man
uscr
ipt
Construction of purF(R45A) strain
The purF(R45A) strain (ML2912) was also constructed in an MG1655 (ML006) background through lambda recombineering34. ML006 harboring pKD46 and expressing the Lambda recombinase was electroporated with a kanR fragment amplified from pKD4 with primers “G23–1 K46:Kan FP” and “G23–1 K46:Kan RP”. Recombinants were selected on LB plates containing 10 μg/mL kanamycin and 100 μg/mL carbenicillin at 30 oC to maintain pKD46. Then, a recombinant clone expressing the Lambda recombinase was electroporated with the primer “G23–1 R45A Rec”. This second recombination displaced the kanR cassette and restored the purF gene, but harboring the desired mutation. Recombinants were selected for purine autotrophy on M9-Glucose-casamino acids plates at 37 oC to drive the loss of pKD46. The desired mutation was confirmed by Sanger sequencing and the absence of unexpected mutations was confirmed by whole-genome sequencing.
See Supplementary Table 9 for all strains used in this study. Protein Expression
All recombinant proteins used in this study were expressed in E. coli BL21(DE3) harboring the corresponding expression plasmid. Expression strains were grown in LB containing the appropriate antibiotics at 37 oC to OD600 = 0.6. The culture was then cooled to 18 oC and
then induced by the addition of 200 μM IPTG. Cells were harvested 16 to 24 hours post-induction.
Purification of proteins without an affinity tag
Expression plasmids for PurA from E. coli (G27–1nt) and PurF from E. coli (G23–1nt) encoded the exact ORF of each protein. These proteins were purified following similar strategies, as exemplified by E. coli PurA as follows. Cell pellets from 1 L expression culture (wet weight ~ 10 grams) was resuspended in 40 mL lysis buffer containing 50 mM Tris-HCl pH 8.0, 50 mM NaCl, 10 mM MgCl2, 5 mM DTT, 20 μg/mL lysozyme and 1 mM
PMSF. Cells were disrupted through sonication and the lysate was cleared at 15,000 g for 10min. The supernatant was then treated with 75 mg protamine sulfate followed by vortexing. Precipitate that emerged was pelleted at 30,000 g for 1 hour, and the cleared lysate was applied to a DEAE sepharose column (16/150, ~30 mL bed volume) equilibrated with buffer A (50 mM Tris-HCl pH 8.0, 10 mM MgCl2 and 5 mM DTT). The column was then washed with 50 mL 5% buffer B (buffer A + 1M NaCl), and bound protein was eluted at using a linear gradient with the percentage of buffer B increasing from 5 to 55% within 200 mL. Peak fractions for PurA (15 mL) were combined and a saturated (NH4)2SO4
solution at 0 oC was added to reach 55% saturation. Precipitated protein was removed, and (NH4)2SO4 was added to the mother liquor to 65% saturation. Protein precipitated at this
stage had high purity as was examined by SDS-PAGE. The protein was re-dissolved in gel-filtration buffer (20 mM HEPES-Na pH 7.4, 150 mM NaCl, 2 mM MgCl2 and 1 mM TCEP)
and refined over a Superdex-200 increase (10/300) column. Purification of His6-tagged proteins
With the exception of B. subtilis YjbM (G1–2), His-tagged proteins were purified following the standard protocol described below. Cell pellet from 1 L expression culture was
A
uthor Man
uscr
ipt
A
uthor Man
uscr
ipt
A
uthor Man
uscr
ipt
A
uthor Man
uscr
ipt
resuspended in 25 mL lysis buffer containing 50 mM Tris-HCl pH = 8.0, 150 mM NaCl, 2 mM MgCl2, 1 mM TCEP, 20 μg/mL lysozyme and 1 mM PMSF. Cells were disrupted
through sonication and the lysate was cleared at 30,000 g for 1 hour. Cleared lysate was applied to 4 mL Ni-NTA resin equilibrated with the lysis buffer, and allowed to flow through by gravity. The Ni-NTA resin was washed with 5x column volumes of wash buffer 1 (50 mM Tris-HCl pH 8.0, 500 mM NaCl, 10 mM imidazole, 2 mM MgCl2, and 1 mM TCEP)
and 10x column volumes of wash buffer 2 (50 mM Tris-HCl pH 8.0, 150 mM NaCl, 25 mM imidazole, 2 mM MgCl2, and 1 mM TCEP). Bound protein was eluted with 3X column
volumes of elution buffer (50 mM Tris-HCl pH 8.0, 150 mM NaCl, 300 mM imidazole, 2 mM MgCl2, 1 mM TCEP and 15% (v/v) glycerol).
For the purification of His6-YjbM, cells were lysed in a buffer containing 50 mM Tris-HCl
pH 8.0, 300 mM NaCl and 1 mM DTT, and neat glycerol was mixed into the lysate for 15% (v/v) final concentration immediately following lysis. After adsorpting protein from the lysate, the Ni-NTA resin was washed with 10x column volumes of wash buffer (50 mM Tris-HCl pH 8.0, 300 mM NaCl, 35 mM imidazole, 1 mM TCEP, and 15% (v/v) glycerol) and bound protein was eluted with 3X column volumes of elution buffer (wash buffer with 500 mM imidazole). Protein in eluate was concentrated and refined over a Superdex-200 increase (10/300) column.
Removal of affinity tags
To avoid interference from oligo-histidine sequences, most proteins used for hit-validation experiments were removed from affinity tags. Standard procedures for thrombin cleavage, sumo-protease cleavage, and thiol cleavage for this purpose are described below.
To remove the N-terminal His6 tag of recombinant proteins expressed from the pET28b
vector, thrombin (Sigma) was reconstituted in 20 mM Tris-HCl pH 8.0, 150 mM NaCl and 20% (v/v) glycerol at 100 U/mL. Eluates off the Ni-NTA column were dialyzed against 20 mM Tris-HCl pH 8.0, 150 mM NaCl and 2 mM MgCl2, and then treated with thrombin (10
U per μmol cleavage sites) at RT overnight. Cleavage was monitored by SDS-PAGE and more thrombin and cleavage time was applied if necessary. Upon completion, the cleavage mixture was treated with 10 mM TCEP, concentrated and refined over a Superdex-200 increase (10/300) column.
To remove the N-terminal His6-Sumo tag fused to E. coli PyrH (G25–1Sumo) and GuaB
(G30–1Sumo), proteins off the Ni-NTA column were exchanged into a Sumo-cleavage buffer containing 20 mM HEPES-Na pH 7.4, 150 mM NaCl and 2 mM MgCl2, and 1 mM
TCEP. The tagged protein was then treated with Sumo protease (1mg per μmol cleavage sites) at RT for 2 hrs. E. coli PyrH generated in situ from G25–1Sumo was used directly for biochemical assays. Cleavage mixture of E. coli GuaB (G30–1Sumo) was subject to a reverse Ni-NTA process to clean up residual uncleaved protein. The combined flowthrough and wash was then concentrated and refined over a Superose-6 increase (10/300) column. Proteins fused to a C-terminal Cfa-His6 were exchanged into the intein-cleavage buffer
containing 20 mM HEPES-Na pH 7.0, 150 mM NaCl, and 1 mM TCEP, and treated with 100 mM sodium 2-mercaptoethanesulfonate (MESNa), 100 mM L-cysteine and 20 mM
A
uthor Man
uscr
ipt
A
uthor Man
uscr
ipt
A
uthor Man
uscr
ipt
A
uthor Man
uscr
ipt
TECP at pH 7.0 and RT overnight. Note that this treatment substituted a Cys residue for the Cfa-His6 tag, harnessing the auto-catalytic, N-terminal cleavage activity of inteins8.
Cleavage was monitored by SDS-PAGE and, if necessary, allowed to progress further at 37
oC. Upon completion, the cleavage mixture was extensively dialyzed against the
intein-cleavage buffer and then subject to a reverse Ni-NTA process to remove residual uncleaved protein. The combined flowthrough and wash was concentrated and refined over a
Superdex-200 increase (10/300) column. Size-exclusion chromatography (SEC)
With the exception of B. subtilis YjbM and E. coli GuaB, SEC of all recombinant proteins was run in a buffer containing 20 mM HEPES-Na pH 7.0, 150 mM NaCl, 2 mM MgCl2, and
1 mM TCEP. Up to 20 mg protein was injected in 1 mL and peak fractions were collected. SEC buffer for E. coli GuaB included 150 mM KCl in place of NaCl. SEC buffer for YjbM contained 20 mM Tris-HCl pH 8.0, 300 mM NaCl, 1 mM TCEP, and 15% (v/v) glycerol. Synthesis of native and crosslinkable ppGpp
ppGpp was synthesized following procedures described by Steinchen et al.17. Briefly, 10 mM GDP and 12 mM ATP were mixed with 5 μM YjbM (final concentrations, molarity in monomers for YjbM). The mixture was incubated at 37oC for 4 hrs. ppGpp was then purified by Mono Q anion exchange chromatography followed by precipitation using LiCl and ethanol. The precipitate was lyophilized to give a colorless powder. ppGpp(3’βS) was synthesized from ATPγS and 1.2 equivalence of GDP, and ppGpp(5’βS) from GDPβS and 1.2 equivalence of ATP using otherwise identical procedures.
All bromoacetylated peptides were synthesized using standard Fmoc chemistry35 (see Supplementary Note 1 for details). Coupling-deprotection cycles were performed with Fmoc-Gly-OH, Fmoc-Lys(Alloc)-OH, and Fmoc-Gly-OH (in this order), and the N-terminal amine was biotinylated. Thereafter, The Alloc group protecting the Lys side chain was removed by treatment with Pd(PPh3)4, and the branch were synthesized by
coupling-deprotection cycles with Fmoc-photoMet-OH followed by a spacer amino acid. The N-terminus of the branch was then bromoacetylated with 40 μL bromoacetic anhydride with the presence of DIEA, and the peptide was cleaved from the resin and purified over a semi-preparative reverse phase (RP)-HPLC.
Crosslinkable ppGpp was synthesized by conjugating each bromoaceylated peptide (3a-d) to equimolar ppGpp(3’βS) (for 1a-d) or to ppGpp(5’βS) at pH = 6.2 (for 2a-d) at 42 oC for 2 hr. Each conjugate was purified from a 2-μmol scale reaction using a MonoQ (5/50) column at 4 oC using a linear gradient of buffer A (5 mM HEPES-Na pH 7.0) and buffer B (5 mM HEPES-Na pH 7.0, 1M NaCl). Crosslinkable ppGpp were stable at −80 oC for at least three months. For MS analysis, each conjugate was first adsorbed to C18-Ziptips (Millipore) for desalting followed by elution in 50% (v/v) acetonitrile containing 1 mM ammonium formate. The eluate was then analyzed by a Bruker Daltonics APEXIV 4.7 Tesla Fourier Transform Ion Cyclotron Resonance Mass Spectrometer (FT-ICR-MS).
A
uthor Man
uscr
ipt
A
uthor Man
uscr
ipt
A
uthor Man
uscr
ipt
A
uthor Man
uscr
ipt
Effector capture and enrichment from E. coli lysate
E. coli AT713 was cultured in the SILAC medium containing either regular lysine and arginine (the light medium) or 13C615N2-lysine and 13C615N4-arginine (the heavy medium).
Lysates were prepared in 20 mM HEPES-Na 7.0, 100 mM NaCl, 0.2 mM
phenylmethylsulfonyl fluoride (PMSF), and 10 μg/mL lysozyme at 4.5 mg / mL protein.
1a-d an1a-d 2a-1a-d were mixe1a-d in equimolar for a 0.5 mM cocktail. Then, two reactions were
assembled in adjacent wells on a 96-well plate chilled on ice. The effector-capture reaction consisted of 540 μg protein from the heavy lysate, 100 μM crosslinkable ppGpp cocktail, 10 mM MgCl2, and 1 mM MnCl2. The control reaction consisted of 540 μg protein from the
light lysate, 100 μM crosslinkable ppGpp cocktail, 5 mM native ppGpp, 15 mM MgCl2 and
1.5 mM MnCl2. After exposure to 365-nm UV lamp for 2 minutes, reactions were then
combined and extensively exchanged in a 10kDa-MWCO concentrator into a buffer
containing 20 mM HEPES-Na and 200 mM NaCl. At this stage, 50 μg protein was saved for input control, and the rest was concentrated to 100 μL, diluted with 400 μL RIPA buffer (50 mM Tris 7.5, 150 mM NaCl, 0.1% SDS, 0.5% sodium deoxycholate, 1% Triton X-100) and incubated overnight with 200 μL MyOne Streptavidin C1 dynabeads (Thermo Fisher Scientific) at 4 oC. On the second day, the protein in supernatant (flowthrough) was sampled for Western blotting and then removed, and the dynabeads were washed at 4 oC twice with RIPA buffer, once with 0.1 M Na2CO3, twice with 100 mM Tris 8.0, 5 M guanidinium
chloride (GuHCl) and twice more with RIPA buffer. Bound protein was eluted through boiling the dynabeads in 40 μL SDS-PAGE loading dye containing 2 mM biotin. Tryptic fragment preparation
For input controls, the lysate mixture (50 μg protein) was treated with 10 mM DTT at 56 oC for 1 hr followed by 55 mM iodoacetamide at RT for 1 hr in the dark, and then digested with 1 μg trypsin (Promega) at RT overnight. Thereafter, the sample was acidified with formic acid (5% final concentration) and applied to C18 SpinTips (Protea Biosciences). After washing with 0.1% formic acid in water, tryptic fragments were eluted with 80% acetonitrile in water containing 0.1% formic acid. The eluate was dried in a speedvac and reconstituted in 100 μL and then diluted 1:50 both in 0.1% formic acid, and 5 μL dilute was used for LC-MS2 analysis.
Eluates from streptavidin dynabeads were first resolved on a 12% SDS-PAGE, which was subsequently stained with Coomassie Brilliant Blue (CBB), revealing three major protein bands, the streptavidin at 13 kDa, EF-Tu at 40 kDa and EF-G at 80 kDa. The gel lane for each eluate was excised and regions below the 15-kDa or above the 200-kDa marker were trimmed off. The lane was further divided into three samples and processed separately: the EF-Tu and EF-G bands (sample A), the fragment below EF-Tu (sample B), and the rest (sample C). The gel fragments were diced into 1-mm pieces, and then treated with 10 mM DTT at 56 oC for 1 hr followed by 55 mM iodoacetamide at RT for 1 hr in the dark. After a brief wash with 0.1 M NH4HCO3, gel pieces were dehydrated with acetonitrile, dried in a
speedvac, and re-hydrated with a minimal volume of 6 ng/μL trypsin in 0.1 M NH4HCO3 for
digestion at RT overnight. Thereafter, tryptic fragments were extracted by four shrinking-swelling iterations. In each iteration, gel pieces were first dehydrated with 5% formic acid in 50% (v/v) acetonitrile (first two iterations) or neat acetonitrile (second two). Supernatant
A
uthor Man
uscr
ipt
A
uthor Man
uscr
ipt
A
uthor Man
uscr
ipt
A
uthor Man
uscr
ipt
containing tryptic fragments was then removed for collection and gel pieces were re-swelled with 0.1 M NH4HCO3 in water. The combined supernatant was dried in a speedvac and
reconstituted in 50 μL 0.1% formic acid. 5 μL was used for LC-MS2 analysis. LC-MS2 based proteomics
Tryptic fragments were separated by RP-HPLC (Thermo Easy nLC1000) using a precolumn (made in house, 6 cm of 10 μm C18) and a self-pack 5 μm tip analytical column (12 cm of 5 μm C18, New Objective) over a 140 minute gradient before nanoelectrospray using a QExactive mass spectrometer (Thermo). Raw mass spectral data files (.raw) were searched using Proteome Discoverer 2.1 (Thermo) and Mascot version 2.4.1 (Matrix Science). Mascot search parameters were: 10 ppm mass tolerance for precursor ions; 15 mmu for fragment ion mass tolerance; 2 missed cleavages of trypsin; fixed modification were
carbamidomethylation of cysteine; variable modifications were methionine oxidation,
13C
615N2 (K) and 13C615N4 (R). Only peptides with a Mascot score greater than or equal to
25 and an isolation interference less than or equal to 30 were included in the data analysis. Effector capture and LC-MS2 identification was performed on three biological replicates. SILAC quantification was obtained using the area of the precursor-ion peaks. In the case of missing detection of the light or heavy ion, a SILAC ratio of 10 or 0.1 was arbitrarily assigned. The values were then normalized to the median relative protein quantification ratios obtained from the corresponding loading controls. SILAC ratio of a unique peptide sequence was calculated as the mean of all precursor ions that match the sequence regardless of modifications. SILAC ratio of a protein was calculated as the mean of all unique peptides mapped to the protein. Only proteins detected in at least two replicates each by at least two unique tryptic fragments were reported. SILAC ratios were converted to log2 units and, for
each protein, the mean and p-value for that log2(SILAC ratio) < 1 was calculated.
Metabolic profiling of E. coli
Overnight starter culture in M9GAV was diluted to OD600 = 0.005 in fresh medium, grown
at 37 oC to OD600 reached between 0.2 and 0.3, and then treated with inducers or labeling
reagents. Untreated control samples were harvested from the same culture 1 minute prior to the treatment. RNAP 1-2- mutant strains: ML2916 (+ pR1–1His) and ML2917 (+pR1– 1His(D275G)) were treated with 50 μM or 150 μM IPTG for growth tests and ppGpp quantification (Fig. 1c-d); samples for metabolite profiling were collected 15-min following treatment by 150 μM IPTG (Figs. 3a-b and 4c). Wild-type control strains, ML2914 (+ pR1– 1His) and ML2915 (+pR1–1His(D275G)) were treated with 50 μM or 150 μM IPTG for growth tests and ppGpp quantification (Figs 1c-d); samples for metabolite profiling were collected 10-min following treatment by 75 μM IPTG (Figs. 3a-b and 4c). MG1655 strain ML2920 and purF(R45A) strain ML2924, both harboring pR1–1His, were induced by 40 μM IPTG for hydrophilic metabolite profiling (Fig. 5c-e and Supplementary Fig. 5b-c). ML2920 was also treated by 0.63% 13C215N-glycine, uninduced or 5-minute post induction
by 40 μM IPTG for hydrophilic metabolite profiling (Fig. 3c).
Experimental procedures for metabolite extraction were modified from those described by Park et al.36. Briefly, E. coli cells were collected on a 0.22-μm hydrophilic PVDF membrane
A
uthor Man
uscr
ipt
A
uthor Man
uscr
ipt
A
uthor Man
uscr
ipt
A
uthor Man
uscr
ipt
by vacuum filtration and immediately immersed in ice-cold lysis solvent, a methanol-acetonitrile-water mixture in a volume ratio of 40:40:20 containing 0.05% (v/v)
Metabolomics Amino Acid Mix Standard solution (Cambridge Isotope Laboratories, MSK-A2–1.2) as the internal standard (ISTD). Lysates were briefly sonicated and diluted by the lysis solvent to 1.0 OD600 cells per mL solvent.
(p)ppGpp was quantified over a MonoQ 5/50 column: lysate equivalent to 1.0 OD600 cells
were transferred to 3.0 mL aqueous solution of 10 mM Tris-HCl pH 8.0 and applied to the column after passing through a 0.22-μm syringe filter. (p)ppGpp were eluted at 4 oC using a linear NaCl gradient at pH = 8.0 and the peak areas were interpolated to a working curve of external ppGpp standards.
Metabolites other than (p)ppGpp were quantified with pHILIC-MS as follows: lysates cleared from debris were lyophilized and reconstituted in 200 μL water and 2 uL were injected into a ZIC-pHILIC 150 × 2.1 mm (5 μm particle size) column (EMD Millipore) running at 0.15 mL / min. Metabolites were eluted using a linear gradient between solvent A (20 mM (NH4)2CO3, 0.1% ammonium hydroxide); and solvent B (acetonitrile), with the
percentage of solvent B decreasing from 80–20% over 20 min. For relative quantifications, a peak area of 1.0×10⁴ was arbitrarily assigned to undetected metabolites. Then, peak area was normalized to the ISTD amino acid with the closest retention time and ionized by the same charge for fold change calculation. For absolute quantifications for AMP, ADP, ATP, GMP, GDP and GTP, external standards containing these nucleotides at a series of concentrations were prepared in the presence of 0.25% ISTD (v/v). Note that this ISTD concentration is identical to that in reconstituted samples. Absolute quantification was achieved by interpolation of ISTD-normalized peak areas to a working curve of external standards.
PurF expression, purification and biochemical reconstitution
PurF used for crystallization was expressed without affinity tag from the plasmid “G23–1nt” (Supplementary Table 5). PurF variants used for biochemical and ITC analyses were expressed with an auto-cleaving Cfa-His6 tag from the “G23–1Cfa” plasmid and related
mutants33. Expression was carried out in BL21(DE3) hosts in LB and induced at 18 oC for 20 hours with 200 μM IPTG. Lysate containing tagless PurF was first treated with protamine sulfate (8 mg per gram cell pellet) to precipitate nucleic acids and the cleared lysate was then fractionated over a DEAE-sepharose column. Peak fractions were combined and then subject to fractionation with (NH4)2SO4. Precipitates collected between 40% and 47.5%
saturation (4 oC) were dissolved in the size-exclusion chromatography (SEC) buffer (20 mM HEPES-Na 7.4, 150 mM NaCl, 2 mM MgCl2 and 1mM TCEP). PurF-Cfa-His6 was purified
over a Ni-NTA column using standard protocols and the eluate was treated with 100 mM sodium 2-mercaptoethanesulfonate (MESNa), 100 mM L-cysteine and 20 mM TECP at pH 7.0 and RT overnight. Note that this treatment substituted a Cys residue for the Cfa-His6
tag37. The cleavage mixture was extensively dialyzed against the SEC buffer and then subject to a reverse Ni-NTA process. All PurF proteins were refined over a Superdex-200 column running in SEC buffer prior to analytical applications.
A
uthor Man
uscr
ipt
A
uthor Man
uscr
ipt
A
uthor Man
uscr
ipt
A
uthor Man
uscr
ipt
Biochemical analysis was performed in 100-μL reactions in a 96-well plate at 25 oC. Each reaction contained 50 mM HEPES-Na pH 7.4, 150 mM NaCl, 10 mM MgCl2, 1 mM TCEP,
5 mM glutamine, 5 mM ATP, 5 mM glycine, 50 nM PurF, 1 μM E. coli PurD, 3.75 mM PEP, 0.5 mM NADH, pyruvate kinase and lactate dehydrogenase (10 units/mL each), and the indicated amounts of pRpp-Mg and ppGpp-Mg. Absorbance of each reaction was monitored for the absorbance at 340 nm (A340) every 15 seconds.
X-ray crystallography of the PurF-ppGpp complex
Crystals were grown by hanging drop vapor diffusion with drops containing 2 μL of protein (25 mg/mL PurF in 20 mM HEPES-Na pH 7.4, 150 mM NaCl, 1 mM TCEP, 5 mM ppGpp and 15 mM MgCl2) mixed with 2 μL of well solution (0.1 M HEPES-Na pH 7.4, 24%
PEG3350 and 4% iPrOH) at 18 oC. After 5 days crystals were looped out of the drop and frozen in liquid nitrogen without any cryo-protectant added. Diffraction data were collected at the APS, using the NE-CAT beamline 24-IDC on a Pilatus 6M detector.
Diffraction data were indexed, integrated, and scaled using HKL200038. The phase problem was solved by molecular replacement with PHASER39 using chain A of PDB entry 1ECJ as a search model40. The resulting solution was isomorphous with 1ECJ, with a D2 symmetric tetramer in the asymmetric unit. The model was refined using PHENIX41 with manual model building in COOT42. Ramachandran statistics: 96.36% favored, 3.64% allowed, 0% outlier.
Modeling of ppGpp in the binding sites was complicated by the overlap between adjacent sites across a two-fold non-crystallographic symmetry (NCS) axis. Readily interpretable density for the guanosine base was observed at a low contour level in the non-overlapping part of each site but the density for the phosphates was in a large mass of density spanning the NCS axis in which individual atom positions could not be readily visualized because the density was clearly the average of two overlapped NCS-related copies of ppGpp. It was evident from the compactness of the density in the overlap region that the phosphate groups must be coordinated by a divalent cation, so 0.5 occupancy model structures with Mg+2 coordinated were placed in both possible orientations and refined with tight constraints on the Mg coordination. The best result was achieved with a conformation in which the four phosphates interacted with the ion with nearly ideal square-planar octahedral geometry. As expected, the refined occupancy of the NCS-related copies did not deviate significantly from the starting value.
Isothermal titration calorimetry
ITC was performed using VP-ITC MicroCalorimeter (Malvern Panalytical). ppGpp-Mg in SEC buffer was injected at 10 nmol/injection to hit protein loaded in the sample cell. All proteins titrated were SEC-purified. ppGpp and MgCl2 were originally prepared as 100 mM
and 1 M stock solution in water, respectively. The ppGpp-Mg solution was assembled immediately prior to use by diluting ppGpp and MgCl2 in the SEC buffer at 2 mM for the
titration of Upp and PurA, or 1 mM for the titration of all other proteins. Protein
concentrations (counted as monomer) in the sample cell were 240 μM for GdhA, 200 μM for Gpt, Hpt, Upp, and PurA, and 100 μM for SpeC, Gsk, PurF, GmpA and Mpl, 50 μM for
A
uthor Man
uscr
ipt
A
uthor Man
uscr
ipt
A
uthor Man
uscr
ipt
A
uthor Man
uscr
ipt
Gnd, His6-FolC, His6-Cmk, His6-Idh and His6-Pgk. For the titration of PurA, 1 mM inosine
monophosphate (IMP) was also supplemented to both ligand and protein solutions. Blank titrations were performed with protein-free SEC buffer in the sample cell.
ITC data were processed using Origin software (MicroCal), which automatically integrates heat signal and calculates the molar enthalpy change (ΔHm) and the overall
ligand-to-receptor molar ratio ( [L]/[R] ) at each injection. ΔHm was first corrected by subtracting the
corresponding blank-titration data.
Sigmoidal ΔHm – [L]/[R] relationships were seen in titrations of SpeC, Upp, PurF, PurA,
Gpt, Hpt, where ΔHm approximated zero at the end of titration. These datasets were fitted to
a single-site model with both stoichiometry (n) and KD as variables. Sigmoidal isotherms
were also seen in the titrations of Gsk and GdhA by ppGpp-Mg with ΔHm approximated a
non-zero value. We attributed this residual ΔHm to a second, weak binding site and hence
fitted these dataset to a sequential two-site model. Finally, if ΔHm attenuated hyperbolically
with [L]/[R], the dataset was also fitted to a single-site model, but with stoichiometry (n) fixed at one site per subunit. Such isotherms were seen in titrations of GmpA, Mpl, Gnd, His6-FolC, His6-Cmk, His6-Idh, His6-Pgk and two PurF mutants (R58A and H59A).
Biochemical validation of other candidate ppGpp-binding protein
General considerations—With one exception (ornithine decarboxylase), all biochemical assays were performed in 96-well plates at 25 oC in a Spectramax M5 plate reader
(Molecular Devices). Volume of each reaction was 100 μL unless noted otherwise. Absorbance of each reaction was monitored for the absorbance at 340 nm (A340) every 15 seconds. Water-soluble small-molecule reagents were dissolved in water and pH adjusted to 7.4. Nucleobases (guanine, hypoxanthine and uracil) were reconstituted in 0.1 M NaOH. All above chemicals were diluted to 10X working concentration in water immediately prior to use. Recombinant proteins were SEC-purified and diluted in SEC buffer to 10X working concentration. Typically, a reaction was assembled by first mixing all components except one essential substrate. The left-out substrate was then simultaneously transferred to multiple wells at t = 0 to initiate the reaction.
Biochemical activities that directly produce or consume NADH were monitored real-time by the absorption at 340 nm (A340) of the reaction. Other activities were, if possible, coupled to
the production or consumption of NADH to enable real-time monitoring. In particular, production of ADP was quantitatively coupled to the stoichiometric consumption of NADH via the activity of excess pyruvate kinase (PK, type-III from rabbit muscle, Sigma) and lactate dehydrogenase (LDH, from rabbit muscle, Roche) by the following reaction: ADP + PEP + NADH + H+→ ATP + lactate + NAD+
PEP is phosphoenolpyruvate. To this end, a 20X PK-LDH mixture was prepared in water, which contained PEP (monopotassium salt from Roche, 75 mM), NADH (disodium salt from Roche, 10 mM), PK and LDH (200 units/mL each)9.
A
uthor Man
uscr
ipt
A
uthor Man
uscr
ipt
A
uthor Man
uscr
ipt
A
uthor Man
uscr
ipt
Uracil phosphoribosyltransferase (Upp) assay—Upp catalyzes the production of uridine monophosphate (UMP) from uracil and pRpp:
uracil + pRpp → UMP + PPi
UMP was then phosphorylated to UTP by the activities of uridylate kinase PyrH and nucleoside diphosphate kinase Ndk (both purified in this study).
UMP + 2ATP → UTP + 2ADP
PK-LDH then coupled ADP production to the consumption of NADH. The overall reaction was:
uracil + pRpp + 2 PEP + 2 NADH + 2H+→ UTP + PPi + 2 lactate + 2 NAD+
Each reaction contained 50 mM HEPES-Na pH 7.4, 150 mM NaCl, 10 mM MgCl2, 1 mM
TCEP, 0.2 mM uracil, 1mM pRpp, 5 mM ATP, 100 nM Upp, 1 μM each E. coli PyrH and Ndk, 1X PK-LDH mixture and indicated amounts of GTP-Mg and/or ppGpp-Mg.
Guanine phosphoribosyltransferase (Gpt) assay—Gpt catalyzes the production of guanosine monophosphate (GMP) from guanine and pRpp. GMP was then phosphorylated to GTP by the activities of guanylate kinase Gmk and nucleoside diphosphate kinase Ndk (both purified in this study). These kinase activities were coupled to NADH consumption by the activities of PK-LDH. The overall reaction was:
guanine + pRpp + 2 PEP + 2 NADH + 2H+→ GTP + PPi + 2 lactate + 2 NAD+
Each reaction contained 50 mM HEPES-Na pH 7.4, 150 mM NaCl, 10 mM MgCl2, 1 mM
TCEP, 0.2 mM guanine, 5 mM ATP, 200 nM Gpt, 1 μM each E. coli Gmk and Ndk, 1X PK-LDH mixture and indicated amounts of pRpp-Mg or ppGpp-Mg.
Adenylosuccinate synthase (PurA) assay—PurA ligates asparate to IMP to form adenylosuccinate. The reaction was coupled to the hydrolysis of GTP:
IMP + GTP + aspartate → adenylosuccinate + GDP + Pi
GDP was then phosphorylated by ATP with Ndk, and the concomitant formation of ADP was coupled to NADH consumption by PK-LDH. The overall reaction was:
IMP + aspartate + PEP + NADH + H+→ adenylosuccinate + Pi + lactate + NAD+ Each reaction contained 50 mM HEPES-Na pH 7.4, 150 mM NaCl, 10 mM MgCl2, 1 mM
TCEP, 2 mM L-aspartate, 1 mM IMP, 2 mM ATP, 300 nM PurA, 1 μM E. coli Ndk, 1X PK-LDH mixture and indicated amounts of GTP-Mg and/or ppGpp-Mg.
Inosine/guanosine kinase (Gsk) assay—Gsk catalyzes the phosphorylation of inosine (Ino) or guanosine (Guo) using ATP:
Ino(Guo) + ATP → IMP(GMP) + ADP
A
uthor Man
uscr
ipt
A
uthor Man
uscr
ipt
A
uthor Man
uscr
ipt
A
uthor Man
uscr
ipt
PK-LDH further coupled ADP production to the consumption of NADH. The overall reaction was:
Ino(Guo) + PEP + NADH + H+→ IMP(GMP) + lactate + NAD+
Each reaction contained 50 mM HEPES-Na pH 7.4, 150 mM KCl, 5 mM MgCl2, 1 mM
TCEP, 500 nM Gsk, 1X PK-LDH mixture and the indicated amounts of ATP-Mg, ppGpp-Mg and Ino or Guo.
IMP dehydrogenase (GuaB) assay—GuaB catalyzes the oxidization of IMP into xanthosine monophosphate (XMP) and the concomitant production of NADH from NAD+: IMP + NAD+→ XMP + NADH
Due to the low substrate concentration, reactions were setup at 200-μL scale to ensure accuracy of the absorbance readout. In assays with the presence of Mg2+, each reaction contained 50 mM HEPES-Na pH 7.4, 150 mM KCl, 5 mM MgCl2, 1 mM TCEP, 2 mM
NAD+, 300 nM E. coli GuaB and indicated amounts of IMP and ppGpp-Mg. For the Mg2+
-free assay, GuaB was subject to SEC in a Mg2+-free buffer, MgCl2 was excluded from the
reaction buffer, and ppGpp lithium salt was used in place of ppGpp-Mg complex. Hypoxanthine (Hx) phosphoribosyltransferase (Hpt) assay—Hpt catalyzes the production of IMP from Hx and pRpp. IMP was oxidized into XMP by excess GuaB to produce NADH. The overall reaction was:
Hx + pRpp + NAD+→ XMP + PPi + NADH + H+
Each reaction contained 50 mM HEPES-Na pH 7.4, 150 mM KCl, 10 mM MgCl2, 1 mM
TCEP, 0.2 mM Hx, 2 mM NAD+, 30 nM Hpt, 3 μM E. coli GuaB, and indicated amounts of pRpp or ppGpp-Mg.
Ornithine decarboxylase (SpeC) assay—SpeC converts ornithine into putrescine and bicarbonate:
L-ornithine + H+→ CO2 + putrescine
Each reaction (200 μL) contained 50 mM HEPES-Na pH 7.4, 150 mM NaCl, 2 mM MgCl2,
1 mM TCEP, 100 nM SpeC and indicated amounts of GTP-Mg or ppGpp-Mg, and the reaction was started by addition of 1 mM ornithine and allowed to proceed at 37 oC in a water bath for 3 minutes. The reaction was stopped by the addition of 100 μL chloroform and vortexing. The aqueous layer was quantitatively recovered, diluted to 1 mL, and was treated with 100 μL 1 M phthalic anhydride in chloroform at 37 oC for 10 minutes with vigorous shaking. Upon phase separation, 500 μL aqueous layer was applied to a Mono Q 5/50 column (GE Healthcare). Derivatives of ornithine and putrescine were eluted at 4 oC using a linear gradient of buffer A (5 mM Na pH 7.0) and buffer B (5 mM HEPES-Na pH 7.0, 1M HEPES-NaCl), with the percentage of buffer B increasing from 15 to 50% within 10.5 mL. Samples of pure ornithine and putrescine were derivatized and analyzed under the same conditions to identify their derivatives in the chromatogram.
A
uthor Man
uscr
ipt
A
uthor Man
uscr
ipt
A
uthor Man
uscr
ipt
A
uthor Man
uscr
ipt
Statistics.
For metabolite quantification, one independent culture of the strain of interest was grown and harvested for each replicate. In enzyme-kinetic assays, each replicate was a reaction assembled with the same set of substrate/auxiliary enzyme preps, but with different dilutions of the enzyme of interest. In all relevant figure panels, values of mean ± range (n = 2) or mean ± S.D. (n = 3) were reported and the exact n value is described in each figure legend. Two-tailed Student’s t tests reported in Fig. 5c-d were performed with assumptions for Gaussian distribution and equal variance. The degrees of freedom for all tests was 4, for n = 3 in each set.
Reporting Summary.
Further information on experimental design is available in the Nature Research Reporting Summary linked to this article.
Data Availability.
Structural data for the PurF-ppGpp complex used to generate Fig. 4d-f, 5a and
Supplementary Fig. 4b-d have been deposited in RCSB PDB (https://www.rcsb.org/) with an identifier 6CZF. Raw proteomic LC-MS2 data as sources of Tables 1, Fig. 2c and the Supplementary Dataset have been deposited to the ProteomeXchange Consortium via the PRIDE partner repository with the dataset identifiers PXD010402 and 10.6019/PXD010402. All other data generated or analyzed during this study are included in this published article (and its Supplementary Information files) or are available from the corresponding author on reasonable request
Supplementary Material
Refer to Web version on PubMed Central for supplementary material.
Acknowledgements
We thank M. Guo, J. Kraemer, and P. Culviner for comments on the manuscript. We thank T. Muir (Princeton University) and S. Lovett (Brandeis University) for providing protein expression vectors. This research made use of the Pilatus detector (RR029205) at the NE-CAT beamline 24-IDC (GM103403) of the Advanced Photon Source (DE-AC02–06CH11357). We thank members of the Drennan lab for collecting the diffraction data at APS. We thank the Koch Institute Swanson Biotechnology Center (Biopolymer and Proteomic Core Facility) for help with quantitative mass spectrometry and the Whitehead Institute Metabolite Profiling Core Facility for measuring metabolite levels. Instrumentation resources from the Biophysical Instrumentation Facility for the Study of Complex Macromolecular Systems (NSF-0070319), the Structural Biology Core Facility, and the BioMicro Center in the Department of Biology at MIT are gratefully acknowledged. This work was supported by a fellowship from the Jane Coffin Childs Memorial Fund for Medical Research to B.W. and an NIH grant to M.T.L. (R01GM082899), who is also an Investigator of the Howard Hughes Medical Institute.
References
1. Atkinson GC, Tenson T & Hauryliuk V The RelA/SpoT homolog (RSH) superfamily: distribution and functional evolution of ppGpp synthetases and hydrolases across the tree of life. Plos One 6, doi:ARTN e23479