Submitted to
11111111114111
Copyright WILEY-VCH Verlag GmbH & Co. KGaA, 69469 Weinheim, Germany, 2013.
Supporting Information
for Small, DOI: 10.1002/smll.201302889
Fluorescence-Encoded Gold Nanoparticles: Library Design and Modulation of Cellular Uptake into Dendritic Cells
Laura Rodriguez-Lorenzo*, Kleanthis Fytianos, Fabian Blank, Christophe von Garnier, Barbara Rothen-Rutishauser, and Alke Petri-Fink *
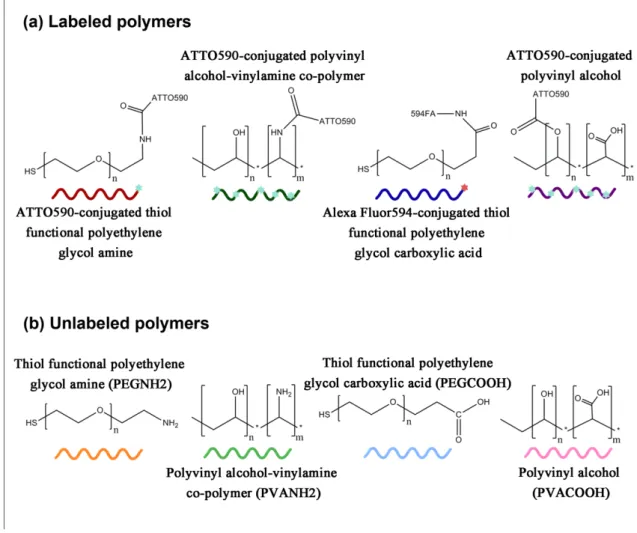
Figure S1. Chemical structures of dye-conjugated (a) and unlabeled (b) polymers used for coating of Au-NPs and their schematic drawings used in the Figure 1.
Submitted to
22222222224222
Figure S2. Chemical structure and electronic absorption and emission spectra of ATTO590 (blue) and Alexa Fluor 594 (AF594) (red). Both, absorption and emission were recorded in PBS solutions.
Figure S3. Emission spectra of (a) homo-functionalized and (b) hetero-functionalized Au-NPs. Emission were recorded in PBS (phosphate buffered saline) solution.
Submitted to
33333333334333
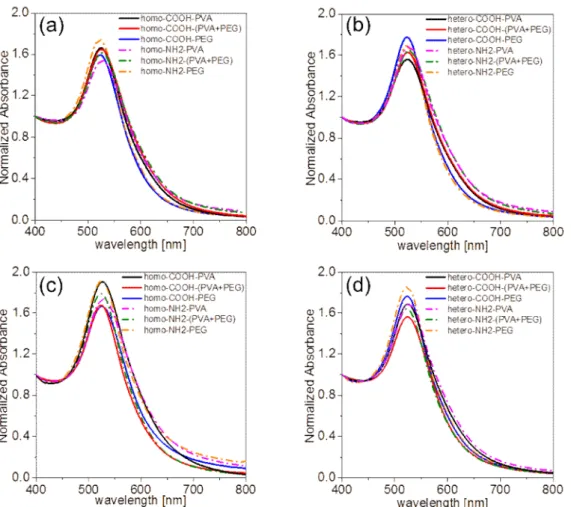
Figure S4. Colloidal stability in serum supplemented cell culture medium. UV-Vis spectra of homo- (a, c) and hetero-functionalized (b,d) Au-NPs kept at 37°C and 5% CO2 in RPMI 1640 medium (10% FCS, 1% L-Glu, 1% Pen-Strep, 10 ngmL-1 GM-CSF AND 10 ngmL-1 IL-4). The particles were incubated for 1 h (a, b) and 24 h (c, d).
Submitted to
44444444444444
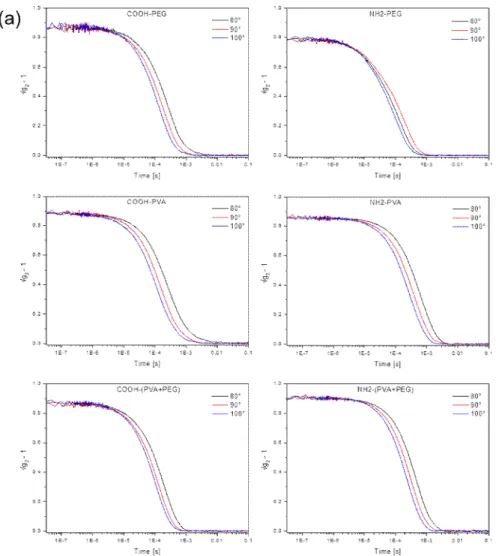
Figure S5. Temporal correlation functions recorded for unlabeled homo-functionalized (a), homo-functionalized (b), and hetero-functionalized (c) Au-NPs. Dynamic
light-scattering measurements were carried out at room temperature and at three different light-scattering angles of 80, 90 and 100°, using a 3D LS spectrometer (LS instruments) equipped with a 21 mW HeNe laser (632.8 nm). Data was collected over 4 mins and three independent
correlation functions were measured. The corresponding correlation functions were analyzed using the constrained regularized Cumulant method (Table S1).
Submitted to
55555555554555
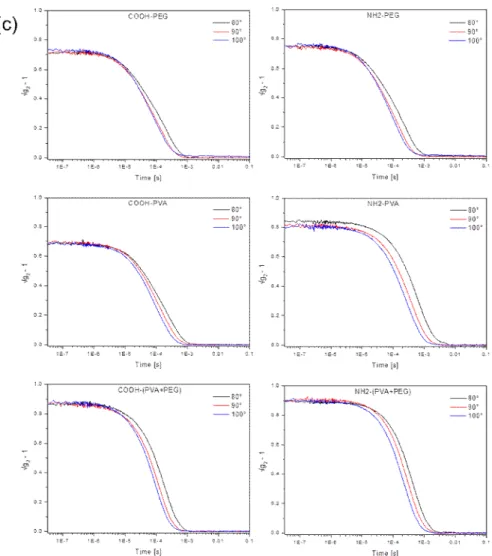
Figure S5. Temporal correlation functions recorded for unlabeled homo-functionalized (a), homo-functionalized (b), and hetero-functionalized (c) Au-NPs. (continuation…)
Submitted to
66666666664666
Figure S5. Temporal correlation functions recorded for unlabeled homo-functionalized (a), homo-functionalized (b), and hetero-functionalized (c) Au-NPs. (continuation…)
Submitted to
77777777774777
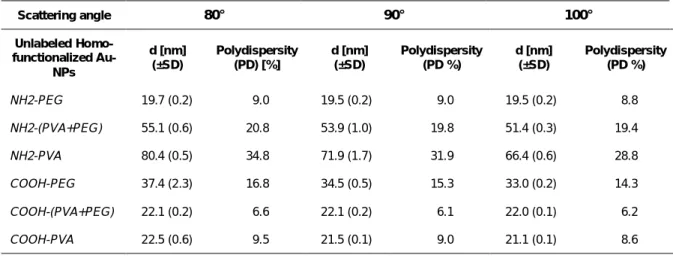
Table S1. Hydrodynamic diameter of polymer coated Au-NPs obtained by DLS
measurements at room temperature and at a three different scattering angles of 80°, 90° and 100°.a) Scattering angle 80° 90° 100° Unlabeled Homo-functionalized Au-NPs d [nm] (±SD) Polydispersity (PD) [%] d [nm] (±SD) Polydispersity (PD %) d [nm] (±SD) Polydispersity (PD %) NH2-PEG 19.7 (0.2) 9.0 19.5 (0.2) 9.0 19.5 (0.2) 8.8 NH2-(PVA+PEG) 55.1 (0.6) 20.8 53.9 (1.0) 19.8 51.4 (0.3) 19.4 NH2-PVA 80.4 (0.5) 34.8 71.9 (1.7) 31.9 66.4 (0.6) 28.8 COOH-PEG 37.4 (2.3) 16.8 34.5 (0.5) 15.3 33.0 (0.2) 14.3 COOH-(PVA+PEG) 22.1 (0.2) 6.6 22.1 (0.2) 6.1 22.0 (0.1) 6.2 COOH-PVA 22.5 (0.6) 9.5 21.5 (0.1) 9.0 21.1 (0.1) 8.6 Homo-functionalized Au-NPs NH2-PEG 18.6 (0.2) 8.9 18.4 (0.1) 9.1 18.7 (0.6) 9.3 NH2-(PVA+PEG) 64.4 (0.6) 29.5 53.5 (0.6) 20.0 53.0 (0.4) 23.8 NH2-PVA 73.2 (6.0) 38.1 64.1 (0.3) 33.0 56.9 (0.4) 29.2 COOH-PEG 20.9 (0.1) 7.5 19.1 (0.1) 7.1 20.6 (0.1) 7.0 COOH-(PVA+PEG) 24.1 (4.3) 9.8 22.4 (0.1) 6.3 21.3 (0.1) 7.0 COOH-PVA 20.1 (0.2) 9.9 21.1 (0.2) 10.6 21.9 (0.2) 11.0 Hetero-functionalized Au-NPs NH2-PEG 32.5 (4.8) 15.0 32.3 (4.9) 14.6 32.2 (8.1) 14.3 NH2-(PVA+PEG) 35.0 (2.1) 15.8 33.5 (0.3) 14.6 33.1 (3.2) 15.4 NH2-PVA 53.1 (0.8) 24.5 50.0 (0.3) 22.6 47.5 (1.1) 21.3 COOH-PEG 23.2 (0.1) 10.4 23.9 (1.6) 10.6 24.4 (1.7) 10.7 COOH-(PVA+PEG) 32.7 (4.5) 15.3 32.2 (2.4) 15.1 33.2 (4.1) 15.5 COOH-PVA 30.1 (0.9) 13.9 28.5 (3.6) 13.1 26.3 (2.8) 11.8
Submitted to
88888888884888
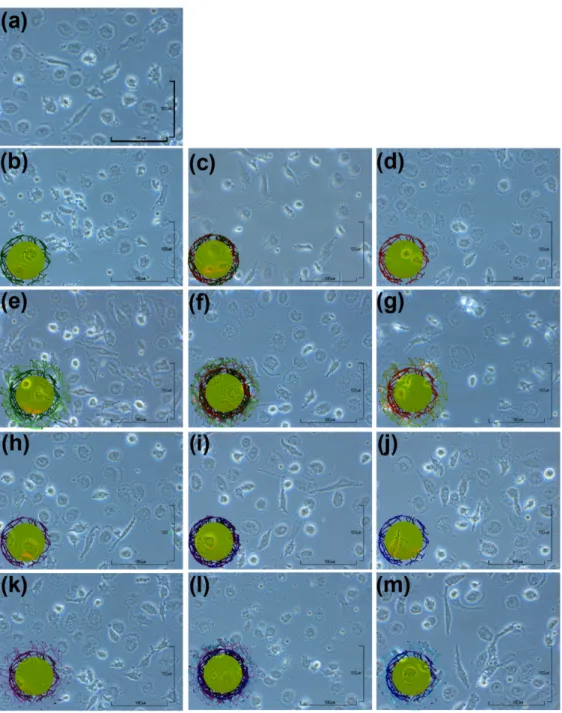
Figure S6.Phase contrast images of MDDCs after incubation with (a) no particles (control), homo-functional (b) NH2-PVA, (c) NH2-(PVA+PEG), (d) NH2-PEG, (h) COOH-PVA, (i) COOH-(PVA+PEG), and (j) COOH-PEG Au-NPs; and hetero-functional (e) NH2-PVA, (f) NH2-(PVA+PEG), (g) NH2-PEG (k) PVA, (l) (PVA+PEG), and (m) COOH-PEG Au-NPs.
Submitted to
99999999994999
Figure S7. Release of lactate dehydrogenase (LDH) from human monocyte-derived dendritic cells (MDDC) after 15 h suspension exposure (Triton X-100 was used as the positive control, 1%) to unlabeled Au-NPs, as well as homo-functional and hetero-functional Au-NPs. Bars denote the mean standard deviation. A pairwise t-test was performed and significance was indicated by: *p < 0.001 versus untreated cells.
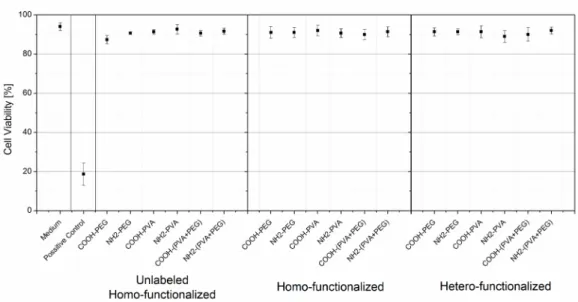
Figure S8. The viability of human monocyte-derived dendritic cells (MDDCs) was elaborated by Trypan blue exclusion assay (error bars = mean ± SD). Values were significant when compared to medium (pairwise t-test, *p< 0.05). Frozen cell cultures at -80 °C for 30 mins were used as the positive control.
Submitted to