Computational Design of
Therapeutic Monoclonal Antibody Formulations
by
Theresa K. Cloutier
B.S., Brown University (2015)
Submitted to the Department of Chemical Engineering
in partial fulfillment of the requirements for the degree of
Doctor of Philosophy
at the
MASSACHUSETTS INSTITUTE OF TECHNOLOGY
May 2020
© Massachusetts Institute of Technology 2020. All rights reserved.
Author . . . .
Department of Chemical Engineering
April 28, 2020
Certified by. . . .
Bernhardt L. Trout
Raymond F. Baddour, ScD, (1949) Professor of Chemical Engineering
Thesis Supervisor
Accepted by . . . .
Patrick S. Doyle
Robert T. Haslam (1911) Professor of Chemical Engineering
Chairman, Committee for Graduate Students
Computational Design of
Therapeutic Monoclonal Antibody Formulations
by
Theresa K. Cloutier
Submitted to the Department of Chemical Engineering on April 28, 2020, in partial fulfillment of the
requirements for the degree of Doctor of Philosophy
Abstract
Antibody formulation research seeks to move the field from heuristics and rules of thumb to mechanistic approaches. Traditionally, formulations are designed via signifi-cant trial and error work after the phase in which molecule discovery and optimization take place. However, this often leads to molecules failing in late development due to an inability to develop a formulation with the desired properties. This thesis aimed to develop a computational formulation design framework that would allow formula-tion to be addressed during the molecule discovery and optimizaformula-tion steps, allowing molecules able to be formulated to be selected early on. To this end, antibody be-haviors with a variety of different formulation excipients were probed via simulation and experiment, and machine learning models of local antibody-excipient interactions were developed.
The behaviors of three antibodies were simulated in the presence of six excipi-ents: sorbitol, sucrose, trehalose, proline, arginine.HCl, and NaCl. Carbohydrates tended to reduce aggregation propensity due to their preferential interactions with exposed aromatic residues. However, their impact on viscosity was highly dependent on the surface characteristics of the antibody, especially on whether charge effects significantly contributed to the antibody viscosity. Proline tended to interact with aromatic residues, reducing the aggregation of antibodies whose aggregation rate was association-limited. Arginine.HCl could interact via charge effects as well as with hy-drophobic residues, while NaCl only interacted via charge effects. The overall impact of these excipients in terms of aggregation and viscosity was highly dependent on the surface charge distribution on the variable region.
Finally, these local antibody-excipient interactions were modeled using machine learning techniques. These models were shown to capture the important antibody-excipient interactions that are relevant for understanding the impact on stability. Thus, with the implementation of this tool, antibody formulation design could be implemented efficiently during the molecule optimization step, reducing the cost of follow-up formulation work and reducing the likelihood of molecule failure due to formulation issues.
Thesis Supervisor: Bernhardt L. Trout
Acknowledgments
Many thanks to my advisor, Bernhardt Trout, for his guidance and mentorship over these past few years. He welcomed me to the lab to work on an entirely computational project, despite the fact that I had never taken even an intro computer science class. He had faith that I could learn by doing. His encouragement throughout my first few years, when all I accomplished was failing to reproduce existing results, helped me grow as a researcher. His quiet confidence that I would succeed (even if it took much longer than I could have anticipated) was so important to me. I walked out of every meeting feeling newly excited about all the new ideas we had brainstormed to try. I would also like to thank my committee members Professors Dane Wittrup and Stefanie Jegelka for bringing some excellent perspective to my work.
To all the members of the Trout lab past and present, thank you for making the lab such a positive place these five years. To Chaitanya especially, thank you for mentoring me during my early years as a PhD student. I looked up to you in so many ways, and you were never too busy to help me out when I could not figure out what to do next. I appreciate all those times that you truly tried to understand all the minor details of the simulations I was running so that you could help me fix them. Thanks to Mike for knowing everything there was to know about anything, or so I believed. The turning point in my PhD was a conversation we had about force fields in my third year - I could not have done it without you. To Gianpaolo, thanks for always being there, welcoming me to the group, and giving me tips all along the way. To Hadi, thanks for bringing our office together. To Amendra, thanks for being a fountain of information about the future, for volunteering advice on all sorts of things job and career related. To Pin-Kuang and Muhammad, thanks for joining me these past couple years and always being available to talk through research issues.
I have also had the opportunity to spend time with many wonderful people outside my lab. Thanks to all my colleagues in the department, who were always available with research help or a joke or whatever happened to be necessary. To my practice school group, thanks for being truly wonderful. I think back fondly of our time
in Maryland and Australia, and that’s because of the people I was with. Thanks for organizing adventures to go snorkeling and for playing cancellation hearts on all those Friday nights. Thanks especially to my roommates Emma, Junli, and Yunsie -thanks for being with me every step of this whole PhD process. I couldn’t have done it without you. Thanks also to my roommate Melissa, who brought a much-needed dose of non-PhD reality. To my college roommate Sol, thanks for being there for me through it all and for being my biking inspiration. To my college roommate Jie Ying, thanks for keeping me sane on an hourly basis.
To the MIT ultimate frisbee team, Smite, thank you for being one of the most important things to me during my PhD. You all helped me grow as a player and teammate, and thanks for keeping me entertained these last few years. I’m so glad I got out of the ChemE bubble and met each and every one of you. Thanks especially to the other grad students on the team, and particularly to Cynthia for diving into our friendship with a 50 mile bike ride and then 5 days a week of TAing and practice. Smite is filled with so many wonderful people - teammates, coaches, parents who bring food to tournaments - and I am lucky to have been a part of this team. Thanks also to my other frisbee outlets - ChemE IM, Vice, Assorted Beans, GB - this community has made these past few years full of joy.
Finally, to my family, thanks for everything. Thanks for your genuine curiosity about everything in life, and for teaching me that I should always ask questions until I understand.
Contents
1 Introduction 17
1.1 Biopharmaceuticals are a fast-growing class of therapeutics . . . 17
1.2 Stability issues in antibodies . . . 18
1.3 Existing computational tools for mAb design . . . 19
1.3.1 Aggregation mechanisms and tools . . . 19
1.3.2 Viscosity mechanisms and tools . . . 21
1.3.3 Antibody stability and formulation . . . 22
1.4 Preferential interaction theory . . . 23
1.5 Molecular simulations and their use in mAb modeling . . . 24
1.6 Machine learning approaches for mAb-excipient interaction prediction 27 1.7 Thesis objective: Computational formulation design framework . . . . 27
1.8 Thesis overview . . . 28
2 Kirkwood-Buff Derived Alcohol Parameters for Aqueous Carbohy-drates and their Application to Preferential Interaction Coefficient Calculations of Proteins 31 2.1 Introduction . . . 33
2.2 Methodology . . . 34
2.2.1 Molecular Dynamics Simulations . . . 34
2.2.2 Kirkwood-Buff Theory . . . 36
2.2.3 Clustering . . . 36
2.2.4 Preferential Interaction Theory . . . 37
2.3 Results and Discussion . . . 38
2.3.1 Parameter Determination . . . 38
2.3.2 Clustering . . . 43
2.3.3 Preferential Interaction Coefficients . . . 44
2.3.4 Carbohydrate-Protein Interactions with the KBPs . . . 46
2.4 Conclusions . . . 48
3 Molecular computations of preferential interaction coefficients of IgG1 monoclonal antibodies with sorbitol, sucrose, and trehalose and the impact of these excipients on aggregation and viscosity 57 3.1 Introduction . . . 59
3.2 Methods . . . 60
3.2.1 mAb structure generation . . . 60
3.2.2 Molecular simulations . . . 60
3.2.3 Preferential interaction theory . . . 61
3.2.4 mAb surface analysis . . . 62
3.2.5 Viscosity measurement using cone and plate rheometry . . . . 62
3.3 Results . . . 62
3.3.1 mAb characteristics . . . 62
3.3.2 Preferential exclusion of sorbitol, sucrose, and trehalose calcu-lated from molecular dynamics simulations . . . 64
3.3.3 Mechanisms of carbohydrate excipient interaction with the an-tibody surface . . . 67
3.3.4 Effect of excipient presence on surface-exposed hydrophobicity 68 3.3.5 Effect of excipients on the viscosity . . . 70
3.4 Discussion . . . 71
3.4.1 Impact of antibody surface on Γ23 . . . 71
3.4.2 Effect of carbohydrate excipients on antibody aggregation . . 73
3.4.3 Effect of excipient molecules on antibody viscosity . . . 74
4 Molecular computations of preferential interactions of proline, L-arginine.HCl, and NaCl with IgG1 antibodies and their impact on
aggregation and viscosity 79
4.1 Introduction . . . 81
4.2 Materials and Methods . . . 82
4.2.1 Materials . . . 82
4.2.2 Vapor pressure osmometry . . . 83
4.2.3 Accelerated aggregation kinetics . . . 83
4.2.4 Dynamic light scattering . . . 84
4.2.5 Viscosity measurements . . . 84
4.2.6 Molecular simulations . . . 84
4.2.7 Preferential interaction coefficient calculation from simulation 85 4.2.8 Antibody surface analysis . . . 85
4.3 Results . . . 86
4.3.1 Parameter set development and preferential interactions . . . 86
4.3.2 Broad trends in antibody-excipient interactions . . . 87
4.3.3 Proline . . . 89
4.3.4 Arg.HCl and NaCl . . . 90
4.4 Discussion . . . 91
4.4.1 Parameter set development and preferential interactions . . . 91
4.4.2 Proline . . . 92
4.4.3 Arg.HCl and NaCl . . . 93
4.5 Conclusions . . . 94
5 Machine learning models of antibody-excipient preferential interac-tions for use in computational formulation design 99 5.1 Introduction . . . 101
5.2 Materials & Methods . . . 103
5.2.1 Simulation methods . . . 103
5.2.3 Antibody dataset . . . 105
5.2.4 Machine learning models . . . 106
5.2.5 Viscosity measurements . . . 107
5.3 Results & Discussion . . . 107
5.3.1 Feature vector . . . 107
5.3.2 Antibody dataset . . . 111
5.3.3 Machine learning models . . . 112
5.3.4 Elastic net feature weights . . . 113
5.3.5 Case studies for formulation design . . . 115
5.3.6 Formulation design scheme . . . 120
5.4 Conclusions . . . 121
6 Conclusions and future directions 127 6.1 Summary . . . 127
6.1.1 Insight from MD simulations on how excipients impact mAb stability . . . 128
6.1.2 Computational formulation design process . . . 129
6.2 Future research directions . . . 130
A Supporting information for chapter 2 133 A.1 Simulations Details . . . 134
A.2 Kirkwood-Buff Integral Calculation and Sensitivity . . . 136
A.3 Carbohydrate Clustering . . . 137
A.4 Carbohydrate Diffusion . . . 138
A.5 Pure Carbohydrate Data . . . 139
B Supporting information for chapter 3 143 B.1 Simulations Details . . . 144
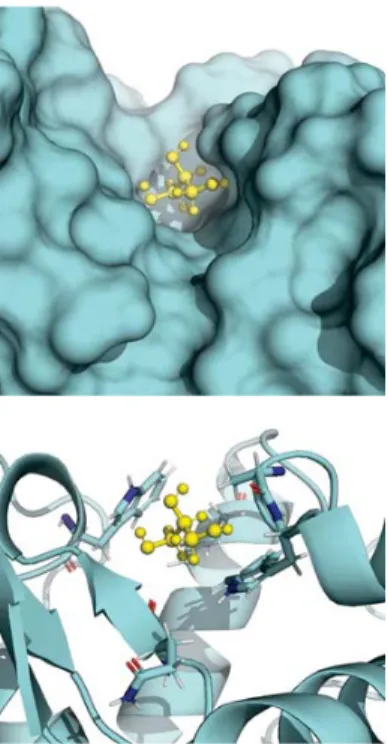
B.2 Visualization of excipient interactions with variable domains . . . 145
C Supporting information for chapter 4 147 C.1 Force field validation . . . 148
C.2 Concentration dependence of aggregation rate . . . 148
D Supporting information for chapter 5 151
D.1 Static vs dynamic average features . . . 152 D.2 mAb dataset information . . . 152
List of Figures
1-1 Antibody development timeline . . . 18
1-2 Schematic of mAb aggregation states . . . 20
1-3 Schematic of mAb high-viscosity behavior . . . 21
1-4 Cartoons of preferential inclusion and exclusion . . . 24
1-5 Molecular dynamics calculations . . . 25
2-1 KBP partial charges . . . 50
2-2 KB integral values for carbohydrates . . . 51
2-3 Density, partial molar volume, and activity coefficient derivatives of carbohydrates . . . 52 2-4 Γ23 with glycerol . . . 52 2-5 Γ23 with sorbitol . . . 53 2-6 Γ23 with glucose . . . 53 2-7 Γ23 with sucrose . . . 53 2-8 Γ23 with trehalose . . . 54
2-9 Local distribution of carbohydrates near lysozyme . . . 54
2-10 Local distribution of carbohydrates near RNase A . . . 55
2-11 Glycerol molecule near lysozyme . . . 56
2-12 Glucose orientation near lysozyme . . . 56
3-1 SAP and SCM of mAb variable regions . . . 64
3-2 Preferential interactions of carbohydrates with mAbs A, B, and C . . 65
3-3 Local concentrations of carbohydrates near mAbB Fv . . . 68
3-5 Carbohydrate interactions with mAbB Fv . . . 70
3-6 Concentrations of excipient near exposed residues . . . 71
3-7 Viscosity of mAbs A, B, and C with carbohydrate excipients . . . 72
3-8 mAbC Fv interactions with carbohydrates . . . 73
4-1 Γ23 of mAbs A, B, and C with proline, Arg.HCl, and NaCl . . . 88
4-2 Aggregation, viscosity, and kD of mAbs A, B, and C with proline, Arg.HCl, and NaCl . . . 89
4-3 Local Γ23 sums for proline, Arg.HCl, and NaCl near the Fv domains . 96 4-4 mAbB Fv interactions with proline . . . 97
4-5 mAbC Fv charge interactions with proline, Arg.HCl, and NaCl . . . . 97
4-6 mAbC Fv interactions with Arg.HCl and NaCl . . . 98
4-7 mAbB interactions with proline, Arg.HCl, and NaCl . . . 98
5-1 Visual comparison of ML models . . . 113
5-2 Elastic net feature weights . . . 122
5-3 Comparison of simulation and SVM results for mAbA Fv . . . 123
5-4 Comparison of simulation and SVM results for mAbC Fv . . . 123
5-5 Comparison of simulation and SVM results for mAbD Fv . . . 124
5-6 mAbD viscosity . . . 124
5-7 Proposed computational formulation design workflow . . . 125
A-1 Trehalose radial distribution functions . . . 136
A-2 Carbohydrate cluster probability . . . 137
A-3 Carbohydrate diffusion coefficients . . . 138
B-1 Local concentrations of carbohydrates near mAb Fv domains . . . 145
C-1 Impact of force field on Γ23 . . . 148
C-2 Impact of force field on local Γ23 mapped onto mAb Fv . . . 149
C-3 Concentration dependence of mAb aggregation . . . 149
List of Tables
2.1 Alcohol Lennard-Jones Parameters for KBPs . . . 40
2.2 Experimental and Simulation Γ23 Concentration Dependence . . . 45
3.1 Charge, SAP, and SCM data for mAbs A, B, and C . . . 63
3.2 Γ23 behavior as a function of excipient molality, 𝑚3. . . 66
3.3 Average carbohydrate excipient molality in Fv . . . 66
4.1 𝜎 (nm) values for proline . . . 87
4.2 𝜀 (kJ/mol) values for Arg.HCl . . . 87
5.1 Feature list . . . 109
5.2 Machine learning hyperparameters . . . 112
5.3 Performance of machine learning models . . . 114
A.1 Simulation list: Kirkwood-Buff integrals . . . 134
A.2 Simulation list: Preferential interaction coefficients . . . 135
A.3 Sensitivity of KB integral values . . . 136
A.4 Cremer and Pople ring pucker parameter, Q, for glucose. . . 139
A.5 Crystal cell volumes . . . 140
A.6 Pure component densities. . . 141
B.1 mAb-carbohydrate simulation list . . . 144
Chapter 1
Introduction
1.1 Biopharmaceuticals are a fast-growing class of
therapeutics
Biopharmaceuticals, including monoclonal antibodies (mAbs), are a rapidly-growing category of pharmaceuticals. The market value of mAbs was about $37 billion in 2019.1 Part of the appeal of mAbs is that, compared to other modalities such as
small molecule drugs, they are often the most rapid way to demonstrate ability to activate or inhibit a target.2 Currently, mAbs have been developed to treat a wide
range of indications, including cancers, asthma, and arthritis.3
However, compared to small molecule drugs, mAbs have relatively high devel-opment and manufacturing costs. Pharmaceutical companies often spend close to a billion dollars and more than 13 years developing a single novel mAb therapy.4
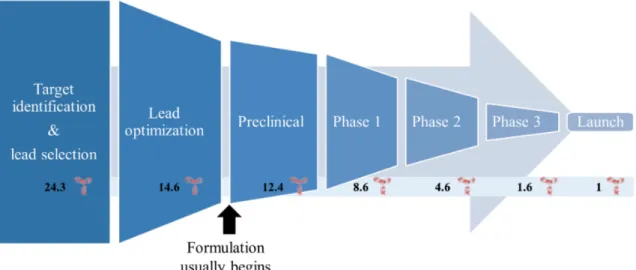
The general process from discovery to launch is shown in figure 1-1.4 In this process,
numerous alternative candidates progress through the development pipeline before ul-timately not succeeding. For example, for each successful mAb therapy, about eleven additional mAbs began preclinical studies, leading to significant financial investment in these other mAbs.4 In order to begin preclinical trials, significant work must be
put into developing a formulation and into developing manufacturing processes for these mAbs. These processes are costly, and this thesis seeks to make the processes
more efficient and less expensive by allowing formulation to be considered early in the lead selection and optimization steps.
Figure 1-1: The general steps in developing a new antibody therapy. Early on, sequences are developed for candidate molecules and optimized for binding and other behaviors. Usually, antibody formulation development only begins to be considered when beginning preclinical studies, and formulations might not be finalized until late clinical studies. For every 24.3 molecules making it out of lead selection, only one makes it to launch.4
1.2 Stability issues in antibodies
Relatively large amounts of mAbs are required for an effective therapeutic dose.5
Delivering a large dose of mAbs requires either an IV infusion of a low concentration mAb solution or a subcutaneous injection of a high concentration mAb solution. IV infusions generally take over 30 minutes and require visiting a clinic, while subcu-taneous injection can easily be done at home. Therefore, subcusubcu-taneous injection is preferred for patient convenience and compliance.5 However, subcutaneous injections
require small dose volumes, usually less than 1.5-2.0 mL, which therefore require high concentrations, often 100-200 mg/ml, of mAbs. High concentration mAb solutions can tend to aggregate and generally have higher viscosities than low concentration solutions.6
Despite significant research on high-concentration mAb formulations, existing for-mulation approaches are largely based on trial and error experimental work.5 Stability
issues that occur in high-concentration mAb formulations include aggregation, viscos-ity, and other chemical degradation such as fragmentation, oxidation, and deamida-tion. Reducing aggregation of mAb formulations is necessary because IgG aggregates can provoke an immune response, harming the patient, and also because the presence of aggregates reduces the effective dose delivered.7–9 Additionally, the FDA
regu-lates the number of aggregates allowed in any drug product. Various possible mAb aggregation pathways are shown in figure 1-2.10
Injecting formulations with high viscosity requires the use of larger needles, which can be painful, and also makes the injection process more difficult due to the force necessary.11 Additionally, high viscosity can interfere with processing steps during
manufacturing.11 Numerous studies have been performed on the factors affecting
in-teractions that lead to high viscosity,12–14and one example schematic of electrostatics
leading to high viscosities is shown in figure 1-3.15 Here, we will focus on aggregation
and viscosity, which are common challenges for high-concentration mAb formulations.
1.3 Existing computational tools for mAb design
Existing computational tools aim to address aggregation and viscosity issues that arise in developing high-concentration mAbs, but no validated tools exist for formulation design.
1.3.1 Aggregation mechanisms and tools
Aggregation is frequently related to hydrophobic-hydrophobic interactions among mAb molecules.16 One tool, termed the spatial aggregation propensity (SAP), was
developed to measure the amount of exposed hydrophobic surface area near each atom. Chennamsetty et al. found that point mutations of high-SAP residues led to reduced aggregation compared to the wild type.16 Several other tools, such as
muta-Figure 1-2: Examples of possible aggregated states of mAbs. The monomer state is desirable and is often in equilibrium with reversibly self-associated dimers or higher order clusters. However, the formation of nuclei leading to insoluble aggregates can reduce the therapeutic efficacy and can provoke an immune response. Figure repro-duced from ref. 10.
tions on structures and compute the change in free energy.17–19 The program Solubis
was developed to identify mutations that would reduce aggregation propensity but maintain conformational stability.20 An alternative approach to reduce aggregation
is termed supercharging. With this approach, point mutations are performed to in-crease the number of charged residues, thus increasing resistance to aggregation and also improving the protein’s ability to penetrate a cell.21,22 Generally, these
compu-tation tools work by modeling the protein structure and performing calculations on the native state and on mutants to assess stability and aggregation propensity. Nu-merous additional tools aimed towards the prediction of relative aggregation rates computationally have been published.23–27
Figure 1-3: High viscosities of mAbs are frequently related to the formation of dipoles. At typical formulation pHs, IgG1s have a positive charge on the Fc domain. If the Fv is negatively charged, mAb molecules can form long-range charge networks leading to high viscosity. Figure reproduced from ref. 15.
1.3.2 Viscosity mechanisms and tools
Similarly, significant work has been put into studying the origins of mAb viscosity and predicting viscosity from sequences or structures.15Despite only minor differences
in sequence between mAbs, mostly confined to the complementarity-determining re-gions (CDRs), mAbs can exhibit very different viscosities, and simulations are fre-quently employed to understand why these differences occur. For example, Chaudhri et al. performed coarse-grained simulations of two IgGs with only minor differences in the CDRs but very different viscosities, and the simulations indicated this was likely due to electrostatic differences.28,29 Numerous approaches have been developed
to identify the residues that might cause a mAb to have high viscosity. Li et al. stud-ied how properties of the variable (Fv) domain of mAbs correlated with viscosity and developed an equation to flag candidate molecules whose development might prove challenging.30Sharma et al. measured the viscosities of about 60 mAbs and attempted
to correlate the experimental behavior with differences in the Fv. Specifically, they identified the charge symmetry parameter between the heavy and light chains in the variable region, the net charge of the Fv, and, to a lesser extent, the hydrophobicity index of the Fv as being important.31 Agrawal et al. developed a spatial charge map
(SCM) tool, which measures exposed negative charge in the Fv domain, and found that mAbs with SCM scores above a certain threshold also tended towards high vis-cosities.32 Tomar et al. attempted to predict the concentration-dependent viscosity
mAb structures. They found that, while no single feature could model the viscosity curves, a combination of features related to the charge and surface areas of the Fv domain could model the viscosities.33 In general, these studies have shown that mAb
viscosity is primarily due to electrostatics, particularly the presence of charge dipoles and the net charge of the molecule, and hydrophobic interactions.
1.3.3 Antibody stability and formulation
A common way to address mAb stability issues such as aggregation or viscosity is by developing an appropriate formulation. The addition of formulation additives, called excipients, frequently impacts the stability. However, the studies previously described generally do not consider the presence of an excipient. This is an important omission, as excipients can have a significant impact on antibody stability in solution. Numerous experimental studies have been performed to understand how proteins behave in the presence of excipients, and there are some broad trends.34–36For example, salts can be
stabilizing or destabilizing based on the Hofmeister series,34while sugars are generally
stabilizers.36 However, not all mAbs behave in the same way in the presence of the
same excipient. For example, the same excipient might reduce the aggregation rate of two mAbs, but one much more so than the other. Additionally, many excipients are typically categorized as being used to reduce aggregation or viscosity, but they frequently have an impact on both properties, and the impact on the second property is often less consistent across mAbs.37
Therefore, selecting excipients for a mAb formulation can be a complicated pro-cess. Some companies use a “platform” formulation approach, in which they develop a single formulation to use for all their mAbs in early development.38 With this
ap-proach, only molecules that do well in the platform formulation make it to phase 1 clinical trials. This allows formulation scientists to focus on molecules already partially through clinical trials, which have a better chance of making it to mar-ket.38 However, this approach potentially eliminates many candidate molecules that
do not perform well in the platform formulation. Others have attempted to develop high-throughput formulation design approaches, which allow for the rapid screening
of potential formulations for a new molecule.6,39–43 Often, these approaches require
predicting the behavior of the mAb at high concentrations based on experimental behavior at low concentration, as very little mAb material is available. Frequently, the correlations are poor, with attempts to rank-order excipients by their ability to reduce aggregation yielding less than 50% predictability.43 Therefore, a better
under-standing of how excipients affect mAb stability and better predictors of how a mAb will behave in the presence of excipient are necessary.
1.4 Preferential interaction theory
Timasheff and colleagues pioneered the study of protein-excipient preferential inter-actions through dialysis and density measurements. Preferential interinter-actions describe how a protein behaves in a mixed solvent system, which includes systems with both excipients and water. A preferential interaction coefficient (Γ23) of zero means that
the presence of the protein has no impact on the distribution of the excipient. Prefer-ential inclusion (Γ23 > 0) means that the concentration of excipient near the protein
surface is higher than in the bulk, while preferential exclusion (Γ23 < 0) means that
the concentration of excipient in the bulk solution is higher than near the protein surface. Example cartoons of preferential inclusion and exclusion are shown in fig-ure 1-4.
Timasheff and colleagues examined the preferential interactions of globular pro-teins with a wide variety of excipients, including polyols, sugars, urea, and amino acids.44–50 They proposed a preferential hydration mechanism leading to
conforma-tional stabilization of the protein native state. Addiconforma-tionally, they demonstrated that preferential binding of excipients such as urea generally led to conformational destabi-lization.50Since then, many studies have been carried out on preferential interactions,
surface hydrophobicity, and stability.51,52
More recently, protein-excipient preferential interactions have been studied via simulation. Baynes and Trout proposed an equation for calculating the preferential interaction coefficient (Γ23) of a protein in a mixed solvent system based on the
Figure 1-4: Preferential inclusion (A) and preferential exclusion (B) of an excipient near a mAb molecule. Excipient molecules are shown in red while water molecules are shown by gray dots. The black dotted line represents the approximate boundary between the local and bulk domains.
positions of each molecule in a molecular dynamics simulation.53 Further work by
Trout and colleagues, as well as by Roberts and colleagues, has studied how a variety of proteins interact locally with a variety of excipients.52,54–59
1.5 Molecular simulations and their use in mAb
mod-eling
Molecular dynamics (MD) simulations allow for the study of mAb behaviors without needing any material. Biological function is based on molecular interactions, which in turn are related to the structure. Structure-based drug design is based on the three-dimensional structures of proteins. These 3D structures can be determined by x-ray crystallography or by modeling techniques such as homology modeling.60
Molecular dynamics simulations work by calculating forces and energies of atoms in different configurations, moving from step to step by integrating Newton’s laws of motion. These approaches were developed to allow the rapid calculation of energies
and forces, as the time step used for integration is often on the order of femtoseconds. Alternative approaches, such as the use of coarse-grained simulations, can allow for simulations over longer timescales, but with a loss of accuracy in modeling smaller motions and particles.60 The cycle of calculations involved in performing a molecular
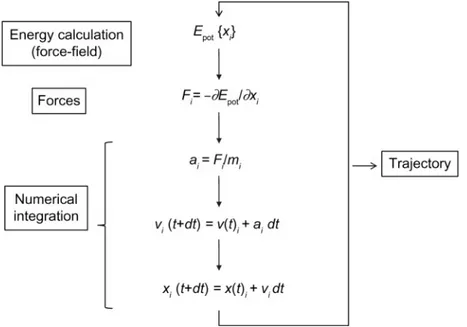
dynamics simulation is shown in figure 1-5.60
Figure 1-5: Molecular dynamics algorithms work by calculating the energy of a par-ticular configuration of atoms, taking the derivative to obtain the current forces, and then numerically integrating the result to obtain the positions at a slightly later time 𝑡 + 𝑑𝑡. Here, 𝐸𝑝𝑜𝑡is the potential energy, which is a function of the atomic coordinates
𝑥𝑖, 𝐹𝑖 is the force, 𝑎𝑖 is the acceleration, 𝑚𝑖 is the mass, and 𝑣𝑖 is the velocity. This
figure is reproduced from ref. 60.
A key part of performing MD simulations is the choice of force field used. Force fields are sets of parameters used to calculate the energies of a configuration of atoms in a simulation. Typically, these force fields use representations designed to speed cal-culations. For example, atomic bonds are generally modeled as springs, the Lennard-Jones equation is used to model van der Waals interactions, and Coulomb’s law is used to model electrostatic interactions.60 Each of these representations requires one
or more fitted parameters, such as the “spring constant” for an atomic bond or the partial charge of an atom for electrostatic calculations. These fitted parameters are generally developed through a combination of quantum calculations and fitting to
experimental data.61,62
Significant effort is put into developing accurate force field parameters. There are several force fields commonly used for protein simulations, including the CHARMM63
and Amber61 force fields. These force fields were developed to be usable in a variety
of simulations, including aqueous protein simulations and membrane simulations. However, numerous other studies have examined how to improve or refine certain force field parameters based on other experimental data. For example, Smith and colleagues pioneered the use of Kirkwood-Buff integral values in developing force fields for small organic molecules,64–67 while Lay et al. focused on optimizing force
fields using osmotic pressure measurements.68Other groups have focused particularly
on developing force fields for certain types of molecules, such as carbohydrates.69–73
Most computational studies of excipient interactions focus on proteins in general, not mAbs in particular.55,74,75 Some studies have examined how molecular docking
might be used to identify how and where excipients interact with a protein, which could lead to informed excipient selection. Barata et al. studied how the excipi-ents arginine and glutamic acid might interact with the Drosophila Su(dx) protein (WW34) using molecular docking, with the expectation that overlapping protein-protein interaction hotspots and protein-protein-excipient interaction hotspots might lead to the disruption of protein-protein interactions leading to aggregation.74 Others
have turned to computational studies in order to understand the mechanisms un-derlying experimental observations. Winter and colleagues identified a novel protein stabilizing dipeptide, glycyl-D-asparagine, and then performed MD simulations in or-der to assess the interaction mechanism between the novel dipeptide and Interferon-alpha-2A.75Shukla and Trout used MD simulations to explain how excipient arginine
molecules, which others had found commonly stabilized proteins, interacted with 𝛼-chymotrypsinogen A and melittin and led to stabilization.55
Relatively few studies focus on excipient stabilization of mAbs. In one recent study, Tilegenova et al. performed MD simulations of antibody fragments to iden-tify residues with strong interactions with excipient arginine molecules. By mutating those residues, they experimentally confirmed that the viscosity of the antibody was
reduced.76 However, this study only examined two antibody molecules and one
ex-cipient molecule. Additionally, the timescales of molecular dynamics simulations are approximately on the order of days to simulate 100 ns of behavior.
1.6 Machine learning approaches for mAb-excipient
interaction prediction
The use of in silico approaches can speed up the discovery and development of can-didate mAbs.77 Machine learning approaches have been used on several antibody
applications. Liberis et al. used a deep-learning architecture to predict antibody-antigen interactions.78 Others have used deep learning to predict protein structure79
and binding sites.80 Recently, several databases of antibody sequences, structures,
and/or experimental data have been released, allowing easier access to data.81
How-ever, most of these approaches focus on antibody structure prediction, binding, and sequence design for better stability, and give little consideration to formulation. As previously noted in section 1.3, antibody behavior is strongly dependent on the for-mulation conditions.
The existing frameworks used in machine learning in proteins generally represent entire proteins numerically, such as by encoding the entire sequence or by representing physical properties of large domains of the protein.82–84. In formulating antibodies,
local surface interactions are important, but the previously developed machine learn-ing tools are not designed to represent small surface patches. This necessitates the development of numeric representations of local regions of the antibody surface.
1.7 Thesis objective: Computational formulation
de-sign framework
The goal of this work was to develop a computational formulation design process for mAbs. It was envisioned that this process would involve starting with an antibody
sequence. Then, a structure could be generated. With this, the surface properties of the mAb could be studied, using insight gained from the many existing in silico tools for understanding how mAb sequences and structures impact stability properties, as described in section 1.3. In addition, this thesis seeks to develop a tool to predict local mAb-excipient interactions, which could then be related to the existing tools used to relate mAb surface properties to stability. These two approaches could be combined to identify which mAb-excipient interactions would promote mAb stability. The computational formulation design process would then identify point mutations needed to address stability issues not already addressed in formulation design. The output from this process would be the optimized sequence for the mAb as well as the formulation excipients recommended for this mAb. This process would need to be rapid, on the order of hours rather than weeks, to prove useful in early stage discovery and development.
The benefits to this process are anticipated to be a significant reduction in the number of experiments required in early stage formulation design, which would also reduce the cost of formulation design. In addition, considering formulation when developing new molecules avoids issues later on in development, in case formulation issues arise after a mAb sequence is mostly fixed. This approach also avoids the need for platform formulations, which might prevent the development of mAbs that are unstable in the particular platform formulation used in a company.
1.8 Thesis overview
This thesis is organized into six chapters:
1. Chapter 1 emphasizes the need for more efficient formulation design approaches for mAbs and discusses existing research in this area.
2. Chapter 2 presents an example of force field development work, emphasizing the need to validate any force fields used in simulations and describing a framework for validating force fields using Kirkwood-Buff integral values and preferential
interaction coefficients.
3. Chapter 3 presents case studies of the aggregation and viscosity behaviors of three different antibodies in the presence of certain carbohydrate excipients and an investigation into the molecular mechanisms underlying these behaviors. 4. Chapter 4 presents case studies of the aggregation and viscosity behaviors of the
same three antibodies in the presence of the excipients proline, arginine.HCl, and NaCl and discusses the molecular interactions leading to these behaviors. 5. Chapter 5 presents a machine learning model for local antibody-excipient
in-teractions, which allows for the rapid calculation of these properties. It gives several examples of how this tool might be used in development and validates the approach on the viscosity behavior of a new antibody.
6. Chapter 6 summarizes the main results of this thesis and potential future di-rections for this work.
Chapter 2
Kirkwood-Buff Derived Alcohol
Parameters for Aqueous
Carbohydrates and their Application
to Preferential Interaction Coefficient
Calculations of Proteins
Abstract
The CHARMM36 carbohydrate parameter set did not adequately reproduce exper-imental thermodynamic data of carbohydrate interactions with water or proteins or carbohydrate self-association; thus a new nonbonded parameter set for carbohydrates was developed. The parameters were developed to reproduce experimental Kirkwood-Buff integral values, defined by the Kirkwood-Kirkwood-Buff theory of solutions, and applied to simulations of glycerol, sorbitol, glucose, sucrose, and trehalose. Compared to the CHARMM36 carbohydrate parameters, these new Kirkwood-Buff based parameters reproduced accurately carbohydrate self-association and the trend of activity coeffi-cient derivative changes with concentration. When using these parameters, prefer-ential interaction coefficients calculated from simulations of these carbohydrates and the proteins lysozyme, bovine serum albumin, 𝛼-chymotrypsinogen A, and RNase A agreed well with experimental data, while use of the CHARMM36 parameters indi-cated preferential inclusion of the carbohydrates, in disagreement with experiment. Thus, calculating preferential interaction coefficients from simulations requires using a force field that accurately reproduces trends in the thermodynamic properties of binary excipient-water solutions, and in particular the trend in the activity coefficient derivative. Finally, the carbohydrate-protein simulations using the new parameters indicated that the carbohydrate size was a major factor in the distribution of different carbohydrates around a protein surface.
Parts of this chapter have been adapted or reprinted from:
Cloutier, T., Sudrik, C., Sathish, H. A.,& Trout, B. L. (2018). Kirkwood-Buff-Derived Alcohol Parameters for Aqueous Carbohydrates and Their Application to Preferential Interaction Coefficient Calculations of Proteins. J. Phys. Chem. B, 122(40), 9350–9360. https://doi.org/10.1021/acs.jpcb.8b07623
2.1 Introduction
Carbohydrates are an important class of molecules that interact with proteins, and they are generally considered to be kosmotropes and thus excluded from protein surfaces46,48. It would be advantageous to understand on the molecular level how
they interact, but experimental methods can provide limited molecular-level informa-tion. On the other hand, molecular dynamics simulations can be used to examine the molecular-level interactions of excipients with proteins and also lead to insight into the mechanism of action of a carbohydrate with a protein54. The selection of
an appropriate force field is critical for simulating any given system, and one mea-sure of accuracy is the reproduction of solute-solute, solute-water, and water-water interactions. The CHARMM36 force field85–87 contains parameters for proteins,
car-bohydrates, and water.
Previous simulations of trehalose performed by Sapir and Harries found that too much self-association of trehalose occurred in simulations using the CHARMM35 force field compared with experiment88, and we show here that the CHARMM36 force field
has a similar issue. Additionally, we tested several precursors to the CHARMM36 force field, including that developed by John Brady’s group73 and the CSFF72, both
of which, like the CHARMM36 force field, showed preferential inclusion of carbohy-drates around proteins at low (1 m) carbohydrate concentrations, whereas experiment indicates preferential exclusion. A previous study of urea by Weerasinghe and Smith found that preferential interaction coefficient calculations from simulations required the force field to predict accurately excipient self-association89. Thus, we desired a
force field that would predict accurately carbohydrate self-association for the study of preferential interactions.
In developing the CHARMM36 force field, the partial charges and Lennard-Jones parameters were determined by comparing simulation results to experimental data, with the general approach described by Yin and MacKerell62 and the specifics for
carbohydrates described by Guvench et al.86 The choice of experimental target data
carbohydrate force fields have been developed that each emphasize different experi-mental data69. Paul Smith’s group developed a force field parameterization procedure
using Kirkwood-Buff (KB) integral values as the target experimental data64–67. This
approach emphasizes the correct balance of solute-solute, solute-water, and water-water interactions by using the KB integral values as the target experimental data. These values can be obtained from simulations from radial distribution functions66or
from experiment from the activity coefficient derivatives, isothermal compressibility, and partial molar volumes90.
We used this KB approach for parameter determination to develop new nonbonded parameters for carbohydrates, performing simulations of aqueous glycerol, sorbitol, glucose, sucrose, and trehalose and comparing the results with experimental data. The final parameter set, termed the KB based carbohydrate parameters (KBPs), re-produces KB integral values more accurately than the CHARMM36 parameters. The new parameters are compatible with the CHARMM36 force field and TIP3P water model, which are extensively used in protein simulations. We then used this set of KBPs to calculate preferential interaction coefficients for the five carbohydrates with several small proteins (lysozyme, bovine serum albumin, 𝛼-chymotrypsinogen A, and ribonuclease A), with good agreement with experiment, and then examined the distri-bution of the carbohydrates around the protein. We expect that these parameters can be used in the study of preferential interactions of carbohydrates with other proteins to gain insight into the mechanism of action with proteins.
2.2 Methodology
2.2.1 Molecular Dynamics Simulations
Molecular dynamics simulations were performed using Gromacs 5.0.591 with
param-eters taken from the CHARMM36 force field85,86,92 or with our KBPs for
carbohy-drates. The TIP3P93 model for water was used. Hydrogen bonds were constrained
interactions, with neighbor list and VdW cutoff distances of 12 Å and forces smoothly switched to zero between 10 and 12 Å. Long range electrostatics were calculated using the particle-mesh Ewald method with a 12 Å cutoff distance.
The structures of 𝛼-chymotrypsinogen A (𝛼-Cgn A, PDB code: 2cga), bovine serum albumin (BSA, PDB code: 4f5s), hen egg white lysozyme (PDB code: 1e81), and ribonuclease A (RNase A, PDB code: 1kf5) were obtained from the Protein Data Bank.95
Simulations were performed in rectangular boxes using periodic boundary con-ditions, and a list of simulation configurations is given in appendix A. Simulations containing a protein were set up with water extending a minimum of 14 Å beyond the protein and with a minimum side length of 75 Å, while simulations without proteins were performed in boxes with side lengths of at least 64 Å. The initial configura-tions were generated using Packmol96. The pH of the simulations was set by setting
the protonation state of any amino acids present using PropKa97. Simulations of
lysozyme and BSA were performed at pH 6, except for the simulation of lysozyme and trehalose, which was performed at pH 5.5. Simulations of RNase A with sorbitol were performed at pH 2, with sucrose at pH 3, and with trehalose at pH 5.5. Simula-tions of 𝛼-Cgn A with glucose were performed at pH 3.5 and with sucrose at pH 3. All systems were made charge neutral by the addition of sodium or chloride counterions, if necessary. The temperature of each simulation was set to 298 K using the V-rescale algorithm and the pressure was set to 1 atm using the Parrinello-Rahman algorithm. Simulations were first energy minimized and then equilibrated for 15 ns. Con-figurations were saved every 10 ps. Following equilibration, the simulations used to calculate KB integral values were run for a minimum of 85 ns, and the simulations used to calculate preferential interactions were run for a minimum of 55 ns. Statisti-cal error Statisti-calculations were performed using the method of Allen and Tildesley.98 All
2.2.2 Kirkwood-Buff Theory
Kirkwood-Buff theory can be used to relate the KB integrals to thermodynamic prop-erties of a solution.66,90,101 Briefly, the KB integrals for a binary solution can be
calculated from simulations according to66
𝐺𝑖𝑗 = 4𝜋
∫︁ ∞
0
(︁
𝑔𝑁 𝑝𝑇𝑖𝑗 (𝑟) − 1)︁𝑟2𝑑𝑟 (2.1)
where 𝐺𝑖𝑗 is the KB integral value for components 𝑖 and 𝑗, 𝑔𝑁 𝑝𝑇𝑖𝑗 is the radial
distri-bution function in the NpT ensemble, and 𝑟 is the distance between the centers of masses of the two components. The simulation box was made large enough that the radial distribution function approached 1 past some distance 𝑅, allowing the integral to be evaluated from 0 to 𝑅.
The subscript 1 will be used to refer to water, 2 to protein, and 3 to excipient for all following equations.
The KB integrals were related to the excipient partial molar volume, ¯𝑉3, the
isothermal compressibility, 𝜅𝑇, and the activity coefficient derivative, 𝑓33, according
to66,90 ¯ 𝑉3 = 1 + 𝜌1(𝐺11− 𝐺31) 𝜌1+ 𝜌3+ 𝜌1𝜌3(𝐺11+ 𝐺33− 2𝐺31) (2.2) 𝜅𝑇 = 1 𝑅𝑇 1 + 𝜌1𝐺11+ 𝜌3𝐺33+ 𝜌1𝜌3(𝐺11𝐺33− 𝐺231) 𝜌1+ 𝜌3+ 𝜌1𝜌3(𝐺11+ 𝐺33− 2𝐺31) (2.3) 𝑓33 = (︂ 𝜕 ln 𝑓3 𝜕 ln 𝑥3 )︂ 𝑝,𝑇 = − 𝜌1𝑥3(𝐺11+ 𝐺33− 2𝐺31) 1 + 𝜌1𝑥3(𝐺11+ 𝐺33− 2𝐺31) (2.4) where 𝜌𝑖is the molar density, 𝑅 is the gas constant, 𝑓𝑖is the mole fraction scale activity
coefficient, and 𝑥𝑖 is the mole fraction. Values were determined by the ensemble
average over the trajectory following equilibration.
2.2.3 Clustering
Carbohydrate molecules were defined as being in a cluster if they had at least one connecting hydrogen bond, where hydrogen bonds were defined as occurring between
an alcohol O and an alcohol H if the donor and acceptor were within 3 Å and the angle between the donor, the hydrogen, and the acceptor heavy atom was greater than 150∘. Clusters were identified at each saved trajectory configuration, and cluster size
distributions and probabilities were determined by averaging over the course of the trajectory following equilibration.
2.2.4 Preferential Interaction Theory
The preferential interaction coefficient (Γ23), which is a measure of the relative
con-centrations of excipients in the local domain of the protein as compared to the bulk, was calculated from simulations according to53,54
Γ23(𝑟, 𝑡) = 𝑛3(𝑟, 𝑡) − 𝑛1(𝑟, 𝑡)
(︂ 𝑛3− 𝑛3(𝑟, 𝑡)
𝑛1− 𝑛1(𝑟, 𝑡)
)︂
(2.5) where 𝑛𝑖(𝑟, 𝑡) refers to the number of molecules of type 𝑖 within a distance 𝑟 of the
protein surface at time 𝑡 and 𝑛𝑖 refers to the total number of molecules of type 𝑖 in
the simulation. The simulation average of Γ23(𝑟, 𝑡) was used for analysis.
Past some distance 𝑅, Γ23(𝑟) converges to a constant value, and the value of 𝑅 is
often about 8 Å. The Γ23(𝑅)values, referred to as Γ23, were compared to experimental
data.
2.2.5 Experimental determination of Γ
23The Γ23 values of trehalose with lysozyme were obtained experimentally. Briefly, a
protein stock solution was prepared by dissolving lyophilized lysozyme from chicken egg white (Sigma catalog #L6876) in an aqueous buffer of 25 mM histidine.HCl (pH 5.5), followed by dialysis with three buffer exchanges against 25 mM histidine.HCl (pH 5.5) to remove impurities from the lyophilized powder. The final concentration of lysozyme in the dialyzed solution was ascertained to be about 75 mg/mL. Trehalose (Sigma catalog #T9449) was dissolved in 25 mM histidine.HCl (pH 5.5) buffer to obtain 10 stock solutions with concentrations in the range of roughly 0 to 1 molal. These stock solutions were then diluted roughly 2-fold, with either buffer alone to
obtain a binary series of solutions, or with the protein stock to obtain a ternary series of solutions. All solutions were prepared gravimetrically to obtain a more precise estimate of the concentration of trehalose. Next, a Wescor VAPRO 5600 vapor pressure osmometer was used to determine the osmolality of each solution at room temperature. Osmolality data for each solution were collected at least in triplicate to minimize experimental error in the estimation of preferential interaction. Using the osmolality data for the binary and ternary solutions, Γ23 for lysozyme with trehalose
was estimated for trehalose concentrations in the range of roughly 0 to 0.5 molal, according to the procedure described in Hong et al.102
2.3 Results and Discussion
2.3.1 Parameter Determination
For the purposes of studying preferential interactions of carbohydrates with proteins, it is necessary for the force field parameters to reproduce accurately the experimen-tal properties of carbohydrates in aqueous solutions at the concentrations used in protein formulations. The CHARMM36 carbohydrate parameters86,87,92 were used
as a starting point for parameter determination. The experimental target data used in the development of the CHARMM36 parameters included experimental heats of vaporization and molecular volumes of neat liquids. Guvench et al. noted that the CHARMM36 parameters greatly overpredict intermolecular hydrogen bonding for glycerol86. Thus, the CHARMM36 parameters, developed using target experimental
data that includes pure carbohydrates, do not model aqueous carbohydrate solutions with sufficient accuracy for the calculation of preferential interactions at the relatively low concentrations relevant for formulations. Therefore, we adjusted the carbohydrate parameters to reproduce experimental KB integral values for aqueous carbohydrate solutions of up to 2 m.
The KB integral values were calculated from the radial distribution functions of carbohydrates and water according to equation 2.1, treating each molecule as a point
at its center of mass. Figure A-1 in appendix A shows the radial distribution functions 𝑔𝑖𝑗(𝑟) and KB integral values 𝐺𝑖𝑗(𝑟) for 1 m trehalose using the KBPs, which were
calculated from the radial distribution functions using equation 2.1. The 𝐺𝑖𝑗 values
compared to experiment were obtained by averaging 𝐺𝑖𝑗(𝑟) past 2 nm.
In our development of the KBPs, we only considered changes to the nonbonded parameters: the atomic partial charges and the Lennard-Jones parameters 𝜀 and 𝜎. Direct scaling of the partial charges for carbohydrate molecules did not produce agree-ment with KB integral values. Instead, to address the overprediction of carbohydrate self-association by the CHARMM36 force field, we reduced the magnitude of the al-cohol partial charges, as the alal-cohol groups drive intermolecular interactions. In the CHARMM36 force field, the partial charge of alcohol O is -0.65 and H is 0.42, while the KBPs have an alcohol O partial charge of -0.50 and an H charge of 0.18. In order to maintain a net charge of zero, carbon partial charges were slightly increased. The partial charges of the KBPs for glycerol, sorbitol, glucose, sucrose, and trehalose are shown in figure 2-1. Note that partial charges of the same types of carbon atoms were maintained across molecules. For example, the partial charges of carbons in trehalose are the same as those of corresponding carbons in glucose, except for C1, due to the
1,1-glycosidic bond in trehalose.
The Lennard-Jones parameters for the alcohol KBPs are shown in table 2.1. The 𝜎 parameters are identical to the CHARMM36 values. The KBPs define two 𝜀 val-ues for each atom, one for non-water interactions (general) and one specifically for water interactions, with the water-specific 𝜀 added by specifying NBFIX terms. The CHARMM36 𝜀 value for alcohol O is 0.804 kJ/mol and for alcohol H is 0.192 kJ/mol, and there is no separate value for water interactions. Generally, the KBPs made self-interactions less energetically favorable and carbohydrate-water self-interactions more en-ergetically favorable. The CHARMM36 𝜀 value for TIP3P water O is 0.636 kJ/mol, lower than that of alcohol oxygens, making alcohol self-interactions energetically more favorable than water interactions and contributing to the overprediction of 𝐺33 and
underprediction of 𝐺31 values observed with the CHARMM36 force field.
Table 2.1: Alcohol Lennard-Jones Parameters for KBPs atom interaction 𝜀 (kJ/mol) 𝜎 (nm)
O generalwater 0.4500.900 0.314 H generalwater 0.1200.300 0.040
to achieve the appropriate balance of carbohydrate and carbohydrate-water interactions. Alcohol-carbohydrate-water interactions were made more favorable by using NBFIX terms to define higher 𝜀 values for alcohol interactions with water. Four NBFIX terms were defined, one for each combination of the two alcohol atoms and the two types water atoms. In each NBFIX term, the overall 𝜀 value was the geomet-ric mean of the individual atom 𝜀 values (for water atoms, the value directly from the CHARMM force field, and for the alcohol atoms, the value given for water interac-tions in table 2.1) and the overall 𝜎 value was the arithmetic mean of the individual atom 𝜎 values. Changes to 𝜎 had a noticeable impact on the KB integral values, in particular with increases in 𝜎 reducing 𝐺33 values, but the adjusted parameter set
used the same 𝜎 values as the CHARMM36 force field due to the appropriate choice of partial charge and 𝜀 values.
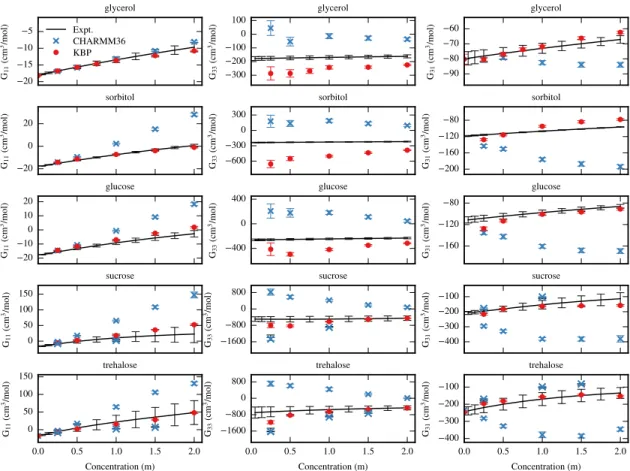
The KB integral values for the carbohydrates with the CHARMM36 parameters and the KBPs are shown in figure 2-2, with each column showing plots of 𝐺11, 𝐺33,
or 𝐺31 and each row showing results for one carbohydrate. These KB integral values
were compared to experimental KB values calculated from experimental data using equations 2.2-2.4.
The CHARMM36 parameters tended to overestimate 𝐺11 and 𝐺33 and
under-estimate 𝐺31 for all five carbohydrates, as shown in figure 2-2. Interestingly, the
CHARMM36 parameters often demonstrated the wrong trends for 𝐺33and 𝐺31,
indi-cating a decrease in self-association of carbohydrates with increasing concentration, which is opposite of the experimental trends. Additionally, the 𝐺33 values using the
CHARMM36 parameters were consistently greater than the experimental values, in-dicating excessive self-association compared with experiment. This observation is in
agreement with the findings of Guvench et al. with glycerol86 and Sapir and Harries
with trehalose88. The CHARMM36 parameters also consistently overpredicted 𝐺 11
values, which is related to the overprediction of 𝐺33 and underprediction of 𝐺31
val-ues. Excessive carbohydrate self-association reduces carbohydrate-water interactions and thus increases water-water interactions.
For all five carbohydrates, the KBPs showed better agreement with experimental data for all three KB integral values compared to the CHARMM36 parameters, and in particular matched the experimental trends of increasing 𝐺33 and increasing 𝐺31
with increasing carbohydrate concentration. The KBPs showed very good agreement with the experimental results for 𝐺11 and 𝐺31 for all five carbohydrates. The KBPs
showed good agreement with experimental 𝐺33 values for sucrose and trehalose, and
even though the KBPs slightly underestimated the magnitude of 𝐺33for glycerol,
sor-bitol, and glucose, the results followed the experimental trend of increasing 𝐺33 with
increasing carbohydrate concentration. In all cases, the results using the KBPs were closer to the experimental result than the results using the CHARMM36 parameters, indicating that the KBPs represent a significant improvement over the CHARMM36 parameters in modeling aqueous behavior of these carbohydrates.
Recalling that the KBPs were developed using experimental KB integral values for glycerol and trehalose, the ability of the new parameter set to generalize to other carbohydrate molecules was tested by evaluating the performance of the KBPs on sorbitol, glucose, and sucrose. The good agreement with experimental trends observed for these other carbohydrates, as shown in figure 2-2, indicated that the KBPs can be successfully applied to other carbohydrates.
The density, partial molar volume, and activity coefficient derivative data for the carbohydrates are shown in figure 2-3. Figure 2-3 indicates that both parameter sets predicted almost identical densities, which matched well with experimental data. Ex-cept for sorbitol, the experimental partial molar volume data matched reasonably well with the results using the CHARMM36 parameters. The ¯𝑉3 values from simulations
using the KBPs tended to be higher than the experimental results, and, for sorbitol, glucose, and sucrose, were further from the experimental result than the values using
the CHARMM36 parameters. Despite this, the results with the KBPs exhibited the proper trend for all five carbohydrates, showing small increases in ¯𝑉3 with increasing
carbohydrate concentration. This indicated that the KBPs, like the CHARMM36 parameters, appropriately modeled the changes in partial molar volume with con-centration. Additionally, despite the general overprediction of the magnitudes of the partial molar volumes by the KBPs, the relative partial molar volumes were rea-sonably accurate. For example, both the experimental results and the KBP results indicated that sorbitol has a higher partial molar volume than glucose.
The largest differences between the two parameter sets was seen in the activity co-efficient derivative results. For all five carbohydrates at concentrations below 2 m, the experimental results indicated that 𝑓33increased slightly with increasing carbohydrate
concentration, indicating increases in the activity coefficient. The CHARMM36 pa-rameters predicted negative 𝑓33 values, which correspond to decreases in the activity
coefficient with increasing concentration. The KBPs better matched the experimental 𝑓33 results, as they result in positive 𝑓33 values at all concentrations considered here,
which agrees with experimental data. The best agreement with experiment was ob-served with sucrose and trehalose. However, even for glycerol, sorbitol, and glucose, the proper trend of increasing 𝑓33 with increasing carbohydrate concentration was
observed, despite the magnitudes being slightly higher than experiment. This repre-sents a significant improvement over the CHARMM36 parameters and is particularly important for force fields used in calculating preferential interactions. Weerasinghe and Smith found that reproducing urea activity trends was necessary for modeling the preferential exclusion of urea from cavities89.
Additionally, it is possible that other parameter sets not considered here would yield similar KB integral values. The sensitivity of the KB integral values for glycerol to changes in the nonbonded parameters is examined in appendix A. Alternatively, an approach involving using different Lennard-Jones mixing rules might also improve agreement with the KB integral values without modifying the parameters.
Finally, the KBPs were developed specifically to model these carbohydrates in aqueous solution at concentrations below 2 m. Their ability to reproduce KB
in-tegral values at higher concentrations was not examined. However, for use in com-paring these force field parameters to others, some properties of pure carbohydrate systems were calculated, with the results in appendix A. Briefly, compared to the CHARMM36 parameters, the KBPs are slightly less accurate in modeling the Cremer and Pople ring pucker parameter, Q,114 for glucose. The experimental crystal unit
cell volumes were generally better reproduced by the KBPs than the CHARMM36 parameters, although results for sucrose were much higher than experiment with both force fields. Pure component densities were generally lower than experiment when using either parameter set. However, for glucose, sucrose, and trehalose, results with the KBPs were slightly closer to the experimental result than results with the CHARMM36 parameters.
2.3.2 Clustering
Some carbohydrate self-association, or clustering, was observed through alcohol hy-drogen bonding interactions for all five types of carbohydrates with either force field. In general, more extensive clustering was observed using the CHARMM36 parame-ters as compared to the KBPs. In simulations using the KBPs, monomers accounted for approximately 15% more of the total clustered units compared to simulations using the CHARMM36 parameters. Additionally, the probability of finding a partic-ular carbohydrate molecule in a monomer was higher with the KBPs, as shown in figure A-2 for 1 m sucrose and 1 m sorbitol.
Experimentally, self-association of monosaccharides and disaccharides in solution is observed115,116, and this is reproduced by the simulation results with the KBPs.
Simulations of 1 m carbohydrate with the KBPs indicate that glycerol molecules spend about 6-8% of the simulation time hydrogen bound to other glycerol molecules, while sorbitol and glucose molecules spend 15-20% of the time hydrogen bound to other solute molecules, and sucrose and trehalose spend 30-35% of the time hydrogen bound to other solute molecules. The self-association of the carbohydrate molecules affects their distribution throughout the simulation and thus affects the preferential interaction coefficient in simulations containing a protein.
2.3.3 Preferential Interaction Coefficients
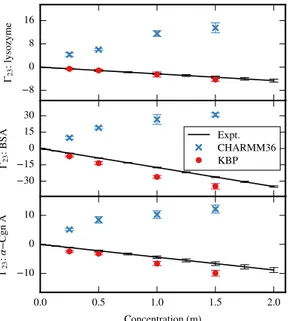
The Γ23 results with the KBPs showed excellent agreement with experimental results
for preferential interactions of the carbohydrates with small proteins at a variety of pHs. The small proteins used for this validation were lysozyme, BSA, 𝛼-Cgn A, and RNase A, chosen due to the availability of literature preferential interaction data with these carbohydrates. The preferential interaction coefficients were calculated from simulations using equation 2.5. The results with the CHARMM36 parameters showed an increasing Γ23value with increasing carbohydrate concentration for concentrations
below 2 m for all combinations of carbohydrates and proteins examined, while the experimental results indicated that all carbohydrates were linearly excluded from all protein surfaces.
The Γ23values for glycerol with lysozyme and BSA at pH 6 are shown in figure 2-4.
The results using the KBPs slightly overestimated the Γ23 value with lysozyme and
slightly underestimated the values with BSA compared to the experimental results117.
The Γ23 values for sorbitol with RNase A at pH 2 are shown in figure 2-5. The results
with the KBPs almost exactly matched the experimental data44.
The Γ23 values for glucose with lysozyme (pH 6), BSA (pH 6), and 𝛼-Cgn A (pH
3.5) are shown in figure 2-6. Good agreement with experimental results117was
demon-strated for the KBPs for all three proteins, although the Γ23 values with BSA were
slightly lower than experiment. Glucose was the only single-ringed sugar included in this study. The Γ23 values for sucrose with 𝛼-Cgn A and RNase A (pH 3) are shown
in figure 2-7, with excellent agreement with experimental results48. The results for
trehalose with lysozyme (pH 5.5) and RNase A (pH 5.5) are shown in figure 2-8, and again the results with the KBPs almost exactly matched the experimental results45.
It can be clearly seen from the results of all carbohydrate and protein combinations that the simulations with the KBPs predicted a linear decrease in Γ23 with
increas-ing concentration, agreeincreas-ing with the experimental trend, whereas the CHARMM36 parameter set resulted in the wrong trend. The better agreement of the KBPs with experiment compared to CHARMM36 was likely due to the better agreement with
𝑓33values, since figure 2-3 shows that the major difference between the CHARMM36
parameter results and the KBP results was that the experimental trend in 𝑓33 was
better modeled using the KBPs. This agrees with a previous study of urea89.
Table 2.2 compares the Γ23 values determined from experiment and from
simula-tion with the KBPs for the small proteins. For BSA, both simulasimula-tion and experiment agree that glucose is more excluded than glycerol, although the Γ23 values are not
identical. The Γ23 values for lysozyme and RNase A are much closer in magnitude,
with the experimental data indicating that the Γ23 values at 1 m carbohydrate are
within 2 units, which is approaching the sensitivity of the simulations. Because the Γ23values are so close for all the excipients with lysozyme and with RNase A, the
sim-ulations results do not differentiate well between the exclusion of the carbohydrates with these two proteins.
Table 2.2: Experimental and Simulation Γ23 Concentration Dependence
Γ23a
Carbohydrate Experiment Simulation
Lysozyme Glycerol (−5.6 ± 0.5)𝑚3b (−2.0 ± 0.5)𝑚3 Glucose (−4.4 ± 0.4)𝑚3b (−2.7 ± 1.0)𝑚3 Trehalose (−3.7 ± 0.4)𝑚3c (−2.7 ± 0.9)𝑚3 BSA Glycerol (−12.4 ± 0.5)𝑚3b (−20.4 ± 2.0)𝑚3 Glucose (−17.5 ± 0.4)𝑚3b (−24.4 ± 1.5)𝑚3 𝛼-Cgn A Glucose (−4.4 ± 0.4)𝑚3b (−6.6 ± 0.7)𝑚3 Sucrose (−7.5 ± 0.4)𝑚3d (−6.7 ± 1.0)𝑚3 RNase A Sorbitol (−6.0 ± 0.5)𝑚3e (−5.1 ± 0.8)𝑚3 Sucrose (−6.2 ± 0.8)𝑚3d (−6.4 ± 1.0)𝑚3 Trehalose (−6.2 ± 0.4)𝑚3f (−6.5 ± 0.8)𝑚3 a 𝑚
3 represents the molal concentration of excipient.
b Experimental data for glycerol and glucose from ref 117. c Experimental data
gathered according to methods section. d Experimental data for sucrose calculated
from data in ref48. e Experimental data calculated from data in ref 44. f Experimental data calculated from data in ref 45.
2.3.4 Carbohydrate-Protein Interactions with the KBPs
Experimentally, Timasheff found that the native state of proteins is often stabilized by many types of carbohydrates, which are excluded from the protein surface and raise the chemical potential of the protein, making unfolded forms less favorable45,46.
The simulations with the KBPs capture this overall exclusion and allow the exclusion of the carbohydrate molecules from different regions of the protein surface to be examined for insight into carbohydrate-protein interactions.
Local interactions of carbohydrates with the protein surface
Trends in the interaction of carbohydrates with lysozyme and RNase A were examined more closely. In general, very similar distribution patterns were observed for all carbohydrates with the same protein, as shown in figures 2-9-2-10. However, the magnitude of the interaction was dependent on the size of the carbohydrate molecule, with fewer carbohydrates within 5 Å for larger carbohydrates.
It is interesting that similar distributions of carbohydrates over the protein surface are observed for different carbohydrate molecules. In particular, trehalose was found in several cases to be a better protein stabilizer than other sugars tested118, but the
simulations showed that it does not distribute itself very differently around the protein surface compared to the other carbohydrates. However, the simulations showed that there are fewer trehalose molecules within 5 Å of residues on the protein surfaces, which is attributable to the larger size of trehalose compared to that of the polyols or glucose. Sola-Penna and Meyer-Fernandes concluded that the larger hydrated volume of trehalose compared to that of other sugars was responsible for its effectiveness and found that, when sugar concentrations were corrected by the percentage of the occupied volume, trehalose was no more effective than sucrose, maltose, glucose, and fructose at stabilizing macromolecules118. This agrees with the simulation results
that the differences in interaction of the carbohydrates with the protein surface are primarily due to the carbohydrate size.