See discussions, stats, and author profiles for this publication at: https://www.researchgate.net/publication/323559098
Aspergillus section Flavi and aflatoxins in dried figs and nuts in Algeria Article in Food Additives and Contaminants Part B · March 2018
DOI: 10.1080/19393210.2018.1438524 CITATIONS 6 READS 448 7 authors, including:
Some of the authors of this publication are also working on these related projects:
Development and evaluation of different analytical methods for 5-nitroimidazole determinationView project
ActinomycetesView project Natalia Arroyo-Manzanares University of Murcia 73PUBLICATIONS 832CITATIONS SEE PROFILE Ana M. García-Campaña University of Granada 239PUBLICATIONS 5,465CITATIONS SEE PROFILE Karima Bouti
École Normale Supérieure de Kouba
9PUBLICATIONS 97CITATIONS
SEE PROFILE
Amar Riba
University M'Hamed Bougara of Boumerdes
18PUBLICATIONS 289CITATIONS
SEE PROFILE
All content following this page was uploaded by Amar Riba on 05 March 2018.
Full Terms & Conditions of access and use can be found at
http://www.tandfonline.com/action/journalInformation?journalCode=tfab20
Food Additives & Contaminants: Part B
Surveillance
ISSN: 1939-3210 (Print) 1939-3229 (Online) Journal homepage: http://www.tandfonline.com/loi/tfab20
Aspergillus section Flavi and aflatoxins in dried figs
and nuts in Algeria
Nouara Ait Mimoune, Natalia Arroyo-Manzanares, Laura Gámiz-Gracia, Ana M. García-Campaña, Karima Bouti, Nasserdine Sabaou & Amar Riba
To cite this article: Nouara Ait Mimoune, Natalia Arroyo-Manzanares, Laura Gámiz-Gracia, Ana M. García-Campaña, Karima Bouti, Nasserdine Sabaou & Amar Riba (2018): Aspergillus section Flavi and aflatoxins in dried figs and nuts in Algeria, Food Additives & Contaminants: Part B, DOI: 10.1080/19393210.2018.1438524
To link to this article: https://doi.org/10.1080/19393210.2018.1438524
Accepted author version posted online: 05 Mar 2018.
Submit your article to this journal
View related articles
Publisher: Taylor & Francis
Journal: Food Additives & Contaminants: Part B DOI: 10.1080/19393210.2018.1438524
Aspergillus section Flavi and aflatoxins in dried figs and nuts in
Algeria
Nouara Ait Mimoune
1*, Natalia Arroyo-Manzanares
2, Laura
Gámiz-Gracia
2, Ana M. García-Campaña
2, Karima Bouti
1, Nasserdine Sabaou
1,
Amar Riba
11
Laboratoire de Biologie des Systèmes Microbiens, Ecole Normale Supérieure de Kouba, Algiers, Algeria
2
Department of Analytical Chemistry, Faculty of Sciences, University of Granada, Campus Fuentenueva s/n, E-18071 Granada, Spain
*
Corresponding author: Nouara Ait Mimoune
E-mail : [email protected]
Abstract
The presence of Aspergillus section Flavi and aflatoxin (AF) contamination was
investigated in 112 samples of peanuts, almonds and dried figs collected in Algeria. The occurrence of aflatoxin B1 (AFB1), B2 (AFB2), G1 (AFG1) and G2 (AFG2) in different commodities has been determined with a sensitive method based on high performance liquid chromatography (HPLC) coupled with fluorescence detection with post-column photochemical derivatization. Analytical results indicated that 28 samples of peanuts, 16 samples of almonds and 26 samples of dried figs contained detectable levels of AFS. A
total of 69 samples (61.6%) were contaminated with AFB1 ranging from the limit of quantification to 174 μg kg-1. AFB2 was found in 12 samples (10.7%) and varied from
0.18 to 193 μg kg-1. Seven samples revealed AFconcentrations lower than the limit of quantification. Eleven peanut and fourteen dried fig samples exceeded the European maximum limits for AFB1.
Keywords: Aspergillus; aflatoxins; HPLC; nuts; dried figs; Algeria.
Introduction
Dried fruits and nuts are very susceptible to fungal attacks. The growth of moulds and the accumulation of mycotoxins in food occur before or during harvest or storage and are influenced by critical environmental conditions (Kader & Hussein 2009). Humidity and temperature are considered to be the most important factors (Turner et al. 2005).
Today, dried fruits and nuts consumption is widespread. In Algeria, these commodities are very appreciated and used. In fact, many traditional meals and cakes are made with almonds and peanuts. A local production exists but it doesn’t cover the needs of consumers. Thus, the majority of peanuts and almonds sold in Algeria are imported from Brazil and United States of America (USA), respectively (Martins et al. 2017; ONS 2014). On the other hand, dates, prunes, apricots, figs and raisins are the major dried fruits produced in the Mediterranean area (Ozer et al. 2012). Algeria is one of the most important producers of figs in the world and has ranked third in terms of cultivated area after Turkey and Egypt (FAOSTAT 2013).
Dried fruits are susceptible to mould growth and mycotoxins formation because of their high sugar content, method of harvest and drying conditions (Trucksess & Scott 2008). Moreover, mycotoxins are often detected in foods from countries where
irrigation and pest management practices are lacking and food storage is poor. Climatic conditions in Algeria are characterized by high temperature and humidity levels that could stimulate toxigenic mould growth and AF production.
Among more than 20 identified AFs which contaminate several agriculture crops, aflatoxins B1 (AFB1), B2 (AFB2), G1 (AFG1) and G2 (AFG2) are the main naturally produced AFs. AFB1 is considered the most abundant and toxic mycotoxin (Lai et al. 2015). It is known to be teratogenic and mutagenic, causing damage, mainly in the liver (Hamid et al. 2013). Moreover, it was classified as a group I carcinogen by the International Agency for Research on Cancer (IARC 2002). Thus, consumption of contaminated food may lead to health effects for the population.
Due to the significant health risks associated with the presence of AFs, various countries established legal limits for AFs in dried fruits and nuts. The European Commission (2012) set maximum AF levels in dried fruits intended for direct human consumption or use as an ingredient in foodstuffs at 2 μg kg-1 for AFB1 and 4 μg kg-1 for the sum AFB1+AFB2+AFG1+AFG2 (AFs) and 6 μg kg-1 for AFB1 and 10 μg kg-1 for total AFs in dried figs. Concerning nuts, the maximum AF levels range between 2-8 μg kg-1
for AFB1 and between 4-10 μg kg-1 for total AFs, depending on the commodity (EC 2010). In Algeria the maximum limits for dried fruits and nuts are 20 μg kg-1 for total AFs and 10 μg kg-1 for AFB1 (FAO 2004).
Analytical methods based on immunoaffinity column (IAC) clean-up and high performance liquid chromatography (HPLC) have been generally used to quantify AFs in foods (Shephard et al. 2012). However, IACs have many disadvantages; they are expensive, have a limited storage time and are not available in Algeria. Since the presence of AFs in food is a matter of serious concern for the public health, their rapid detection and quantification is essential to ensure safe human consumption.
Available occurrence data of AFs in dried fruits and nuts in Algeria are limited. Therefore, the objective of this study was to investigate the fungal contamination and the occurrence of AFs in peanuts, almonds and dried figs collected from different
Algerian localities. The quantification of AFs was performed using a simple, fast, cheap and sensitive analytical method based on an extraction of AFs using acetonitrile before analysis by HPLC with fluorescence detection (FLD) and post-column on-line
photochemical derivatization (PCD) to increase significantly the fluorescence of AFB1 and AFG1.
Material and Methods
Food samples
Various types of dried fruits and edible nuts (112 samples) including unshelled peanuts (12), shelled peanuts (37), almonds (30) and dried figs (33) were collected in Algeria between 2015 and 2017. Unshelled peanuts and dried figs were sampled from local producers, whereas almonds and shelled peanuts were purchased from several markets and shops. The sample size was at least 400g each. All samples were finely ground and mixed using a kitchen grinder. From the homogenized sample a 100g sub-sample was taken. An aliquot of 50g was selected from each sample for fungal analysis, before storage of the remaining sample at -20°C for aflatoxins analysis. If applicable, peanuts were shelled manually before grinding. Blank samples (free of AFs) of each matrix were also purchased from markets in Granada (Spain) and used for validation purposes.
Chemicals and reagents
Standard solutions of AFB1 (200 μg L-1), AFB2 (50 μg L-1), AFG1 (200 μg L-1) and AFG2 (50 μg L-1) in acetonitrile were purchased from Sigma Aldrich (Steinheim, Germany). Working standard solutions were prepared by dissolving each mycotoxin in acetonitrile. Standards were stored in a freezer at -20oC until further use. All solvents were of HPLC grade and were supplied by Sigma Aldrich. The water used for
chromatography was purified on a Milli-Q Plus System (18.2 MU cm-1; Millipore Bedford, MA, USA). Syringe filters (25 mm, 0.22 µm nylon membrane; Agela
Technologies, DE, USA) were used for filtration of extracts.
Mycobiota isolation and identification
Ten grams of each sample were homogenized with 90 mL of sterile distilled water for 15 min. Successive decimal dilutions were prepared up to 10-6 and 0.1 mL of each dilution was inoculated into Dichloran Rose Bengal Chloramphenicol (DRBC) medium. Plates were incubated at 25°C for 5 days in darkness (Pitt & Hocking 2009). All
samples were processed in triplicate. After incubation, colonies were counted and the results were expressed as colony forming units per gram substrate (CFU/g). Colonies were subcultured on Czapek Yeast Extract Agar (CYA) at 25°C for 7 days. The fungi belonging to Aspergillus section Flavi were identified to the species level according to Pitt & Hocking (2009).
Natural AFs occurrence
AFs extraction from food samples was performed following the procedure previously reported by Arroyo-Manzanares et al. (2015), with minor modifications. From each milled and homogenized sub-sample, 2 g were weighed into a 50-mL centrifuge tube. AFs were extracted with 10 mL of acetonitrile by shaking for 5 min. Samples were then centrifuged for 10 min at a speed of 4500 rpm. Two millilitres of the supernatant were transferred to a vial, evaporated to near dryness and reconstituted and resuspended in 1 mL of methanol/water (50:50, v/v). Finally, the extracts were filtered with a 0.2 μm nylon filter and analyzed by HPLC-FLD.
Chromatographic conditions
Chromatographic experiments were carried out using a modular HPLC system (Jasco, Tokyo, Japan) equipped with: a quaternary pump (Model PU-2089); an autosampler with 100 mL loop (Model AS-2055); a column thermostat (X-LC-3067CO) and a
fluorescence detector (Model FP-2020). Photochemical derivatization was performed using a photochemical derivatization module (LCTech GmbH, Obertaufkirchen, Germany), which consisted of a 254 nm lamp, placed between the a C18 Kinetex column (150 mm x 4.6 mm, 2.6 µm from Phenomenex, Torrance, CA, USA) and the detector. Instrumentation control, data acquisition and processing were computed via ChromNAV software (1.09.03 version, Jasco).
Samples were analyzed according to the method proposed by
Arroyo-Manzanares et al. (2015) with some modifications. Elution was performed at a flow rate of 0.9 mL/min with a mixture of water (eluent A), acetonitrile (eluent B) and methanol (eluent C) as mobile phase, with the following linear gradient elution: constant
acetonitrile composition of 27%, 0% C (0-3 min), 13% C (20 min) and 68% C (21-23 min). The temperature of the column was 30°C and the injection volume was 50 μL. The excitation and emission wavelengths for the determination of the AF derivatives were 365 and 460 nm, respectively. Identification of compounds was achieved by comparing their retention time values with those of standards.
Method validation of AFs
The analytical method was validated by the evaluation of linearity, limits of detection (LOD) and quantification (LOQ), precision and trueness based on recovery studies for each matrix. Calibration curves were obtained using blank samples of each matrix spiked with the following concentrations of AFs: 1, 5, 10, 25 and 50 μg kg-1 ,
corresponding to AFs concentrations in the final extracts of 0.4, 2, 4, 10 and 20 μg L-1, respectively. Each level was prepared in duplicate and submitted to the subsequent extraction procedure. The statistical parameters were calculated by least-square regression. LOD and LOQ were defined as 3 × and 10 × S/N ratio, respectively. The precision and the recovery of the method were evaluated by application of the whole
procedure to 6 samples (experimental replicates) spiked at 10 μg kg-1. Each sample was injected in duplicate (instrumental replicates). The precision was expressed as RSD of peak areas. Recoveries were calculated as (signal of a spiked sample/signal of a spiked extract) x 100%. Measurement uncertainty was calculated by μ = s/√n, where n was the number of measurements in the data set and s the standard deviation of the n ratios.
Results and discussion
Fungal counts
Total fungal counts (CFU/g) were obtained from different samples on DRBC medium. The average fungal counts were 1.7×10⁶ CFU/g in almonds, 4×10⁵ CFU/g in dried figs, 1.7×10⁵ CFU/g in shelled peanuts and 1.2×10³ CFU/g in unshelled peanuts. Unshelled peanuts stored had the lowest levels of mould count. Nutshells act as a protection against attempts of fungi to penetrate kernels. Breaking of shells through mechanical damages by insects or during drought stress in the last stages of growth increases the chances of fungal contamination (Mutegi et al. 2013). Our results indicated that 67 out of 112 (60%) samples exceeded the maximum limit (1 × 10⁴ CFU/g) that determines the hygienic quality of food (Good Manufacturing Practices, 2006). However, a significant difference between the various commodities was observed in the percentage of samples exceeding the limits. Almonds were the most contaminated with 88% (29 out of 33) samples below the maximum limit (104 CFU/g) followed by dried figs with 64% (21 out of 33) and peanuts (34.7%). This reflects deficient hygienic practices during storage.
Similar results were obtained in a previous study conducted by Baquião et al. (2012) in which high levels (>106 CFU/g) of fungal contamination on Brazil nut pods has been demonstrated. Also, Kamika et al. (2014) reported high colony counts in several samples of peanuts from the Republic of Congo, with 50% of all samples being
above 104 CFU/g. Furthermore, in an investigation conducted by Isman & Biyik (2009) low amounts of mould, ranging between1.1×103 to 104 CFU/g, were detected in dried figs. These differences could be related to the climatic factor and storage conditions, as control of moisture and temperature conditions during storage is important to avoid mould growth.
Characterization of isolates
Aspergillus isolates recovered from samples belonged to different sections. The sections Nigri and Flavi were the most prevalent ones and they were found in 48.4 and 50% of
total samples respectively. Almonds showed the highest frequency (81.2%) of
contamination by Aspergillus section Nigri. Aspergillus section Flavi instead was found to be a frequent contaminant in peanuts with a percentage of 73%. Aspergillus section
Circumdati was found in all samples at low levels. Dried figs presented a low
contamination with Aspergillus section Fumigati. Members of Aspergillus section
Terrei were found in 6% of the samples of almonds. Aspergillus section Candidi was
not a common contaminant and was present only in two samples of dried figs.
A total of 203 strains of Aspergillus section Flavi were isolated and identified using morphological criteria. The colonies were yellowish to brownish green on CYA medium. The identified strains in this investigation were A. parasiticus, A. flavus, A.
oryzae and A. tamarii. Aspergillus flavus was the most abundant species (181 isolates)
presenting dark-green to yellow-green colonies with smooth conidia. Only two A.
parasiticus strains were isolated from dried figs and almonds and were characterized by
dark-green colonies and echinulate conidia. Two other species were identified at a low frequency represented by A. tamarii (11 isolates) and A. oryzae (9 isolates). Aspergillus
tamarii species presented a characteristic deep brown colony colour and rough conidia,
Method validation for AFs
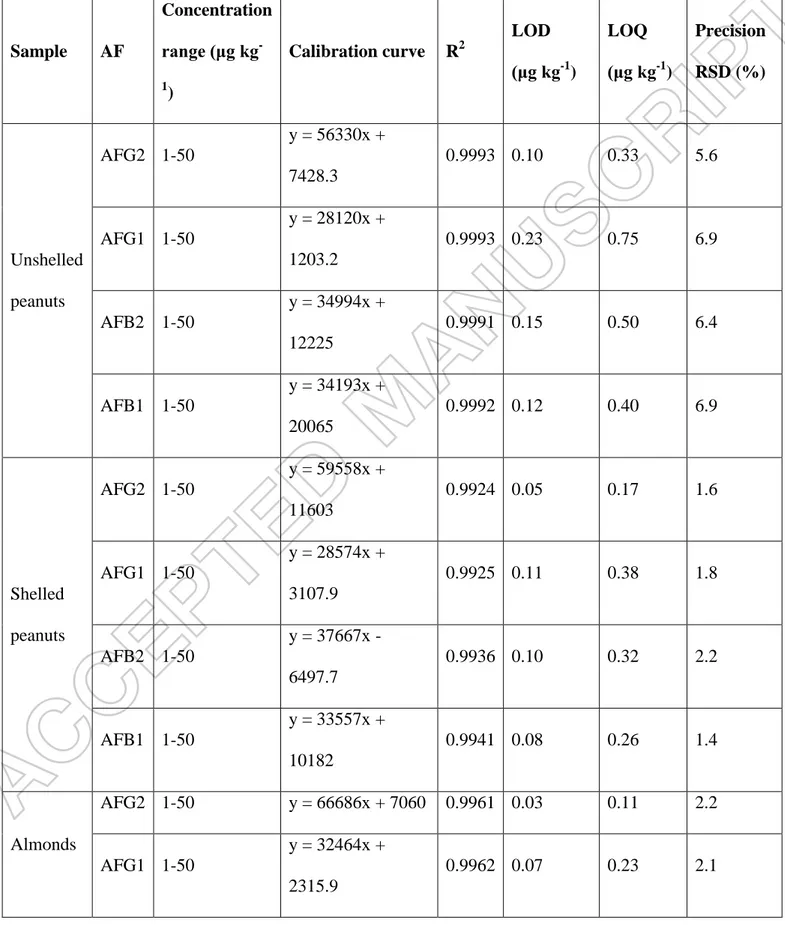
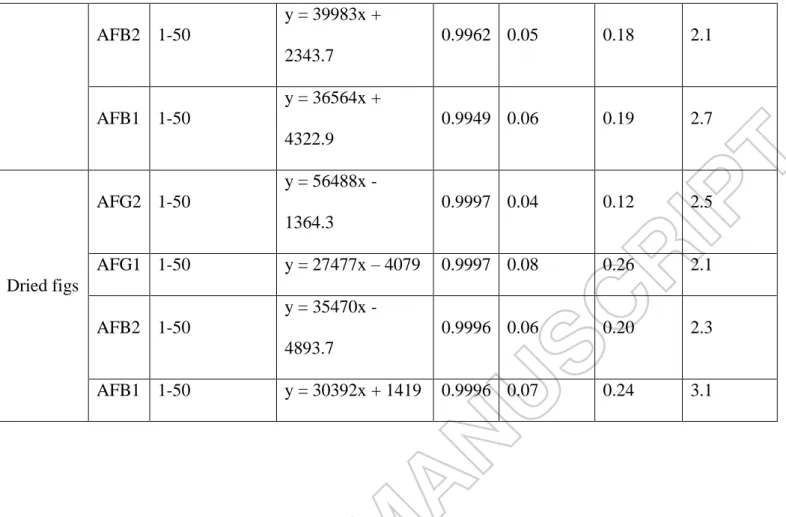
All calibration curves showed good linearity within the range studied since the determination coefficients (R2) were above 0.99 in all cases (Table 1). The LODs and LOQs for the 4 AFs ranged between 0.03 and 0.23 μg kg-1 and from 0.11 to 0.75 μg kg
-1
, respectively, clearly indicating the sensitivity of the applied method. Precision is expressed as RSD. In all cases RSD values lower than 7% were obtained. Both LOQs as RSD data fulfilled the requirements of Commission Regulation No 401/2006 (EC, 2006). Recovery data showed the trueness of the analytical method for AF
determination. The recovery values ranged between 94.5% and 105.3% (Table 2), showing satisfactory trueness when compared to the performance criteria requiring 70– 125% for a concentration of 10 μg kg-1 (EC, 2006). The uncertainty of the method varied between 0.04-0.2, 0.06-0.18, 0.05-0.19 and 0.04-0.16 μg/kg for AFB1, AFB2, AFG1 and AFG2, respectively.
AFs determination
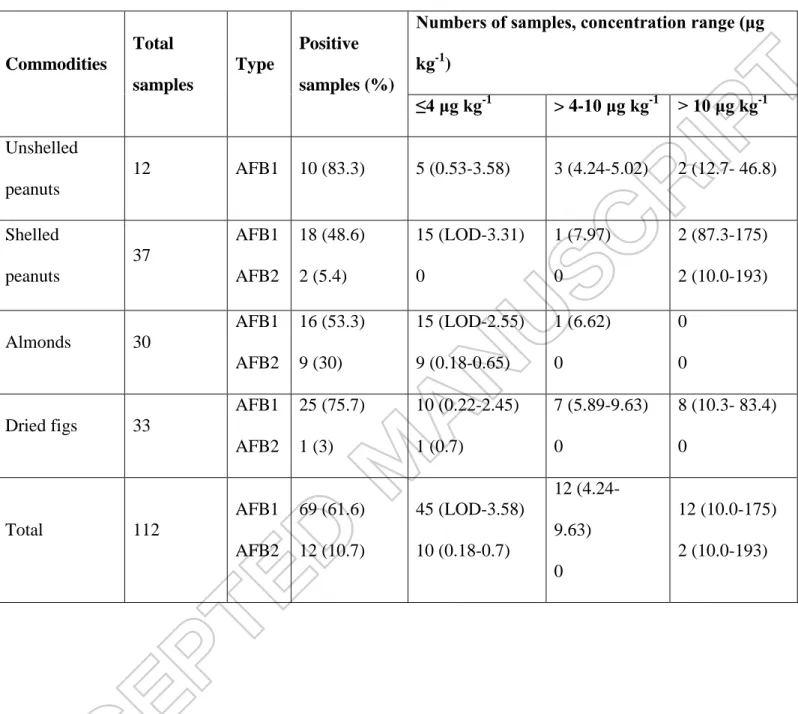
Data regarding AF contamination in the studied samples are summarized in Table 3, showing AFG1 and AFG2 were not found. A number of 70 samples out of 112 (62.5%) were infected with AFs, AFB1 having a higher frequency then AFB2. AFB1 was found in 10 samples of unshelled peanuts, 18 of shelled peanuts, 16 of almonds and 25 of dried figs, which accounted for 61.6% of the total samples. AFB1 and AFB2 were simultaneously detected in 9.8% of all samples (9 samples of almonds and 2 of shelled peanuts). One sample of dried figs was contaminated only with AFB2. The
contamination range for AFs was between LOD-193 μg kg-1. AFs were below the LOQ in 7 (6.3%) samples. AFs were in the range LOQ-4 μg kg-1 in 46 (41%) samples. In addition, 12 (10.7%) samples exhibited AFs levels between 4−10 μg kg-1
, while 12 (10.7%) samples contained levels of AFB1 greater than 10 μg kg-1, being unfit for
human consumption with reference to the maximum limits in Algeria (10 μg kg-1 for AFB1 and 20 μg kg-1 for total AFs).
A large number of dried figs samples were contaminated with AFs above European limit values (6 μg kg-1 for AFB1 and 10 μg kg-1 for total AFs). Out of 33 samples, 14 (42.4%) contained AFB1 levels above 6 μg kg-1. The lowest AFs levels were found in almonds, with only 3 samples out of 30 (10%) having a concentration of AFB1 above 2 μg kg-1 ranging between 2.06 and 6.62 μg kg-1. However, this
contamination level lies below the EU limits of 8 μg kg-1 for AFB1 and 10 μg kg-1 for total AFs in almonds (EC, 2010). More than half of unshelled peanuts (7 samples) exceeded the European regulation for AFB1 content while three samples reached the maximum limit for the sum of four AFs. In 4 out of 37 samples of shelled peanuts, concentrations of AFB1 were above 2 μg kg-1 and from these samples 2 had total AFs levels higher than 4 μg kg-1.
Nuts and dried fruits are suitable substrates for growth of aflatoxigenic fungi and AF production. Many studies have reported AFB1 and AFB2 as the most common contaminants in comparison to AFG1 and AFG2 (Wu et al. 2016), due to contamination by A. flavus. This can be explained by low levels of contamination by A. parasiticus. Climatic conditions can also affect AF production. Suitable temperatures for AF
production range between 20°C and 35°C. A high temperature (30-35°C) favours AFB1 and AFB2 production. In contrast, a low temperature (15-20°C) favours the production of AFG1 and AFG2 (Schroeder & Hein 1967).
Due to the susceptibility of peanuts to be contaminated by AFs, several researchers have investigated their contamination and reported high levels in peanuts and peanut products (Mutegi et al. 2013; Oliveira et al. 2009). Mupunga et al. (2014) showed contamination of peanuts from Zimbabwe with AFB1, AFB2 and AFG1, where
17% of the samples were contaminated with total AFs ranging from 6.6 to 622.1 μg kg
-1
. Nakai et al. (2008) found AFB1 in 33.3% of peanut samples at mean levels ranging from 7.0 to 116 μg kg-1 and 28.3% were contaminated with AFB2 at levels ranging from 3.3 to 45.5 μg kg-1. Besides, 70.8% of the contaminated samples exceeded the maximum limit of 20 μg kg-1 for the sum of AFs. In a recent report conducted in Eastern Ethiopia, Mohammed et al. (2016) analyzed groundnut seeds and cake, and detected total aflatoxins levels even reaching 3135 μg kg−1.
Contamination of peanuts by AFs can occur during production, storage, transportation and marketing (Mutegi et al. 2013). AF contamination can increase 10-fold in a 3-day period, when grains are stored with high moisture content (Hell et al. 2008). Environmental factors such as rainfall, humidity, temperature and respiration are likely to accelerate contamination by AFs. Low levels of AF incidence in almonds were found in this study, probably due to the low level of contamination with aflatoxigenic
Aspergillus fungi. Our results are in agreement with the observation of Rodrigues et al.
(2012) who reported a low contamination of almond samples during the period of storage. Almonds are considered at lower risk of AF contamination (Jelinek et al. 1989). Recently, Galal (2017) investigated AF contamination in samples from different
Egyptian markets. Results indicated that all collected in-shell and shelled almonds, were free from AFs. A survey on the occurrence of AFs in stored almonds from Iran showed negligible amounts of AFB1, ranging from 0.016 to 0.696 μg kg-1 (Amiri et al. 2013). However, opposite results were found in a survey from Saudi Arabia which indicated a total contamination of 40% in almonds with levels varying between 38 and 45 μg kg-1 (Deabes & Al- Habib 2011). AF production in these commodities could be associated with low-quality (damaged seeds) products, poor drying, handling or storage.
It has been shown that storage duration in warm humid conditions affects fungal growth and AF production in nuts. Prolonged storage significantly increases AF
contents of almond seeds compared to short storage periods (Saleemullah et al. 2006). Temperature, water activity and substrate composition are determinants in pre and postharvest environments influencing both the rate of fungal spoilage and AF
production (Magan & Aldred 2007). During storage, the moisture content of almonds decreases. However, this reduction is not fast enough to avoid surface contamination by filamentous fungi and potentially AFs producing species.
Another factor that might be influencing the amount of AFs in almonds is the production of AF inhibiting compounds. Isolated bacteria from almonds have been previously investigated by Palumbo et al. (2006) for their antifungal activity against aflatoxigenic A. flavus. It has been demonstrated that several isolates were capable to produce a diffusible metabolites, resulting in growth inhibition of A. flavus. This work suggests an implication of these bacteria in reducing AF amounts in almonds.
Moreover, it has been reported that aflatoxigenic isolates are able to persist or even grow in almonds, but may not produce AFs (Rodrigues et al. 2012).
Figs differ from other fruits, as toxigenic fungi may grow and produce AFs on the outer surface or inside the cavity even if no damage occurs on the skin. The critical period for AFs formation in dried fig fruits starts with the ripening of figs on the tree, continues during the over-ripe period when they lose water and fall down on the ground and until they are fully dried on drying trays (Codex Alimentarius Commission, 2008). Dried figs are known to be susceptible to AF contamination. Kabak (2016) detected AFs in 12.3% of dried fig samples at levels varying between 0.1 and 28.2 μg kg-1. All 4 AFs were detected, most frequently AFB1 (12.3%) with levels ranging from 0.1 to 12.5 μg kg-1
Heshmati et al. (2017). AFB1, AFB2, AFG1 and AFG2 were found in 13, 8, 5 and 4 out of 22 samples, with average concentrations of 2.65, 0.74, 0.36 and 0.32 μg kg-1,
respectively. In addition, AFB1 was present in 7 (31.2%) samples at higher levels than the EU limit (EC 2012). In another survey, 42% of dried fig samples collected from orchards at the beginning of the drying process were contaminated with AF. Some samples from specific orchards contained AF as high as 763 μg kg-1 (Heperkan et al. 2012). However, an assessment of the exposure of Catalonian (Spain) population to AFs, revealed that only 1 out of 49 dried fig samples was contaminated with AFs at a level of 0.62 μg kg-1 (Cano-Sancho et al. 2013).
Conclusions
This study provided relevant information about the occurrence of AFs and the presence of Aspergillus section Flavi species in dried figs and nuts from Algeria. Different
Aspergillus species belonging to section Flavi have been identified. The analytical
method for AFs in the studied commodities is fast and sensitive, with a LOQ lower than the maximum limits. Dried figs and unshelled peanuts from local producers contained high amounts of AFs. These results indicate the need for strict food control programmes for all commodities and especially for those cultivated in Algeria. Good agricultural and good storage practices should be applied to avoid AF production and to ensure food safety for human consumption.
The authors gratefully acknowledge the financial support of the Spanish Ministry of Economy and Competitiveness (Project ref: AGL2015-70708-R).
References
Amiri MJ, Karami M, Sadeghi E. 2013. Determination of AFB1 in Peanut, Almond, Walnut, and Hazelnut in Kermanshah Markets, Iran. Intl J Agri Crop Sci. 6: 1199-1202.
Arroyo-Manzanares N, Huertas-Perez JF, García-Campana AM, Gamiz-Gracia L. 2015. Aflatoxins in animal feeds: A straightforward and cost-effective analytical method. Food Control. 54: 74-78.
Baquião AC, Zorzete P, Reis TA, Assunção E, Vergueiro S, Correa B. 2012. Myco- flora and mycotoxins in field samples of Brazil nuts. Food Control. 28: 224-229. Cano-Sancho G, Sanchis V, Marín S, Ramos AJ. 2013. Occurrence and exposure
assessment of aflatoxins in Catalonia (Spain). Food Chem Toxicol, 51, 188-193. Codex Alimentarius Commission (2008). Code of practice for the prevention and
reduction of aflatoxin contamination in dried figs. CAC/RCP, 65–2008.
Deabes M, Al- Habib R. 2011. Toxigenic fungi and aflatoxin associated to nuts in Saudi Arabia. Am. J. Sci. 17: 658-65.
EC (2006). Commission Regulation (EC) No 401/2006 of laying down the methods of sampling and analysis for the official control of the levels of mycotoxins in foodstuffs. Official Journal of the European Union, L70: 12-34.
EC (2010). Commission Regulation (EU) No 165/2010 of 26 February 2010 amending Regulation (EC) No 1881/2006 setting maximum levels for certain contaminants in foodstuffs as regards aflatoxins. Official Journal of the European Union, L50:8-12.
EC (2012). Commission Regulation (EU) No 1058/2012 of 12 November 2012 amending Regulation (EC) No 1881/2006 as regards maximum levels for aflatoxins in dried figs. Official Journal of the European Union, L313:14-15. FAO (2004). Food and Agriculture Organization of the United Nations Worldwide
Regulations for Mycotoxins in Food and Feed in 2003. FAO food and nutrition paper, Nº 81, Rome.
FAOSTAT, 2013. Food and Agriculture Organization of the United Nations. Available on: http://www.fao.org/faostat/en/#rankings/countries_by_commodity. Accessed 20.07.17.
Galal HA. 2017. Evaluation of aflatoxin contamination and quality of nuts in Egyptian markets and after cold storage. Menoufia Journal of Plant Production. 2: 169-176.
Good Manufacturing Practice. GMP+ Certification Scheme Animal Feed Sector 2006: Appendix 1: Product standards. In Regulations on Product Standards in the Animal Feed Sector; GMP 14, Zoetermeer, The Netherlands, 2008; pp. 1-39. Hamid AS, Tesfamariam IG, Zhang Y, Zhang ZG. 2013. Aflatoxin B1 induced
hepatocellular carcinoma in developing countries: Geographical distribution, mechanism of action and prevention (Review). Oncol Lett, 5: 1087-1092. Hell K, Fandohan P, Bandyopadhyay R, Cardwell K, Kiewnick S, Sikora R, Cotty P.
2008. Pre- and post-harvest management of aflatoxin in maize. In: Leslie, J.F., Bandyopadhyay, R., Visconti, A. (Eds.), Mycotoxins: Detection Methods, Management, Public Health and Agricultural Trade. 210-219.
Heperkan D, Güler FK, Oktay HI. 2012. Mycoflora and natural occurrence of aflatoxin, cyclopiazonic acid, fumonisin and ochratoxin A in dried figs. Food Addit Contam. 29: 277-286.
Heshmati A, Zohrevand T, Khaneghah AM, Mozaffari Nejad ASS, Sant’Ana A, Co-occurrence of aflatoxins and ochratoxin A in dried fruits in Iran: Dietary exposure risk assessment, Food Chem Toxicol. 2017, doi:
10.1016/j.fct.2017.05.046.
IARC. 2002. Some traditional herbal medicines, some mycotoxins, naphthalene and styrene. Summary of data reported and evaluation. IARC Monographs on the evaluation of the carcinogenic risk to humans. Vol. 82. International Agency for Research on Cancer, Lyon, France.
Isman B, Bıyık H. 2009. The aflatoxin contamination of fig fruits in Aydin City (Turkey). J. Food Saf. 29: 318-330.
Jelinek CF, Pohland AE, Wood GE. 1989. Worldwide occurrence of mycotoxins in foods and feeds - an update. Journal - Association of Official Analytical Chemists. 72: 223-230.
Kabak B. 2016. Aflatoxins in hazelnuts and dried figs: Occurrence and exposure assessment. Food Chem. 211: 8-16.
Kader AA, Hussein AM. 2009. Harvesting and postharvest handling of dates. ICARDA, Aleppo, Syria, 15p.
Kamika I, Mngqawa P, Rheeder JP, Teffo SL, Katerere DR. 2014. Mycological and aflatoxin contamination of peanuts sold at markets in Kinshasa, Democratic Republic of Congo, and Pretoria, South Africa. Food Additives &
Contaminants: Part B: Surveillance, 7:2, 120-126, DOI: 10.1080/19393210.2013.858187
Lai X, He Z, Liu R, Liu C. 2015. Potential for aflatoxin B1 and B2 production by
Aspergillus flavus strains isolated from rice samples. Saudi J Biol Sci. 22:
176-180.
Magan N, Aldred D. 2007. Post-harvest control strategies: minimizing mycotoxins in the food chain. Int J Food Microbiol. 119: 131-139.
Martins LM, Anderson SS, Pelegrinelli Fungaro ME, Silva JJ, da Silva do Nascimento M, Frisvad JC, Hiromi Taniwaki M. 2017. The biodiversity of Aspergillus section Flavi and aflatoxins in the Brazilian peanut production chain. Food Res Int. 94: 101-107.
Mohammed A, Chala A, Dejene M, Fininsa C, Hoisington DA, Sobolev VS, Arias RS. 2016. Aspergillus and aflatoxin in groundnut (Arachis hypogaea L.) and
groundnut cake in Eastern Ethiopia. Food Additives & Contaminants: Part B, 9:4, 290-298, DOI: 10.1080/19393210.2016.1216468
Mupunga I, Lebelo SL, Mngqawa P, Rheeder JP, Katerere DR. 2014. Natural occurrence of Aflatoxins in peanuts and peanut butter from Bulawayo, Zimbabwe. J Food Prot. 77: 1814-1818.
Mutegi C, Maina Wagacha M, Kimani J, Otieno G, Wanyama R, Hell K, Christie MA. 2013. Incidence of aflatoxin in peanuts (Arachis hypogaea Linnaeus) from markets in Western, Nyanza and Nairobi Provinces of Kenya and related market traits. J Stored Prod Res. 52: 118-127.
Nakai VK, Rocha LO, Goncalez E, Foneseca H, Ortega EM, Correa B.
2008. Distribution of fungi and aflatoxins in stored peanut variety. Food Chem. 106: 190-285.
Oliveira CA, Gonçalves NB, Rosim RE, Fernandes AM. 2009. Determination of
aflatoxins in peanut products in the northeast region of São Paulo, Brazil. Int. J. Mol. Sci. 10 : 174-183.
ONS (2014). Office National des Statistiques. Evolution Des Echanges Exterieurs De Marchandises De 2003 A 2013. Collections Statistiques N° 188/2014 Série E: Statistiques Economiques N° 79.
Ozer H, Oktay Basegmez HI, Ozay G. 2012. Mycotoxin risks and toxigenic fungi in date, prune and dried apricot among Mediterranean crops. Phytopathol Mediterr. 51, 148-157.
Palumbo JD, Baker JL, Mahoney NE. 2006. Isolation of bacterial antagonists of
Aspergillus flavus from almonds. Microb Ecol. 52: 45-52.
Pitt JI, Hocking AD. 2009. Fungi and Food Spoilage. 3rd edition, Springer New York, NY, USA, 540 pp.
Rodrigues P, Venancio A, Lima N. 2012. Aflatoxigenic fungi and aflatoxins in Portuguese almonds. Sci. World J. 2012: 1-9.
Saleemullah AI, Iqtidar A, Hamidullah Shah K. 2006. Aflatoxin contents of stored and artificially inoculated cereals and nuts. Food Chem. 98: 699-703.
Schroeder HW, Hein HJR. 1967. Aflatoxins: production of the toxins in vitro in relation to temperature. Appl Microbiol. 15, 441-445.
Shephard GS, Berthiller F, Burdaspal PA, Crews C, Jonker M. A, Krska R, MacDonald S, Malone RJ, Maragos C, Sabino M, Solfrizzo M, Van Egmond HP, Whitaker TB. 2012. Developments in mycotoxin analysis: an update for 2010-2011. World Mycotoxin J. 5: 3-30.
Trucksess MW, Scott PM. 2008. Mycotoxins in botanicals and dried fruits: a review. Food Addit Contam. 25: 1-12.
Turner PC, Sylla A, Gong YY, Diallo MS, Sutcliffe AE, Hall AJ, Wild CP. 2005. Reduction in exposure to carcinogenic aflatoxins by postharvest intervention measures in West Africa: a community-based intervention study. Lancet. 365: 1950-1956.
Wu LX, Ding XX, Li PW, Du XH, Zhou HY, Bai YZ, Zhang LX. 2016. Aflatoxin contamination of peanuts at harvest in China from 2010 to 2013 and its relationship with climatic conditions. Food Control. 60, 117-123.
Table 1. Method validation for the quantification of AFs. Precision was estimated by assessing six replicates of each sample spiked with aflatoxins at a level of 10 μg kg-1 (n=6, injected in duplicate). Sample AF Concentration range (μg kg -1 ) Calibration curve R2 LOD (μg kg-1 ) LOQ (μg kg-1 ) Precision RSD (%) Unshelled peanuts AFG2 1-50 y = 56330x + 7428.3 0.9993 0.10 0.33 5.6 AFG1 1-50 y = 28120x + 1203.2 0.9993 0.23 0.75 6.9 AFB2 1-50 y = 34994x + 12225 0.9991 0.15 0.50 6.4 AFB1 1-50 y = 34193x + 20065 0.9992 0.12 0.40 6.9 Shelled peanuts AFG2 1-50 y = 59558x + 11603 0.9924 0.05 0.17 1.6 AFG1 1-50 y = 28574x + 3107.9 0.9925 0.11 0.38 1.8 AFB2 1-50 y = 37667x - 6497.7 0.9936 0.10 0.32 2.2 AFB1 1-50 y = 33557x + 10182 0.9941 0.08 0.26 1.4 Almonds AFG2 1-50 y = 66686x + 7060 0.9961 0.03 0.11 2.2 AFG1 1-50 y = 32464x + 2315.9 0.9962 0.07 0.23 2.1
AFB2 1-50 y = 39983x + 2343.7 0.9962 0.05 0.18 2.1 AFB1 1-50 y = 36564x + 4322.9 0.9949 0.06 0.19 2.7 Dried figs AFG2 1-50 y = 56488x -1364.3 0.9997 0.04 0.12 2.5 AFG1 1-50 y = 27477x – 4079 0.9997 0.08 0.26 2.1 AFB2 1-50 y = 35470x - 4893.7 0.9996 0.06 0.20 2.3 AFB1 1-50 y = 30392x + 1419 0.9996 0.07 0.24 3.1
Table 2. Mean recoveries (%) for samples spiked at 10 μg kg-1
(n =6, injected in duplicate) and RSD values (%).
Aflatoxin
Unshelled peanuts
Shelled peanuts
Almonds Dried figs
AFB1 95.2 (7.3) 101.7 (1.5) 102.9 (2.6) 102.2 (3.0) AFB2 95.6 (6.7) 102.3 (2.2) 102.5 (2.0) 102.1 (2.2) AFG1 94.5 (6.9) 105.3 (1.8) 102.2 (2.0) 101.4 (2.0) AFG2 96.2 (5.7) 104.2 (1.6) 103.4 (2.1) 102.8 (2.4)
Table 3. Occurrence of AFs in peanuts, almonds and dried figs. Commodities Total samples Type Positive samples (%)
Numbers of samples, concentration range (μg kg-1) ≤4 μg kg-1 > 4-10 μg kg-1 > 10 μg kg-1 Unshelled peanuts 12 AFB1 10 (83.3) 5 (0.53-3.58) 3 (4.24-5.02) 2 (12.7- 46.8) Shelled peanuts 37 AFB1 AFB2 18 (48.6) 2 (5.4) 15 (LOD-3.31) 0 1 (7.97) 0 2 (87.3-175) 2 (10.0-193) Almonds 30 AFB1 AFB2 16 (53.3) 9 (30) 15 (LOD-2.55) 9 (0.18-0.65) 1 (6.62) 0 0 0 Dried figs 33 AFB1 AFB2 25 (75.7) 1 (3) 10 (0.22-2.45) 1 (0.7) 7 (5.89-9.63) 0 8 (10.3- 83.4) 0 Total 112 AFB1 AFB2 69 (61.6) 12 (10.7) 45 (LOD-3.58) 10 (0.18-0.7) 12 (4.24- 9.63) 0 12 (10.0-175) 2 (10.0-193)
View publication stats View publication stats