Publisher’s version / Version de l'éditeur:
Journal of the Acoustical Society of America, 63, 3, pp. 832-840, 1978-03
READ THESE TERMS AND CONDITIONS CAREFULLY BEFORE USING THIS WEBSITE. https://nrc-publications.canada.ca/eng/copyright
Vous avez des questions? Nous pouvons vous aider. Pour communiquer directement avec un auteur, consultez la première page de la revue dans laquelle son article a été publié afin de trouver ses coordonnées. Si vous n’arrivez pas à les repérer, communiquez avec nous à [email protected].
Questions? Contact the NRC Publications Archive team at
[email protected]. If you wish to email the authors directly, please see the first page of the publication for their contact information.
NRC Publications Archive
Archives des publications du CNRC
This publication could be one of several versions: author’s original, accepted manuscript or the publisher’s version. / La version de cette publication peut être l’une des suivantes : la version prépublication de l’auteur, la version acceptée du manuscrit ou la version de l’éditeur.
Access and use of this website and the material on it are subject to the Terms and Conditions set forth at
Studies of acoustical parameters in open-plan offices
Warnock, A. C. C.
https://publications-cnrc.canada.ca/fra/droits
L’accès à ce site Web et l’utilisation de son contenu sont assujettis aux conditions présentées dans le site
LISEZ CES CONDITIONS ATTENTIVEMENT AVANT D’UTILISER CE SITE WEB.
NRC Publications Record / Notice d'Archives des publications de CNRC:
https://nrc-publications.canada.ca/eng/view/object/?id=0ba0dbae-33db-4258-a81e-cb3e97ae6e4c
https://publications-cnrc.canada.ca/fra/voir/objet/?id=0ba0dbae-33db-4258-a81e-cb3e97ae6e4c
Se.
r
-7%'
/
N J / d
National Research
Conseil national
'
L:.
,a
'26
Council Canada
de recherches Canada
STUDIES OF ACOUSTICAL PARAMETERS
I N OPEN-PLAN OFFICES
~ m y mby A.C.C.
Warnock
Reprinted
ftom
Journal
of
the Acoustical Society of America
VoL 63, No. 3, March 1978
p. 832
840
DBR Paper No. 826
Lea principaux
ElEments
acoustLquesdes bureaux
sans cloisons-
fenstres, murs, plafonds et dcrans verticaw de sEparation-
ontf a i t L k b j e t d ' E t u d e s en laboratoire avec simulation
des
problemes acaustlques quf se posent. Aux fins de I'essai, I'environnement acoustique fondamental consista en une chambre sourde comportant un plancher en cantreplaquE recowert d'une moquette et sur lequelles
Clements d'easai o n t6t6
d E p l o y E s . Les meeures d e l'affaiblis- sement de la transmission du son fourni par diverses configurations ont 6t6 effectuses sur une bande de 113 d'octave et les donn6es ontG t E analysPes pour permettre d'gtudier sept
valeurs
(2
chfffreunique)
d'affaiblissementde
la transmfssioddu
son entreles
p o s t e s
de
travail ("attEnuation inter-zone"). De tautes lesvaleurs
EtudI&es,le
niveau p m d E r PA
etla
Classe dlFsolement dub r u i t correspondaient le m l e u x Z l'indice de n e r t e t 6 , qui
est
consider6 c m e
Grant
la "vraie" mesure du rendement.En ce
qui concerne la mise 2 l'essai des plafonds, il a Et6 confirm6 que la disposition d'essai des 6lEments couramment adopt6e est insensible aux changements significatifs dans la construction du plafond. On a proposE une simple modification de cette msthode.Studies of acoustical parameters in open-plan officesa)
A.
C. C.
Warnock
Division of Building Research, National Research Council of Canada, Ottawa. Canada
(Received 28 February 1977; revised 18 November 1977)
The major acoustical elements of open-plan offices-windows, walls, ceilings, and partial-height screens-have been studied.in laboratory simulations of open-office acoustical problems. The basic test environment is an anechoic room with a carpet-covered plywood floor over which the test elements are deployed. Measurements of attenuation provided by various configurations were made in one-third-octave bands and the data processed to permit study of seven single-figure ratings for attenuation between work stations (the "interzone attenuation"). Of the ratings tested the A-weighted level and the Noise Isolation Class correlated best with Articulation Index, which is taken as the "true" measure of performance. For testing ceiling systems it is confirmed that the commonly used test arrangement is insensitive to significant changes in the ceiling system. A simple modification of the procedure js proposed.
PACS numbers: 43.55.G~
INTRODUCTION
Most designers a r e aware of the important acoustical elements that produce an acoustically successful open- plan office. Many also recognize the importance of con- sidering seemingly small details. The quantitative evi- dence that has established the importance of these de- tails has not, however, always been placed in the open literature. This paper presents typical results for a variety of problem situations and compares different treatments that attempt to improve matters. Data a r e used to examine a currently popular test technique and improvements a r e proposed.
I. MEASUREMENT TECHNIQUES
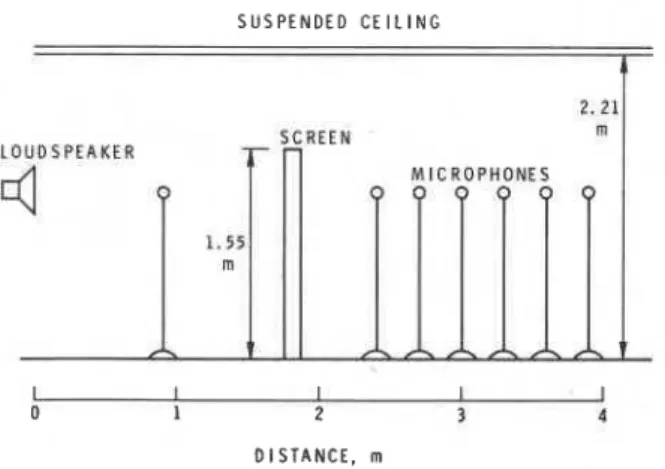
In all the measurements reported here, only minor variations were made in the techniques used. The ex- periments were carried out in an anechoic chamber with a carpet-covered plywood floor. A T-bar suspension system f o r supporting ceiling panels was added when ne- cessary a t a height of 2.21 m above the floor (the max- imum height available).
Figure 1 shows the positioning of the apparatus. The s c r e e n was 1.55 m high, and composed of sections 1.22 m wide. It could be extended the full width of the cham- b e r o r reduced in width
as
necessary. The test signal fed to the loudspeaker was a band of pink noise extend- ing from 100to
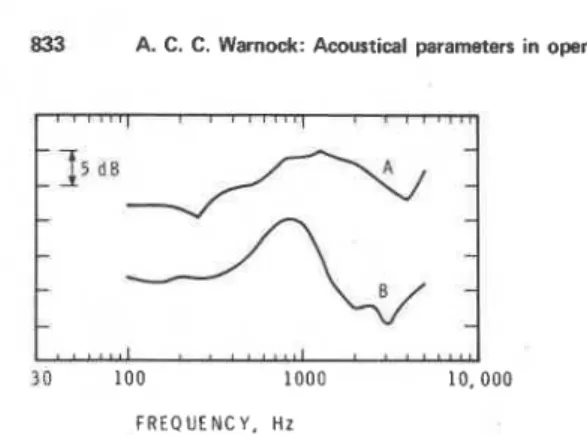
6300 Hz. A microphone 0.9 m (3 ft) in front of the loudspeaker provided reference levels, and measurements were taken at 0.3-m (l-ft) intervals in the range 2.44-3.9 m (8-13 ft) from the loudspeaker. Microphone signals were fed into a General Radio one- third-octave-band filter s e t and r m s detector controlledby a minicomputer that performed all necessary calcu- lations. Two different loudspeakers were used during the experiments. Neither was of very high quality,
as
shown by the frequency responses in Fig. 2. The off- axis response of these speakers in the range 0"-45" was not uniform for all frequencies. As the investigations
his
paper was presented at 93rd Meeting, of the Acoustical Society of America, Pennsylvania State University. June 1977 [J. Acoust. Soc. Am. 61. S33 (A) (1977)l.described here were mainly comparisons of different treatments, however, this complication is unimportant.
The output available from the bank of filters included A-weighted levels
a s
wellas
standard one-third-octave- band levels. From these measured levels, interzone at- tenuations, i.e., attenuations with respect t o the refer- ence microphone a t 0.9 m, were calculated for a l l fre- quency bands, then further reduced in several waysas
outlined in Sec. 11.II. REDUCTION OF MEASUREMENTS TO SINGLE- NUMBER RATINGS
In the course of the investigations many measure- ments were taken, and it was decided to examine sever- a l possible single-number methods for rank ordering the systems tested by these procedures. All data were stored in machine-readable form.
When one is concerned with speech privacy, objective measurements may be used in calculations of Articula- tion Index (AI) performed according to ANSI 53.5.' An
ideal voice spectrum may be assumed and an arbitrary background-noise spectrum chosen. Speech intelligi- bflitgr may then be estimated from AI, assuming that the relation between the two quantities is well defined.
S U S P E N D E D C E I L I N G
0 1 2 3 4
D I S T A N C E , m
FIG. 1. Positioning of apparatus.
833 A. C. C. Warnock: Acoustical parameters in open-plan offices
I ' " " " ' I '
""'=
:
: +:
LF R E Q U E N C Y . Hz
FIG. 2. .Frequency response of loudspeakers used. Sound pressure levels at 1 m on axis.
owm mad
has discussed the development of AI andquestioned some of i t s applications. His experimental data indicate that the relation between AI and intelligi- bility, obtained by varying masking-sound level, is not invariant but depends on the spectral characteristics of the masking sound, all other factors being held con- stant.
In contrast, a study by Webster and Klumpp3 of 16 shipboard noises indicates that A1 is successful in rating the noises studied. Webster and Klumpp do point out, however, that there seems to be a downward shift in the frequency of central importance
as
intelligibility is r e - duced. young4 suggested modified weighting factors to take account of this observation.Such published data suggest that AI
is
not uniquely r e - lated to speech intelligibility when speech/noise ratios o r masking-noise spectra a r e varied widely. In the open-plan office, however, the spectra of masking sounds that a r e considered acceptable do not vary wide- ly. As the design objectiveis
to attenuate speech, using screen/ceiling assemblies to produce an acceptable lev- el of privacy in the presence of masking sound, the spectrum of the speech received on the remote side of a screen must also be relatively constant. Under these conditions published information indicates that the AI isthe most accurate means currently available of estimat- ing speech intelligibility or, at the very least, changes in speech intelligibility.
Values of AI calculated according to ANSI 53.5' de- pend on voice level and background noise. To avoid this dependence, the standard A1 calculations were mod- ified to produce a single-number rating based on mea- s u r e d attenuations only. This is called DAI and is
formed
as
follows:where f i is the center frequency of the bands from 200 to 5000 Hz, A(fa) is the measured attenuation in the one-third-octave band with center frequency
f,,
w(fi) is the standard A1 weighting for that band given in ANSI S3.5.An examination of DAI ratings s o produced shows that, not unexpectedly, they correlate almost exactly with A1 values except when A1 approaches 0 o r 1. This
rating is used
as
the criterion for assessing the per- formance of the other ratings examined.In practice, two rating systems a r e in common use. The first of these is called NIC', and is defined in the documents of the Public Buildings Service (PBS) of the U.S. General Services ~ d m i n i s t r a t i o n . ~ The NIC' rat- ing procedure is a modification of the standard proce- dure that gives a Noise Isolation Class
(NIC).'
NIC' is here identified by the acronym SPNACl (Speech Privacy Noise Attenuation Class) to avoid confusion with the longer-established t e r m NIC.T o derive the SPNAC, rating for a particular test, the interzone attenuations for the eight one-third-octave bands from 400 to 2000 Hz, inclusive, a r e averaged over distance and fitted to the NIC contour in the same frequency range. Adverse deviation is limited to a to-
tal
of 16 dB and to 4 dB in any single band. Thisis
the requirement given in Ref. 5.The second common rating is the A-weighted level difference. F o r this rating the frequency range was de- termined by the bandwidth of the input signal to the loud- speaker, .loo-6300 Hz. The spectrum of the broadcast sound was determined by the loudspeaker frequency re- sponse, subject to A weighting.
The complete range of rating systems examined in- cluded the following:
DAI-already defined, ALD1--elready defined, SPNAC1-already defined,
SPNACz-the same
as
rating SPNACl (and Nk'), with the 4-d3 limitation on maximum adverse deviation r e - moved,SIL,--based on Speech Interference Level (S1L)-av- erage attenuation in the four octave bands: 250, 500, 1000, and 2000 Hz,
SIL,--average attenuation in the three octave bands 500, 1000, and 2000 Hz,
ALDz-measured one-third-octave-band attenuations a r e used to calculate A-weighted level differences for a pink-noise source-this effectively removes loud- speaker frequency response effects from consideration,
NIC
-Noise Isolation Class a s defined in Ref. 6. Most measurement results a r e presented in t e r m s of the DAI, SPNAC1, and ALDl.Ill. REFLECTIONS FROM NEARBY VERTICAL
SURFACES AROUND SCREENS
A s e r i e s of tests was carried out on vertical reflect-
ing surfaces equivalent t o windows, walls, and columns. Ceiling reflections were negligible. Reflections from window glass around a screen dividing work areas con- stitute a particular problem because commonly used window-covering materials such
as
Venetian blinds o r lightweight draperies have a negligible effect on such reflections. A different type of blind is available that one might assume to be an improvement on the Venetian834 A. C. C. Warnock: Acoustical parameters in open-plan offices
TABLE I. Configurations of vertical window s l a t s tested.
- . - . .
A 90-mm-wide vinyl s l a t , 90 m m between c e n t e r s B 90-mm-wide slat, 90-mm o. c.
,
perforated vinyl C 110-mm-wide vinyl s l a t , 110 m m O.C.D Sound-absorbing s l a t s 127 m m wide, 16 m m thick. T h e surface is uniformly perforated and the i n t e r i o r filled with sound-absorbing material. T h e NRC obtained when tested according to ASTM C 423 i s reported a s 0.6.
blind. These blinds have broader, vertically suspended slats. One model has hollow slats filled with sound-ab- sorbing material. Table I lists the selection of blinds tested.
Loudspeaker B was used
as
the sound source in these measurements and the b a r r i e r screen was 2.44 m wide.A vertical (2.44x2.13 m2) hard-reflecting surface was symmetrically placed parallel to the measuring axis and perpendicular to the plane of the extension of the b a r r i e r screen to reflect sound around it, simulating a hard wall o r window. The distance between the wall, on which specimens were mounted, and the edge of the screen varied. Details a r e given in the tables where appropri- ate. A highly absorbing 50-mm-thick glass-fiber ceil-. ing was in place while the measurements in Tables
I1
and Ill were taken.
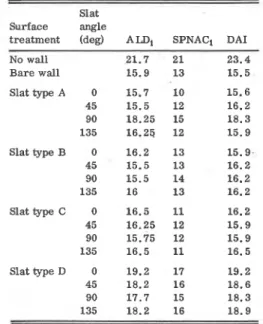
Table I1 lists the mean interzone attenuations obtained for four orientations of the slats. The values for a bare wall and no wall a t all a r e included for comparison. These values a r e for a source-microphone distance of
TABLE II. Mean interzone attenuations f o r source-microphone distances of 3.35-3.96 m (11-13 ft) showing effects of angle of s l a t rota- tion and type of slat. Measuring axis 1.22 m (4 ft) f r o m the floor. Screen edge 0.71 m f r o m vertical surface.
Slat Surface angle
treatment (deg) ALD, SPNAC1 DAI
No wall 21.7 2 1 23.4 B a r e wall 15.9 13 15.5 Slat type A 0 15.7 1 0 15.6 45 15.5 12 16.2 90 18.25 1 5 18.3 135 16.23 12 15.9 Slat type B 0 16.2 1 3 15.9. 45 15.5 1 3 16.2 90 15.5 1 4 16.2 135 1 6 1 3 16.2 Slat type C 0 1 6 . 5 11 16.2 45 16.25 12 1 5 . 9 90 15.75 12 15.9 135 16.5 11 16.5 Slat type D 0 19.2 1 7 19.2 45 18.2 1 6 18.6 90 17.7 15 18.3 135 18.2 16 18.9
TABLE III. Mean interzone attenuations f o r source-micro- phone distance of 3.35-3.96 m (11-13 ft) f o r some other s u r - face treatments. H is the height of the measuring axis. The midplane of the s a m p l e s w a s 140 m m f r o m the wall unless otherwise noted.
ALD, SPNAC, DAI
No wall, H=1.22 m 21.7 21 23.4
710-mm screen-wall gap, H = 1.22 m
Bare wall 15.9 13 15.5
110-m slat, 90 mm O.C. 16 11 16.2
25-mm layer rigid glass fiber in contact
with wall 19.25 17 20.7
200% full glass-fiber drapes over bare
wall (0.2 k / m 2 ) 14.75 12 15
255-mm screen-wall gap, H = 1.22 m
Bare wall 17 16 17.2
110-mm slat, 90 mm O.C. 18.2 15 18.6 200% full glass-fiber drapes (0.2 kg/m2) 16.7 15 16.5 255-mm screen-wall gap, H = 910 mm
No wall Bare wall
100-mm slat. 90 mm o. c.
3.35-3.9 m (11-13
it),
the region where specular r e - flection is worst. It is evident that the orientation of the slats is not important. A single value seems to r e - M e this, but it is ascribedto
experimental e r r o r . One may also conclude the following: (a) None of the simple vinyl slats produces worthwhile improvement over a bare wall for the screen-wall gap tested; @) perfora- tions in the slats have no accoustical effect; (c) absor-bent slats improve the mean interzone attenuation by about 3 dB, which is useful, but a r e about 5 dB worse than no wall a t all.
Table
III
lists data obtained under similar test condi-TABLE IV. Mean interzone attenuations f o r horizontal s l a t s with and without absorptive treatment. Source-microphone distances 3.35-3.96 m (11-13 ft). Screen 0.91 m f r o m r e - flecting wall and loudspeaker pointing a t wall.
ALD, SPNACI DAI
1 No reflecting wall 21.7 18 21.6
2 2.13-m-highx 1.22-m-wide plywood wall. 10.2 7 10 bare
3 25-mm layer of clotb- covered rigid glass 17.2 15 18 fiber on wall
4 50-mm layer of cloth-covered rigid glass
Hber on wall 20.2 1 8 20.1
5 25-mm layer of glass flber, spaced 25 mm
from wall surface 18.5 17 18.6
6 82-mm-wide slats; midplane 127 mm from
wall, 45" to wall aurface, 77 mm o. c. 10.2 8 10.5 7 82-mm-wide slats; midplane 127 mm from
wall. 45" to wall surface. 150 mm o. c. 1 0 7 10.2 8 150-mm-wide slats; centerline 127 mm
from wall. .45"to wall. 150 mm O.C. 10.2 7 10.2
9 As 8, but 16-mm rigid glass fiber fixed to
slats, 150 mm o. c. 14.2 11 14.7
10 Aa 9. but 230 mm O.C. 14.2 12 14.7 11 Aa 9. but 300 mm O.C. 13.2 11 13.2
835 A. C. C. Warnock: Acoustical parameters in open-plan offices
TABLE V. Effect of reducing screen-wall gap on interzone attenuation. Mean for source-microphone distances of 3.35- 3.96 m (11-13 ft). The reflectingwall i s 2 . 1 3 mhighx 1.22 m wide, and the loudspeaker points at the screen.
T e s t conditions ALDl SPNAC, DAI 1 No reflecting wall 2 2 . 5 19 2 2 . 5
2 0.91-m gap 1 5 . 7 12 1 5 . 3
3 0.61-m gap 13.7 11 14.4
4 0.3-m gap 15.5 13 15
5 0.15-m gap 18 14 18
6 Wall in contact with screen edge 21.7 19 21
tions for several other surface treatments. The follow- ing conclusions may be drawn:
(a) For a 0.71-m screen-wall gap, (i) neither slats nor glass-fiber drapes a r e effective, and (ii) the 25- mm-thick layer of rigid glass fiber improves interzone attenuation over the bare wall by about 4 dB, but the values obtained a r e still about 3 dB worse than with no wall a t all.
@) For a 0.25-m screen-wall gap, the slats appear to be about 1.5 dB better than a bare surface. This con- clusion is not, however, borne out by the SPNAC, rating, which differs from the two other ratings. This point is
discussed later when correlation of ratings
is
examined. The results of a s e r i e s of experiments investigating horizontal slats a r e given in Table IV. In this s e r i e s speaker A was used, no ceiling was installed, the r e - flecting surface measured 1.22 m wide by 2.13 m high and was 0.9 m from the edge of the b a r r i e r screen. The slats were constructed of 5-mm plywood and were mounted s o that any reflected sound would tend t o be di-rected upward. The bare slats did not reduce reflec- tions. The addition to the slats of a layer of glass fi- b e r gave some improvement, but there was s t i l l a con-
siderable amount of reflected sound compared to the no- wall case.
The effect of varying the gap between the edge of the screen and the vertical reflecting surface can be found in Table V. Clearly, the smaller the gap the l e s s sound reflected around the screen. This suggests that a more effective means of dealing with reflections from windows o r walls is simply to use screens shaped to fit closely against them, and to accept the constraints this arrangement places on layout. By extension, this r e - sult also implies that the gap between the bottom of the screen and the floor should be eliminated o r kept very small; otherwise reflections under the screen will sim- ilarly reduce the privacy between work zones.
Tables
JII
and IV show that the application of a layer of glass fiber is an adequate method of dealing with r e - flections from walls, columns, o r large vertical furni- ture surfaces. Any alternative material should be at leastas
'absorbent. As many carpets do not have high absorption coefficients, wall carpets intended t o reduce sound reflection must be carefully chosen.IV. REFLECTIONS FROM CEILING SYSTEMS
A. Ceiling measurements
It is well established that the most important compo- nent in an open office is the ceiling system. Speech sounds a r e always able to reflect from the ceiling to ad- jacent work positions. For this reason the greatest part of the testing associated with open-plan offices has been done on ceiling systems. Invariably measurements a r e made a t a height of 1.22 m (4 ft) from the floor to simulate seated speaker and listener. The screen height used
is
generally 1.52 m (5 ft).The height differential of 0.3 m (1 ft) between the measurement axis and the top of the screen produces a fixed amount of attenuation between work stations main- ly owing to diffraction over the top of the screen. For a typical open-office arrangement this amounts to about
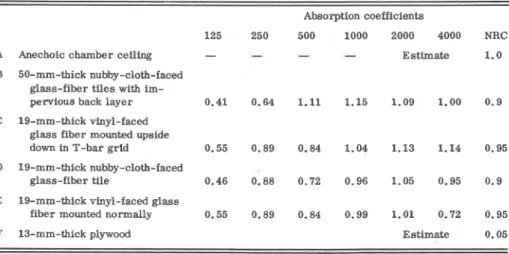
TABLE VI. Description of ceiling samples tested. The absorption coefficients were obtained according to ASTM C 423" on a No. 7 mounting.
A Anechoic chamber ceiling B 50-mm-thick nubby-cloth-faced
glass-fiber tiles with im- pervious back layer C 19-mm-thick vinyl-faced
g l a s s fiber mounted upside down in T-bar grld
D 19-mm-thick nubby-cloth-faced glass-fiber tile
E 19-mm-thick vinyl-faced g l a s s fiber mounted normally
F 13-mm-thick plywood Absorption coefficients 125 250 500 1000 2000 4000 NRC
-
-
-
-
Estimate 1 . 0 0.55 0.89 0.W 0 . 9 9 1.01 0.72 0.95 Estimate 0.05836 A. C. C. Warnock: Acoustical parameters in open-plan offices
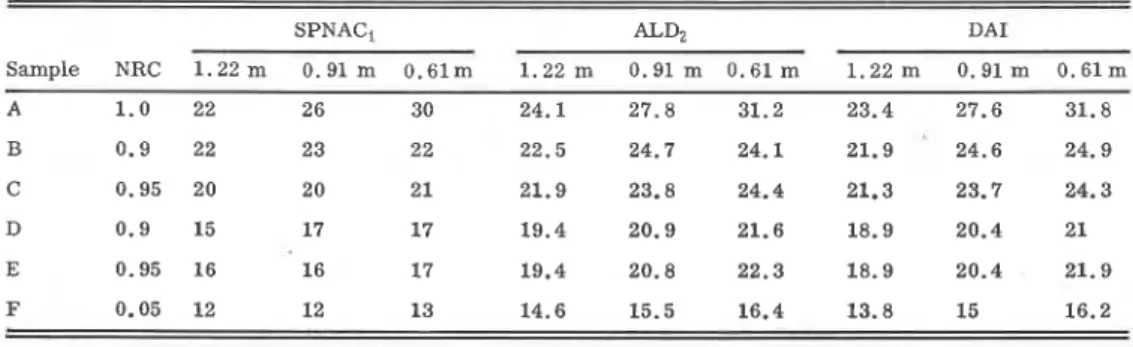
TABLE VII. Measured single-figure ratings obtained using six ceiling samples, A-F
SPNACi m D 2 DAI
Sample NRC 1 . 2 2 m 0 . 9 1 m 0.61m 1 . 2 2 m 0 . 9 1 m 0 . 6 1 m 1 . 2 2 m 0 . 9 1 m 0.61m
20 &A for a pink-noise signal. When ceilings under test reflect l e s s sound than that diffracted around the screen, then the test is not capable of differentiating be- tween such ceilings. This situation can be improved by reducing the diffracted sound by either increasing the height of the screen o r lowering the axis of measure- ment.
To examine the effects of this change, six samples of ceiling tile were tested using speaker B and a 3.66-m- wide screen extending the full width of the chamber. These ceiling samples a r e described in Table
VI.
TableW
lists measured single-figure ratings for the three measuring heights used.The expected behavior of the single-number ratings was estimated for assumed ceiling reflectivities, con- stant for all frequencies, in the range 0-1. The excess attenuation A due to diffraction was calculated from the expression":
A = 20 loglo [ ( ~ I T N ) ' ~ ~ / tanh(2n~)"]
+
5 dB for N > 0, (2) where N = 2(A+
B-
d ) h , X is the wavelength of sound, d i s the straight-line distance between source and receiver, A+
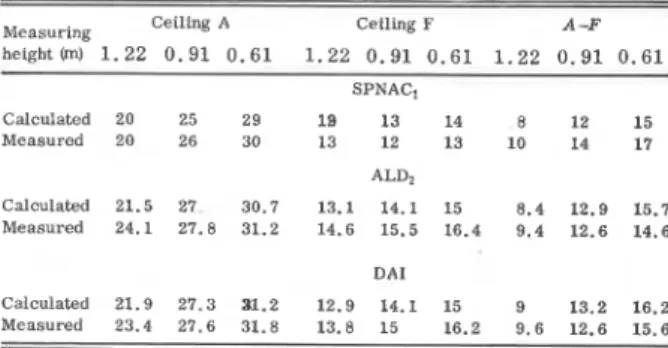
B is the shortest path length of travel over the b a r r i e r between source and receiver.This is an analytical approximation of the experimen- tal data of ~aekawa.'" The calculated diffracted and reflected signals were combined without regard for in- terference effects. It was assumed that this would give adequate information for the purpose of examining the variations with measuring height. Figure 3 illustrates the calculated behavior of the A-weighted level differ- ence for the three measuring heights used. The other ratings exhibit similar behavior. Table VIU compares calculated and measured values and the range in ratings for the two extreme ceiling samples A and F, reflection coefficient 0 and 1. Agreement between prediction and measurement is surprisingly good. As expected, the range in values is greatest for the survey height of 0.6 m, demonstrating that resolution of this type of mea- surement can be increased by an optimum measuring height.
Masking-noise levels in the open office a r e typically about 50 dB A o r less. Higher levels tend to provoke occupant dissatisfaction and because of this limitation a ceiling system must achieve SPNAC, o r ALDl ratings
better than 19 for a survey height of 1.22 m if it
is
to provide acceptable privacy for the office occupants. Figure 3 shows that the average reflection coefficient for such ceilings will be l e s s than 0.2. Consequently,it is in the range of mean reflectivity from 0 to 0.2 that most measurements will be made. Table
M
shows the calculated spread in rating values for this range of r e - flectivity. This suggests that any test with a survey height of 1.22 m (4 ft) and a 1.52-m (5 ft) high screen will probably produce most of i t s test results within a range of 3 dB. With typical confidence limits of*
1 dB, such a test cannot accurately rank o r d e r highly absorb- ing ceiling systems, especially when testing is carried out in different laboratories. Nor can it be relied on to reject ceiling systems, again because of the size of the confidence interval.B. Measurements on light luminaires
Reflections from flat plastic luminaires can seriously reduce interzone attenuation in open offices and it was thought that use of fins to diffuse sound might be
an
im- provement over the flat sheet of plastic. The results presented here a r e for a very limited examination of two prototypes of finned commercial units. For each of the laboratory tests a single luminaire 1.22X0.3 m2 was centered immediately above the screen with its long axis parallel to and directly above the measurement axis.Speaker B was used with a 2.44-m-wide b a r r i e r screen. The ceiling comprised 50-mm-thick cloth-covered glass-fiber boards.
REFLECTION COEFFICIENT
FIG. 3. Predicted behavior of A1D2 for three measuring heights of 0.61, 0.91, and 1.22 m.
837 A. C. C. Warnock: Acoustical parameters in open-plan offices
TABLE VIII. Comparison of calculated and measured ratings
for ceilings A and F , reflection coefficient 0.05 and 1.
Measuring Ceiling A Ceiling F A -F
h e i g h t O 1.22 0.91 0.61 1.22 0.91 0.61 1.22 0.91 0.61 SPNAC, Calculated 20 25 29 18 13 14 8 12 15 Measured 20 26 30 13 12 13 10 14 17 ALD, Calculated 21.5 27 30.7 13.1 14.1 15 8.4 12.9 15.7 Measured 24.1 27.8 31.2 14.6 15.5 16.4 9.4 12.6 14.6 DAI Calculated 21.9 27.3 31.2 12.9 14.1 15 9 13.2 16.2 Measured 23.4 27.6 31.8 13.8 15 16.2 9.6 12.6 15.6
The same luminaires were testedin acompletedoffice using identical prodedures. Here the luminaires were in- stalled in continuous strips 1.22 m apart on a ceiling com- posed of 25-mm-thick cloth-covered glass-fiber boards. The screens used a s b a r r i e r s were 1.83 m high and 5.5 m wide. Measurements were made at a height of 1.22 m from the floor. Two axes of measurement were used, one directly under arow of luminaires andone between rows. For comparison, a row of flat plastic sheets was substitut- ed for the finned luminaires in one measurement.
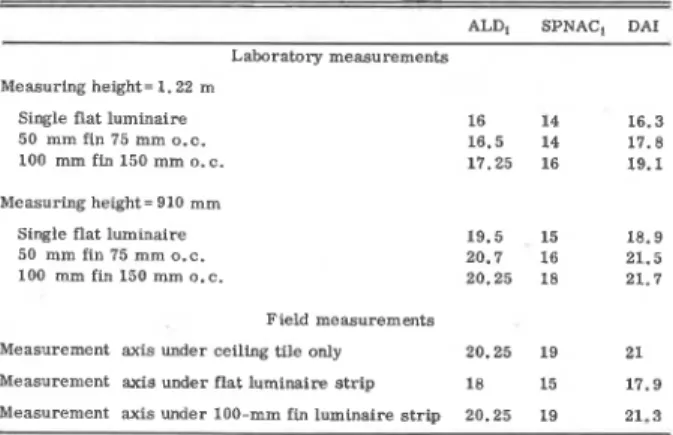
The data a r e presented in Table X and suggest that the finned plastic units can provide useful improvement over the simple flat sheet of plastic. These measurements may be contrasted with those for slatted-window treat- ments, which indicated that s l a t s a r e of no value in r e - ducing specular reflection unless treated with sound-ab- sorbing material. The benefits obtained with the finned luminaires can perhaps be attributed to the narrowness of the reflecting sheets, giving r i s e to beneficial dif- fractive effects.
VI. SCREEN TESTING
PBS testing procedures5 used to rate ceiling systems and reflecting surfaces a r e also used to evaluate the ef- fectiveness of screens as b a r r i e r s and sound reflectors. As the attenuation provided by the screen is determined by diffraction around it, there is no need to measure r e - peatedly the insertion losses for simple planar screens of similar physical dimensions. They can readily be calculated. It is assumed that the internal structure of the screen attenuates sound to the point where transmis- sion through the body of the screen may be ignored and that reflection under the screen is negligible.
The design of a screen should begin with the specifica- tions of an internal layer to ensure that the screen transmission losses a r e appreciably higher than the maximum expected diffraction losses a t all relevant fre- quencies. This requirement can easily be satisfied by writing a specification in t e r m s of mase/unit a r e a o r sound transmission class.' For example, an internal, impervious layer weighing 2.5 kg/m2 (STC > 20) will be quite adequate for screens up to 1.8 m high. The sound diffracted around the screen can then be predicted from Eq. (2). Even where transmission losses through the screen a r e not high enough, the resulting screen per-
formance can be calculated by combining the diffracted and transmitted signal.
As verification, transmission losses of s i x plane screens were determined according to ASTM E 90." The screens were then tested using speaker B
as the
source of sound and with no ceiling installed in the an- echoic chamber. The expected levels were calculated, taking account of diffraction a t three edges and trans- mission through the body of the screen. Although not strictly applicable, the measured random incidence transmission losses were used for this calculation. No interference effects were considered. Despite these limitations Table XI shows good agreement for mea- sured and predicted ratings.The sound-reflective properties of open-office screens a r e also important. These were estimated by placing a 1.52 X 2 . 44-m2 screen perpendicular to the measuring axis as a barrier. The remaining five screens were placed 0.91 m from the edge of the 1.52 x 2. 44-mz screen, perpendicular to i t s plane and paral- lel to the measuring axis s o
as to reflect sound around
the barrier. The mean interzone attenuations s o ob- tained a r e shown in Table XJI. Absorption coefficients for the screens were also measured in a reverberation room according to ASTM C 423. l1 Noise-reduction co- efficients for each screen a r e listed in Tables .XI and XIT.The data in Table IV show that attenuations obtained with a reflecting surface covered by 50 mm of glass fi- b e r a r e within 1 dB o r s o of those obtained without r e - flector. Experience in testing screens in a reverbera- tion chamber according to ASTM C 423 indicates that for an NRC rating of 0.8, o r better, this is the approximate thickness that must be used on each side of the inner septum. This value of 0.8 is part of a Canadian specifi- cation for screens. All screens with an NRC value of 0.8 o r better in Table XJI achieve within 2 dB the rating for no reflecting screen. Screen 2 has 25 mm of rigid glass-fiber ceiling board on each side of a 3-mm hard- board septum.
In view of these results, i t seems quite adequate to test plane, freestanding screens using E 90 and C 423 rather than the PBS procedures. Good performance in
the open office can be ensured by adequate values of STC and NRC and screens large enough to provide the neces- s a r y diffraction losses.
Diffraction losses a r e determined mainly by the height of the screen, typically 1.52 m in open-plan of
-
fices. Privacy between work a r e a s can be improved byTABLE M. Calculated range in ratings for
reflection coefficient in the range 0-0.2.
Measuring height H in meters
1.22 0.91 0.61
SPNAC, 3 6 8
ALD, 3 . 5 6.5 9.5
D A1 4.2 7.2 10.0
838 A. C. C. Warnock: Acoustical parameters in open-plan offices
TABLE X. Interzone attenuations measured for three diffkrent plastic luminaires (1.22 x 0.3 m)
.
-
ALDl SPNACl DAI
Laboratory measurements Measuring height= 1.22 m
Single flat luminaire 16 14 16.3
50 mm fin 75 mm O.C. 16.5 14 11.8
100 mm fin 150 mm o. c . 17.25 16 19.1
Measuring height = 910 mm Single flat luminaire 50 mm fin 75 mm O.C. 100 mm fin 150 mm O . C .
Field measurements
Measurement axis under ceiling tile only 20.25 19 21
Measurement axis under flat luminaire strip 18 15 17.9
Measurement axis under 100-mm fin luminaire strip 20.25 19 21.3
increasing this height, but the office would no longer be quite s o open visually. It is perhaps worth pointing out that the top 0.3 m o r s o of a 1.8-m-high screen could be transparent s o
as
to restore this visual openness.VII. CORRELATION OF SINGLE-NUMBER DESCRIPTORS
TABLE XII. Measured interzone attenuations for screen in reflecting position.
Screen NRC ALD, SPNAC DAI
1 0.8 20.4 19 20.1
No reflect-
ing screen
--
21.1 19 21.3with the other ratings
is
improved when it is removed, it is the author's opinion that it should not be used in any open-plan office rating procedure. SIL ratings offer no marked advantages over other ratings and merit no fur- t h e r attentionas
a meth0.d of rating open-office compo- nents o r systems.Table XIII shows that DAI correlates well with all rat- ines and. in particular. that the mean standard e r r o r dflestimite for the correlation between DAI and A L D ~ o r NIC is only about 1/3 dB. Even the ALD, rating is as good -
as
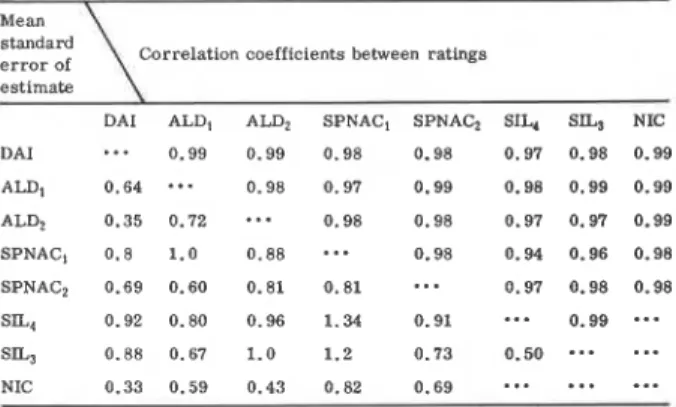
the SPNACz rating and better than the SPNACi The results of correlating all possible pairs of single- (NIC') rating.number ratings listed at the beginning of this paper a r e shown in Table XIIl. The values above the diagonal a r e the correlation coefficients for each pair of ratings. The values below the diagonal a r e the means of the two standard e r r o r s of the estimates obtained for each cor- relation. This gives an indication of the spread of the data about the regression lines.
Comparing the mean standard e r r o r s of the estimates for SPNAC, and SPNAC,, it is clear that the 4-dB limi- tation on individual adverse deviations associated with SPNAC, consistently reduces the degree of agreement with
all
of the other ratings. This 4-dl3 limitation ap- pears to havebeen chosenas
a r e s u l t of halvingthe 8-dB limitation used in the NIC procedures.There seems to be no sound basis for this increased restriction. The limitation is usually related to the bandwidth of the measurements, being 8 dB for one- third-octave bands and 5 dB for octave bands." As this limitation was primarily meant t o deal with coincidence dips i n transmission-loss curves, and
as
correlationThese measurements of A-weighted level differences were taken with two inexpensive loudspeakers that did not have flat frequency responses, and some of the scatter associated with ALDl is caused by the differ- ences between these speakers. It was noted earlier that the SPNAC ratings may indicate that
a
particular surface treatment is ofno
value, whereas the ALD o r DAI rat- ings show an improvement of 1 o r 2 dl3. In some cases part of this differenceis
due to the 4-dB maximum ad- v e r s e deviation limitation. In others, the difference a r i s e s because of the restricted frequency range usedby the SPNAC rating (400-2000 Hz) compared with that of the ALD and DAI ratings.VIII. MASKING-NOISE DESCRIPTORS
Masking-sound systems a r e widely used in open-plan offices. The properties of immediate interest a r e the level, loudness o r subjective acceptability of the sound, and i t s efficiency
as
a speech masker. PBS-c.z5 con- tains a method of rating masking noises by fitting theTABLE XI. Measured and predicted ratings for screens tested as barriers.
Height Screen (m) 1 1.44 2 1.55 Width (m) 1.52 1.24 ALD, NRC STC meas. pred. 0.8 12 17 17.4 0.67 28 21.2 20 0.9 15 19.1 19.2 0.9 11 15.1 16.4 0.95 20 - 20.1 19.9 SPNAC, DAI
meas. pred. meas. pred.
15 16 16.8 17.7 19 18 20.7 20.4 17 17 19.2 19.8 13 15 15.3 16.5 18 18 20.7 20.4 21 19 21.6 21.3
839 A. C. C. Warnock: Acoustical parameters in open-plan offices
TABLE XIII. Correlation between ratings. Values above the diagonal are correlation coefficients; values below a r e means of the two standard e r r o r s foreachcorrelation(80experiments, average of 2.44-3.96 m (8-13 ft) values used in calculations).
orrelation coefficients between ratings
DAI ALD, ALD, SPNAC, SPNACz 5 1 4 SILJ NIC DAI "' 0.99 0.99 0.98 0.98 0.97 0.98 0.99
TABLE XV. Single-figure ratings of noise spectra in Table XlV.
-
A-
Spectrum weighted Loudness
number level NC40 SIL4 SIL3 DAI (phons)
1 48.2 ' 3 41.7 38.3 28.2 61.8 2 47.8 2 43.2 40.7 32.7 62.2 3 48 1 4 3 . 8 42.3 32.1 61.9 4 47.9 1 43.1 4 0 . 5 3 2 . 3 61.6 ALDl 0.64 0.98 0.97 0.99 0.98 0.99 0.99 47.9 0 43.8 4 2 . 4 35.4 60.5 6 4 8 . 2 0 43.8 41.6 32.4 60.7 ALD, 0.35 0.72
---
0.98 0.98 0.97 0.97 0.99 4 7 . 8 2 43 40.8 31.4 62.1 SPNAC, 0.8 1.0 0.88---
0.98 0.94 0.96 0.98 8 48.2 - 1 43.9 43.4 32 59.7 SPNAC, 0.69 0.60 0.81 0.81---
0.97 0.98 0.98 9 48 3 43.2 41 29.8 62.6 SIL, 0.92 0.80 0.96 1.34 0.91 - - a 0.99 "' SIL, 0.88 0.67 1.0 1.2 0.73 0.50 N IC 0.33 0.59 0.43 0.82 0.69 "' "' "'ing. All a r e better than the A-weighted level, which
does not differentiate between spectra.
spectrum to an NC 40 contour. This is essentially the same
as
one of the methods used by Klumpp and Web- ster,13 and was shown to be not s o effectiveas
Speech Interference Level o r Articulation Index methods of r a t - ing. The NC 40 method of rating background noise was compared with others by examining the ratings produced for nine masking-noise spectra covering the gamut of those likely to be used in open-plan offices. Table XIV lists the one-third-o'ctave-band levels in each of the nine spectra, all of which had essentially the same A-weighted level (48
*
0.5 dB A). The other descriptors were SIL,, SIL,, and DAI, and were applied to noise lev- els rather than measured attenuations. Table XV lists the calculated single-figure ratings of the nine spectra, including loudness, calculated according to ANSI S 3.4-1968. l4
With DAI
as
the reference criterion, Fig. 4 shows the correlation between it and SIL,, SILS, andthe NC 40 rat-TABLE xlV. One-third-octave-band levels of noise spectra examined for masking effectiveness.
Frequency (Hz) Spectrum number 1 2 3 4 5 6 7 8 9 61 55.5 49.5 55.5 44 51.5 56.5 41.5 57 58.5 54.5 48.5 53.5 44 50.5 54.5 41.5 55 56 53 47.5 52.5 44 49.5 52.5 41.5 53 54 51 46.5 50.5 44 48.5 50.5 41.5 51 51.5 49.5 45.5 49.5 44 47.5 48.5 41.5 49 49 48 44.5 47.5 43.5 46.5 46.5 41 47 47 45.5 43.5 46 43.5 45.5 44.5 40.5 45 44.5 43 42.5 44.5 43 44.5 43.5 40.5 43 43 42 41.5 42.5 43 43.5 42.5 40.5 41 39.5 41 40.5 41.5 42 42.5 40.5 40.5 39 36.5 38.5 39.5 39.5 41 40.5 39.5 40.5 38 35 38 38.5 37.5 40 39.5 37.5 41 36 33 36 37.5 36 38 38 36 39.5 35 30.5 33 36.5 33.5 36 35 33.5 38.5 35 29 32.5 35.5 31.5 34 32.5 32.5 37.5 34 26 31 34.5 30 32 30 30.5 35.5 34 24 29 33.5 27.5 31 26.5 29.5 31.5 33 22 28 32.5 25.5 28 22.5 29.5 29 32 19 25.5 31.5 23.5 26 19.5 28.5 26.5 32 17 23.5 30.5 21.5 24 14.5 28.5 20.5 31 14 22 29.5 19.5 20 9.5 27.5 15.5 30
Neither NC 40 nor SIL, is really a satisfactory mea- s u r e of masking efficiency. It can be seen that SIL, is
slightly superior to the other two, but it
is
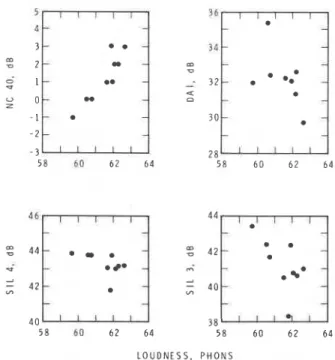
rather insen- sitive to changes in DAI. SIL, was found to be the best of the ratings studies by Klumpp and websterls also. Figure 5 shows the correlation between loudness and.
other ratings. In this case only NC 40 predicts loud- ness reasonably well. The variations in loudness a r e not s o great, however,as
the variations in masking ef- ficiency, and loudness is therefore of l e s s e r impor- tance. It is clear that the NC 40 technique for rating background noise offersno
advantages over other tech-D A I , d B
FIG. 4. Correlation between methods of rating masking-noise efficiency.
A. C. C. Warnock: Acoustical parameters in open-plan offices
L O U D N E S S . P H O N S
FIG. 5. Correlation between masking-noise rating systems and loudness in phonons.
niques easier to use and better known. There seems little justification for continuing its use in the open of- fice.
tX. CONCLUSIONS
Experimental results presented give quantitative e s - timates of the effects of possible treatments of problem reflections in open-plan offices. Analysis of the results shows that the single number ratings, NIC' and NC 40 used in Ref. 5, a r e not s o successful a s simpler, better known descriptors. In particular, A-weighted level differences can be measured using a pink-noise test sig- nal with the loudspeaker frequency response made uni- form by filters, if necessary. Changing from one- third-octave-band measurements to A-weighted level reductions reduces the number of measurements r e - quired and greatly facilitates testing. An extended spa- tial survey, important for complicated systems, would then be relatively easy in either field o r laboratory sit- uations.
In the laboratory the well-known NIC contour can be applied to one-third-octave-band measurements of at- tenuation and good correlation will be obtained with the Articulation Index.
Measurements with a survey height of 1 . 2 2 m (4 ft) a r e quite appropriate if one is concerned with estimat- ing speech privacy in a proposed office system. If the aim, however, is to produce a standardized test of this type that will accurately rank-order ceiling assemblies, then the amount of sound diffracted over the b a r r i e r screen should be reduced by lowering the height at which measurements a r e made.
ACKNOWLEDGMENT
This paper is a contribution from the Division of Building Research, National Research Council of Canada and is published with the approval of the Director of the Division.
' " ~ m e r i c a n National Standard Methods for the Calculation of the Articulation Index. "ANSI S3.5 (1969).
'N. T. Bowman, "The Articulation Index and Its Application
to Room Acoustics Design," J. Sound Vib. 32, 109-129 (1974).
3 ~ . C. Webster, and R. G. Klumpp, "Articulation Index and Average Curve-Fitting Methods of Predicting Speech Inter- ference, " J. Acoust. Soc. Am. 36, 1339-1344 (1963).
4 ~W. Young, "Re-Vision of the Speech-Privacy Calcula- .
tion," J. Acoust. Soc. Am. 38, 524-530 (1965).
5 ~ e t h o d of T e s t PBS-C. 2, Public Buildings Service, General Services Administration, Washington, DC 20405.
6"~etermination of Sound Transmission Class," ASTM E 413, Am. Soc. Test. Mater., 1916 Race St., Philadelphia, PA 19103.
' ~ o i s e and Vibration Control, edited by L. L. Beranek (McGraw-
Hill, New York, 1971), p. 175.
'2. Maekawa, "Noise Reduction by Screens," Mem. Fac. Eng. Kobe Univ. 11, 29-53 (1965).
'z.
Maekawa, "Noise Reduction by Screens of Finite Size," Mem. Fac. Eng. Kobe Univ. 12, 1-12 (1966).l o " ~ a b o r a t o r y Measurement of Airborne Sound Transmission Loss of Building Partitions," ASTM E 90, Am. Soc. Test. Mater., 1916 Race St., Philadelphia, PA 19103.
ll"~ound Absorption of Acoustical Materials in Reverberation Rooms," A m M C 423.
1Z'6~ating of Sound Insulation for Dwellings, " IS0 Recommenda- tion R717, p. 6.
1 3 ~ . G. Klumpp and J. C. Webster, "Physical Measurements
of Equally Speech-Interfering Navy Noises,
"
J. Acoust. Soc.Am. 86, 1328-1338 (1963).
14"~merican National Standard Method for the Computation of
the Loudness of Noise," ANSI S3.4-1968.
![Amplitude analysis of B0→K+π-π0 [B superscript 0 →K superscript + pi superscript - pi superscript 0] and evidence of direct CP violation in B→K*π [B → K superscript asterisk pi] decays](data:image/gif;base64,R0lGODlhAQABAIAAAP///wAAACH5BAEAAAAALAAAAAABAAEAAAICRAEAOw==)