Chemically driven carbon-nanotube-guided thermopower waves
The MIT Faculty has made this article openly available.
Please share
how this access benefits you. Your story matters.
Citation
Choi, Wonjoon et al. “Chemically Driven Carbon-nanotube-guided
Thermopower Waves.” Nature Materials 9.5 (2010): 423–429.
As Published
http://dx.doi.org/10.1038/nmat2714
Publisher
Nature Publishing Group
Version
Author's final manuscript
Citable link
http://hdl.handle.net/1721.1/74064
Terms of Use
Article is made available in accordance with the publisher's
policy and may be subject to US copyright law. Please refer to the
publisher's site for terms of use.
Chemically Driven Carbon Nanotube‐Guided Thermopower Waves
Wonjoon Choi 1,2, Seunghyun Hong 3, Joel T. Abrahamson 1, Jae‐Hee Han 1, Changsik Song 1 , Nitish Nair 1, Seunghyun Baik 3, Michael S. Strano 1*
1 – Department of Chemical Engineering, Massachusetts Institute of Technology, Cambridge, MA, 02139, USA 2 – Department of Mechanical Engineering, Massachusetts Institute of Technology, Cambridge, MA, 02139, USA 3 – SKKU Advanced Institute of Nanotechnology, Department of Energy Science and School of Mechanical Engineering, Sungkyunkwan University, Gyeonggi, 440‐746, Korea *e‐mail : [email protected] Correspondence should be addressed to M. S. S. Theoretical calculations predict that by coupling an exothermic chemical reaction with a nanotube or nanowire possessing a high axial thermal conductivity, a self‐propagating reactive wave can be driven along its length. Herein, such waves are realized using a 7‐nm cyclotrimethylene‐trinitramine annular shell around a multi‐walled carbon nanotube and are amplified by more than 104 times the bulk value, propagating more than 2 m/s, with an effective thermal conductivity of 1.28 ± 0.2 kW/m/K at 2860 K. This wave produces a concomitant electrical pulse of disproportionately high specific power, as large as 7 kW/kg, that we identify as a thermopower wave. Thermally excited carriers flow in the direction of the propagating reaction with specific power that scales inversely with system size. The reaction also evolves an anisotropic pressure wave of high total impulse per mass (300 N‐s/kg). Such waves of high power density may find uses as unique energy sources.
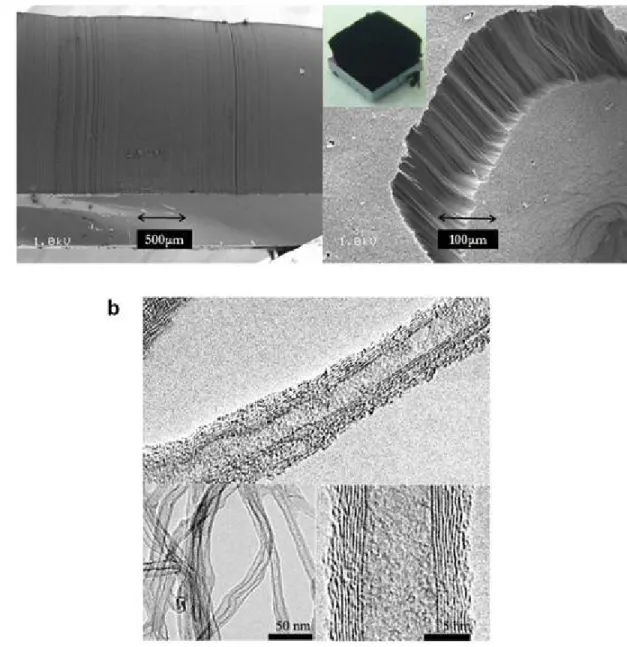
Introduction The classical theory of heat conduction predicts that self‐propagating chemical waves are possible when a non‐linear source term, activated by temperature, is coupled to an exothermic reactive material that is also the heat conductor. The resulting wave velocity that radiates isotropically is known to vary exponentially with the inverse adiabatic reaction temperature 1, a fundamental material property. Such waves were first studied theoretically in 1938 by Zel’dovich and Frank‐ Kamenetskii 2, and experimentally verified for a wide range of technological applications, such as propulsion 3, chemical synthesis 4 and combustion 5. The emergence of nanotube and nanowire systems, where phonons are quantum confined and scattering processes are minimized, has resulted in observations of axial thermal conductivity that are exceedingly high 6. The properties of such systems are surprisingly invariant to mechanical deformation 7, even showing thermal rectification for anisotropically loaded specimens 8. The question of how such systems support or modify a neighboring reaction wave has thus far been unexplored. It is known, for example, that only the thermal conductivity in the vicinity of the narrow reaction zone contributes to wave propagation 9. If the phonon mean free path becomes commensurate with the length of this zone, a possibility for many one dimensional nanotube systems, an enormous acceleration of the reactive wave may result. In this work, we demonstrate the existence of such accelerated thermal waves and introduce a new phenomenon that results from their effect on carrier propagation, namely concomitant thermopower waves that yield a substantial specific power from a micro‐ or nano‐scale source. We verify the existence of such waves experimentally by creating both isolated and aligned arrays of multi‐walled carbon nanotubes (MWNT) encased in a 7‐nm‐thick cyclotrimethylene‐trinitramine
(TNA) annular coating (Fig. 1a). The synthesis procedure is based on a wet impregnation of a 90‐ mM TNA in acetonitrile solution into pre‐synthesized vertically aligned MWNT arrays. The arrays were synthesized by ethylene chemical vapor deposition at 750 ºC on silicon dioxide‐silicon wafers using a water‐assisted carbon etching as described elsewhere 10. The free standing films have high porosity (95‐99%) and are able to incorporate about 3 to 45 times TNA by mass (see Supplementary Fig. S1). A subsequent sodium azide (NaN3)/water solution applied after wet impregnation allowed for facile initiation after drying for 24 hours at ambient temperature and pressure. Scanning electron microscopy (see Supplementary Fig. S3) shows that the alignment is preserved after wet impregnation. Transmission electron microscopy (Fig. 1b) indicates annular coatings of TNA crystals between 6 to 9 nm in thickness wrapping MWNTs of approximately 22 nm in diameter with an average of 10 walls. Alternate growth conditions (see Supplementary Fig. S2) produce 13‐nm‐diameter MWNTs with an average of nine walls, also explored in this work. The TNA coatings were uniform, although larger crystallites with defined grain boundaries were frequently visible along the side‐walls of MWNTs, as shown in Fig. 1b, from homogeneous crystallization in the bulk impregnation solution before adsorption to the nanotubes. The x‐ray diffraction (Fig. 1c, see Supplementary Fig. S4) spectra show that both the crystal structures of the bulk MWNT array and the TNA are preserved in the composite, with little evidence of organic intercalation 11‐13. The diffraction peak at 26o (002) corresponds to a typical inter‐planar spacing of graphite (0.34 nm), and 42.4o (100) yields a 2.12 nm distance between neighboring nanotubes 14‐16.
Two methods were used for initiating reactive waves in this system: laser irradiation and high voltage electrical discharge. The TNA‐MWNT structures were either preheated or left at 300 K before ignition, and the reaction propagation and its velocity were measured by using a
microscope‐aligned optical fiber array (see Supplementary Fig. S5) and high speed video microscopy (up to 90000 frames/sec) (see Supplementary Fig. S6), respectively, as shown in Fig. 2a. Sustained reaction waves specifically along the direction of the nanotube orientation (Fig. 2a, inset) were observed at velocities more than four orders of magnitude larger than the bulk combustion rate of TNA of 0.2 – 0.5 mm/s 17‐20 at an atmospheric condition (1 atm). Several control materials confirm that the reaction wave requires the aligned nanotubes and TNA. Randomly oriented arrays, or those lacking TNA or NaN3, showed no such sustained reaction in any direction under any condition. In the example in Fig. 2a, the aligned TNA‐MWNT produced a steadily propagating wave with velocity 1.2 ± 0.4 m/s along the nanotube length. The MWNT generally survive the propagation of the wave intact, consistent with the high temperature stability of MWNT observed up to 3800 K21,22. To confirm that the mechanism of amplification involves the nanotube specifically as a thermal conduit, the reaction velocity dependence on preheating temperature (Fig. 2b) was measured both in parallel and orthogonal directions to the nanotube alignment. Both orientations demonstrated an increase in reaction velocity with increasing preheat temperature, but in the parallel orientation, where the external heat directly supplements that supplied by the reactive wave, the enhancement is nearly 10 times faster than the orthogonal orientation. The results from several velocity measurements are plotted in Fig. 2c for comparison. We found that 22‐nm (10 walls) MWNT amplified the reaction velocity by more than 10000 times, while for 13‐nm (9 walls) MWNT the enhancement was about 1000 times the TNA value. The difference is greater than what is predicted by the factor of 3 larger cross‐ sectional area of the 22‐nm MWNT. A lower degree of alignment and higher quantity of amorphous carbon generated during synthesis of the 13‐nm samples compared to the 22‐nm samples accounts for apparent differences in conductances (see Supplementary Fig. S2).
Experimental geometries and a histogram of reaction front velocities for 92 devices appear in Supplementary Information (see Supplementary Fig. S7). We adapt the theory of conventional combustion waves to describe the nanotube‐coupled thermal wave. Consider a first order reactive annulus at dimensionless temperature u surrounding a nanotube or nanowire (Fig. 1a) at temperature u2 where both are thermally coupled via a dimensionless interfacial conductance, . The Fourier description of this system is:
1
2
/ 1 2 2 1 e u u u u u (1)
2
2 2 2 2 0 2u
u
u
u
(2)
1/u e 1
(3)
where is the extent of chemical conversion of the reactive annulus, is the dimensionless
thermal diffusivity of the nanotube (normalized by that of the annulus), is the dimensionless inverse adiabatic temperature of the reactive annulus, and are dimensionless time and distance. (Here, 1 and 2 are scaled by material properties of the annulus and nanotube,
respectively.) A system initially at room temperature (uatm = u = 0.0124 for TNA) will produce a
reactive wave solution if one end is heated to ignition. Numerical solution of (1‐3) demonstrates that, since the thermal conductance in the nanotube exceeds that of the reactive annulus, the reaction velocity along the nanotube component is increased substantially, directing the energy along its length. The interfacial conductance becomes insignificant beyond a minimum threshold (1 > 10‐3, 2 > 10‐2 for > 5) above which heat exchange between the phases is not rate‐limiting
would be very small, and rapid thermal equilibrium is achieved on the boundary in the narrow reaction zone between the two materials (T T2). Under these conditions, higher interfacial conductance cannot change the temperature profile. The non‐linear nature of the source term causes the reaction velocity to increase disproportionately with an increase in nanotube thermal diffusivity above that of the reactive annulus, creating an amplified thermal wave, as shown in Fig. 2c. The numerical solution of Fig.2c can be used in conjunction with the measured reaction velocities to estimate the effective thermal conductances of the MWNT. We find these values to be high, on average 2.1 ± 0.32 x 10‐10 W/K for 22‐nm‐diameter MWNT. The value for 13‐nm‐ diameter MWNT is 2.7 ± 1.0 x 10‐11 W/K. For comparison, this is equivalent to a value of about 1,280 ± 200 W/m/K for an effective thermal conductivity of a 22‐nm‐diameter MWNT of height 2.36 mm (using the total MWNT cross section, including interior void space). The corresponding cross‐sectional conductance, 4.5 x 10⁵ W/m2/K, is substantial, but only 0.01% of the theoretical upper bound of 109 – 1010 W/m2/K over the range of 300 to 1000 K estimated by quantum constraints 23. If the temperature dependence is included for thermal conductivities 24,25, heat capacities 19,26 and thermochemical properties 17,26‐28, one can predict the reaction velocity explicitly. This refined model predicts 1.3 m/s for the wave velocity, in agreement with what is observed experimentally. We find that this directional thermal wave evolves a corresponding thermopower wave in the same direction, creating a high specific power electrical pulse of constant polarity. The nanotubes were contacted to an oscilloscope with Cu wires and an Ag paste in the arrangement shown in Fig. 3a. Laser initiation at one end resulted in a voltage oscillation peak (see Supplementary Fig. S8) of the same duration as the corresponding reaction wave, allowing us to calculate reaction
propagation velocity for the whole sample volume (see Supplementary Fig. S9). The voltage was positive for waves emanating from the positive electrode, indicating a pulse of majority electronic carriers traveling toward the negative electrode (Fig. 3b). This thermopower wave is distinct from conventional, static thermopower in that we see single polarity pulses (positive or negative) over the reaction duration for high velocity waves. A moving thermal gradient across the conductor would produce regions of maximum, minimum and zero voltages based on the Seebeck effect, for example. This is in fact what we observe for samples with larger thermal mass and slower propagation velocities. Also, if the reaction is initiated at the middle of the sample, the current appears to reverse (Fig. 3c). In contrast, the chemically driven thermopower waves in the high velocity regime (Fig. 3b) have constant polarity always in the direction of the reaction. The results suggest that the wave traverses the system faster than the cooling time of the posterior region, resulting in a highly efficient energy direction. Carbon nanotubes have a relatively low Seebeck coefficient (80 V/K) 29 compared with many thermoelectric materials, such as bismuth telluride (287 V/K) 30 or Bi2Te3/Sb2Te3 superlattices (243 V/K) 31, although modest increases are observed
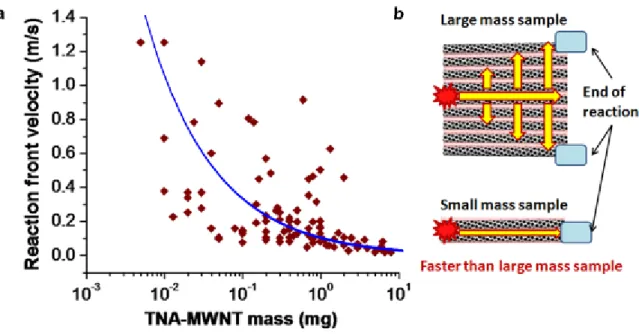
over the temperature range of 300 K and 930 K 32. Thermopower waves, however, do not necessarily require low phonon and high electron transport rates as the thermal gradient is preserved in the propagation of the wave front. We note that materials with low figures of merit for thermoelectric devices can still produce high efficiencies for guiding thermopower waves, motivating a re‐examination of these materials for thermal to electrical energy conversion. Examining the specific power as a function of sample mass (Fig. 3d) for 115 devices demonstrates a significant sample‐to‐sample variation, mostly due to differences in reaction velocities. However, the maximum values observed exceed 7 kW/kg, and are substantially larger than those
for even high performance Li‐ion batteries that have much slower discharge rates. Moreover, these high specific power values were observed as the sample mass decreased, a scaling trend that is very favorable for powering micro‐ and nano‐scale devices. One explanation for this trend is that since all the samples had similar lengths (between 3 and 6 mm), a larger sample mass corresponds to a larger cross‐sectional area and, therefore, increased orthogonal heat propagation that would eventually cause an overall system loss in an anisotropic reaction velocity (see Supplementary Fig. S9). To illustrate this further, high speed video microscopy was used in Fig. 4a to map the reaction front velocities as a function of orientation angle from the initiation point for an array of relatively large mass. Along the zero‐degree axis (parallel to the nanotube orientation), the reaction propagates 6 to 13 times faster than in the orthogonal direction. As the number of parallel nanotubes in the array increase with mass, a greater fraction of heat travels orthogonal to the wave propagation, slowing its velocity and reducing the specific power (see Supplementary Fig. S9). The scaling trend is somewhat predicted by accounting for the change in reaction velocity with the system size and using a conventional thermopower model. In this case the specific power P/Mt is: (4) where S is the Seebeck coefficient of nanotubes, Ri is electrical resistance, ρ is the density of the nanotubes, r is the radius of the nanotubes, L is the conduction length, and T is spatially defined temperature (Fig. 3d). A large mass sample generates a slower reaction velocity due to orthogonal heat dissipation. The temperature at the initial reaction position is related to the cooling time and the velocity of thermal wave. A relatively fast cooling time with a slow reaction
L i tdL
dL
dT
L
r
R
S
M
P
0 2 2
velocity causes a reverse temperature gradient and a diminution of specific power in the direction of wave propagation. While predicting the general trend with system mass, we note that this model under‐predicts the observed specific power by as much as 3000 W/kg in some cases. Hence, the nature of the induced thermopower current requires further study. There is an extensive literature on enhanced electron‐phonon coupling in 1D‐confined systems such as carbon nanotubes. This coupling manifests itself, for example, in the induction of electrical current with polar fluid flow over an array of CNTs 33, and negative differential conductance 34. The thermopower waves, studied in this work for the first time, seem to propagate at only 0.0002% of a typical Fermi velocity. However, it is possible that the moving thermal gradient can entrain carriers such that a net drift velocity is measurable, and confine charge carriers in a narrow region of the reaction front. The nature of this supplemental power generation will be the subject of further research efforts. In addition to the thermopower wave, the reaction creates a measurable pressure wave that is also of high energy density. The rapidly expanding, gaseous decomposition products from the thermal wave create a strong pressure pulse that is highly anisotropic. We measured the thrust force of this pressure wave using a micro‐force sensor configuration (see Supplementary Fig. S13) to be substantially higher per total propulsion system mass than many other comparable micro‐ thrust generators in the literature 35‐40. The MWNT array was placed either normal or parallel to the force sensor surface, and immobilized in both directions during testing. Figure 4b illustrates the anisotropic nature of the thrust force. When perpendicular, the force peaks between 20 to 55
mN with a weak dependence on TNA loading, but in the parallel direction, the force was significantly reduced (< 9 mN). The relatively long duration reaction was obtained with TNA:MWNT mass ratio of 42 (max 47 mN, 175 ms duration) and 23 (max 35 mN, 200 ms duration). A reduction in loading ratio to 18 resulted in a larger peak thrust force (57 mN) for a shorter duration (110 ms). A smaller force is evolved (23 to 29 mN) as the ratio is further reduced to 5, but the reaction duration remains similar. The thrust reaches an optimal value at intermediate loading (loading ratio of 18) since increasing mass beyond this point increases the orthogonal heat transfer requirement. The broader line‐shape of the reaction curves for loading ratios of 23 and 42 supports this. The magnitude of the evolved thrust per unit mass is extremely large in comparison to all other solid propellant microthrusters 35,40. A free body experiment illustrates the directional nature of the evolved force (Fig. 4c). In this experiment, the system was released after initiation of the reaction, and its motion was recorded with a synchronized high speed camera. The instantaneous trajectory was compared with the orientation of the MWNT array at each frame, confirming the directional nature of the propulsion. It is an intrinsic property of this material that the thrust is evolved along a single axis, a property not yet realized in any other system. We compare the TNA‐MWNT system to other published micro‐thrusters with respect to the total and specific impulse per mass ratio (Fig. 4d) since these are the figures of merit for micro‐ or nano‐ scale actuator systems. Electrokinetic, ferromagnetic, laser ablation jet, and other systems 36,37,39 require bulky housings to direct and channel thrust, and thus have impulse per mass values many orders of magnitude less than the TNA‐MWNT system. The total impulse per mass of TNA‐MWNT (300 N‐s/kg) is 4 to 100 times of that of other proposed micro‐thrusters. The specific impulse per total mass (5.5 s/µg) is over 10 times that of typical solid propellant micro‐thrusters 35,37,38,40.
The largest chemical to electrical and mechanical energy efficiencies observed in this work are 0.3 % and 0.12 % respectively, with the highest efficiency considering both as 0.42 %. The Carnot limit, set by the reaction temperature under adiabatic conditions, is a maximum of 80%. At the high decomposition temperatures explored in this work, the dominant parasitic heat loss is radiative. Engineering controls to prevent radiative losses may increase the efficiencies closer to this limit. In summary, we have generated and measured anisotropic thermopower waves for the first time. These waves are produced by coupling an exothermic decomposition reaction of TNA to heat transfer in a MWNT conduit with high thermal conductivities calculated effectively to be 1.28 ± 0.2 kW/m/K in the range of 300 to 2860 K. The conduit accelerates the reaction along its length, creating a unidirectional thermal wave that is up to 10000 times faster than the bulk. This thermal wave also drives a thermopower wave, and we show that this results in high power densities up to 7 kW/kg, larger than Li‐ion battery technology. This high specific power is seen in the limit of the smallest mass samples. The thermal wave is accompanied by a pressure wave of decomposing reaction products, resulting in exceedingly high total impulse per mass of 300 N‐s/kg and specific impulse per total mass (5.5 s/µg). These systems represent a new class of single‐use power sources for MEMS and NEMS applications, with very large power densities.
Figure legends
Figure 1 | Schematic of an exothermic chemical reaction guided along a thermally conducting CNT and experimental realization of MWNT encapsulated by cyclotrimethylene trinitramine (TNA). a, Ignition at one end of TNA‐CNT results in an exothermic reaction and heat transfer along the length of the CNT, with feedback creating an anisotropic reaction wave of amplified velocity. b,
Transmission electron microscopy image of TNA‐MWNT synthesized by wet impregnation. The dashed line indicates the boundary between MWNT and TNA layers. c, X‐ray diffraction showing TNA‐MWNT after synthesis (black), MWNT only (blue) and TNA only (red). Figure 2 | An accelerated, anisotropic reaction wave of TNA confined to an annular region around a nanotube thermal waveguide. a,
Reaction propagation along an aligned MWNT array (average diameter 22 nm) after ignition by electrical discharge (no preheating). The height of the TNA‐MWNT array is ~2 mm, and its cross‐section is about 0.1 mm2 (frame rate = 3.33 kHz). b, Thereaction velocity differs between samples preheated parallel and orthogonal to the aligned direction (average MWNT diameter 13 nm) as measured with an optical fiber array along the array length (see Supplementary Fig. S5). The x‐axis shows the preheating temperature of the TNA‐ MWNT array (Table S1). c,
Predicted reaction velocity from the Fourier model (equations 1‐3) as
a function of the dimensionless inverse adiabatic temperature of the annular material (10.6 for TNA, Table S2) versus CNT thermal diffusivity (m2/s). Note that the reaction velocity increases with increasing CNT thermal conductance. Experimentally observed reaction velocities for both 13‐ and 22‐nm MWNT are plotted for comparison.Figure 3
| A c
hemically driven thermopower wave.a, Illustration of the experimental setup used
for measuring the corresponding thermopower waves that result from reaction wave propagation. Laser ignition (or electric arc discharge) at one end results in a thermopower wave in the same direction of reaction propagation; either positive or negative voltage generation is observed. b, The DC voltage generated by exothermic reaction of TNA is observed immediately after laser ignition with a single polarity peak voltage in this experiment of 30 – 35 mV (max observed = 210 mV) in both positive and negative directions for a total system mass of 0.8 mg with a TNA/MWNT ratio of 9. c, These thermopower waves appear distinct from conventional, static thermopower generation mechanisms. If the system mass is increased, the reaction wave moves slowly and multiple peaks are observed instead, showing a reversal of polarity and an inflection point. Similar behavior is seen if initiation occurs at the center of the sample. d, The specific peak power plotted as a function of system mass for three different TNA/MWNT mass ratios (9, 4.5, and 2.8) and two different MWNT with diameters (13 and 22 nm) shows an inverse scaling, highlighting that the thermopower wave is enhanced at the micro‐nanoscale, and can produce power densities that far exceed conventional energy storage devices. The green line is equation 4 based on the conventional thermoelectric effect and the temperature gradient from reaction (300 K‐2800 K).
Figure 4 |
Anisotropic reaction propagation.
a, For larger samples, there remains a large axial
along the aligned (0o) and orthogonal (90o) directions show a discernable peak along the axial direction. (Reactions were initiated at the base.) Parenthetical numbers are the mass ratio and mass of TNA. b, The thermopower wave evolves a thrust force of commensurate duration. The transient force response is larger for the 5 samples (5 x 5 x 6 mm, 5–20 mg) aligned perpendicular to the sensor compared with the control aligned parallel to the surface. c, An illustration of directed thrust: moving as a free body, the TNA‐MWNT array (0.4 x 0.3 x 2 mm) proceeds in the direction of its orientation without external confinement. d, The total impulse and specific impulse per total mass of TNA‐MWNT is significantly higher than other micro‐thruster systems 35‐40 because of the lack of a need for external containment, in contrast to electrokinetic 37,
ferroelectric plasma 39, and laser ablation jet 36 micro‐thruster approaches.
References
1. Please, C. P., Liu, F. & McElwain, D. L. S. Condensed phase combustion travelling waves with sequential exothermic or endothermic reactions. Combust. Theor. Model. 7, 129‐143 (2003). 2. Zel'dovich, Y. B. & Frank‐Kamenetskii, D. A. The theory of thermal flame propagation. Zh. Fiz. Khim. 12, 100‐105 (1938). 3. Roy, G. D., Frolov, S. M., Borisov, A. A. & Netzer, D. W. Pulse detonation propulsion: challenges, current status, and future perspective. Prog. Energ. Combust. 30, 545‐672 (2004). 4. Arimondi, M., Anselmi‐Tamburini, U., Gobetti, A., Munir, Z. A. & Spinolo, G. Chemical mechanism of the Zr+O‐2‐>ZrO2 combustion synthesis reaction. J. Phys. Chem. B 101, 8059‐8068 (1997). 5. Alexander, M. H. et al. Nitramine Propellant Ignition and Combustion Research. Prog. Energ. Combust. 17, 263‐296 (1991). 6. Yu, C. H., Shi, L., Yao, Z., Li, D. Y. & Majumdar, A. Thermal conductance and thermopower of an individual single‐wall carbon nanotube. Nano Lett. 5, 1842‐1846 (2005). 7. Chang, C. W., Okawa, D., Garcia, H., Majumdar, A. & Zettl, A. Nanotube phonon waveguide. Phys. Rev. Lett. 99, 045901‐045904 (2007). 8. Chang, C. W., Okawa, D., Majumdar, A. & Zettl, A. Solid‐state thermal rectifier. Science 314, 1121‐1124 (2006). 9. Akkutlu, I. Y. & Yortsos, Y. C. The dynamics of in‐situ combustion fronts in porous media. Combust. Flame 134, 229‐247 (2003). 10. Hata, K. et al. Water‐assisted highly efficient synthesis of impurity‐free single‐waited carbon nanotubes. Science 306, 1362‐1364 (2004). 11. Prevo, B. G. & Velev, O. D. Controlled, rapid deposition of structured coatings from micro‐ and nanoparticle suspensions. Langmuir 20, 2099‐2107 (2004). 12. Kulkarni, A. M. & Zukoski, C. F. Nanoparticle crystal nucleation: Influence of solution conditions. Langmuir 18, 3090‐3099 (2002). 13. Simchi, A., Ahmadi, R., Reihani, S. M. S. & Mahdavi, A. Kinetics and mechanisms of nanoparticle formation and growth in vapor phase condensation process. Mater. Design 28, 850‐856 (2007). 14. Yusa, H. & Watanuki, T. X‐ray diffraction of multiwalled carbon nanotube under high pressure: Structural durability on static compression. Carbon 43, 519‐523 (2005). 15. Maniwa, Y. et al. Anomaly of X‐ray diffraction profile in single‐walled carbon nanotubes. Jpn. J. Appl. Phys., Part 2 38, L668‐L670 (1999). 16. Cao, A. Y., Xu, C. L., Liang, J., Wu, D. H. & Wei, B. Q. X‐ray diffraction characterization on the alignment degree of carbon nanotubes. Chem. Phys. Lett. 344, 13‐17 (2001). 17. Volkov, E. N., Paletsky, A. A. & Korobeinichev, O. P. RDX flame structure at atmospheric pressure. Combust. Explo. Shock. 44, 43‐54 (2008). 18. Aleksandrov, V. V., Tukhtaev, R. K., Boldyrev, V. V. & Boldyreva, A. V. Mechanism of Catalytic Additive Effects on Diethylnitramine Dinitrate Combustion Rates. Combust. Flame 35, 1‐15 (1979). 19. Homan, B. E., Miller, M. S. & Vanderhoff, J. A. Absorption diagnostics and modeling investigations of RDX flame structure. Combust. Flame 120, 301‐317 (2000).20. Zenin, A. Hmx and Rdx ‐ Combustion Mechanism and Influence on Modern Double‐Base Propellant Combustion. J. Propul. Power 11, 752‐758 (1995). 21. Miyamoto, Y., Berber, S., Yoon, M., Rubio, A. & Tomanek, D. Onset of nanotube decay under extreme thermal and electronic excitations. Physica B 323, 78‐85 (2002). 22. Begtrup, G. E. et al. Probing nanoscale solids at thermal extremes. Physical Review Letters 99, 155901‐155904 (2007). 23. Mingo, N. & Broido, D. A. Carbon nanotube ballistic thermal conductance and its limits. Physical Review Letters 95, 096105‐096108 (2005). 24. Hanson‐Parr, D. M. & Parr, T. P. Thermal properties measurements of solid rocket propellant oxidizers and binder materials as a function of temperature. J. Energetic Mat. 17, 1‐47 (1999). 25. Li, S. C., Williams, F. A. & Margolis, S. B. Effects of 2‐phase flow in a model for nitramine deflagration. Combust. Flame 80, 329‐349 (1990). 26. Liau, Y. C., Kim, E. S. & Yang, V. A comprehensive analysis of laser‐induced ignition of RDX monopropellant. Combust. Flame 126, 1680‐1698 (2001). 27. Oyumi, Y. Melt phase decomposition of RDX and two nitrosamine derivatives. Propell. Explos. Pyrot. 13, 42‐47 (1988). 28. Long, G. T., Vyazovkin, S., Brems, B. A. & Wight, C. A. Competitive vaporization and decomposition of liquid RDX. Journal of Physical Chemistry B 104, 2570‐2574 (2000). 29. Kim, P., Shi, L., Majumdar, A. & McEuen, P. L. Thermal transport measurements of individual multiwalled nanotubes. Phys. Rev. Lett. 8721, 215502‐215505 (2001). 30. Takashiri, M., Takiishi, M., Tanaka, S., Miyazaki, K. & Tsukamoto, H. Thermoelectric properties of n‐type nanocrystalline bismuth‐telluride‐based thin films deposited by flash evaporation. J. Appl. Phys. 101, 074301‐074305 (2007). 31. Venkatasubramanian, R., Siivola, E., Colpitts, T. & O'Quinn, B. Thin‐film thermoelectric devices with high room‐temperature figures of merit. 413, 597‐602 (2001). 32. Zhang, H. L. et al. Electrical and thermal properties of carbon nanotube bulk materials: Experimental studies for the 328‐958 K temperature range. Phys. Rev. B 75, 205407‐ 205415 (2007). 33. Ghosh, S., Sood, A. K. & Kumar, N. Carbon nanotube flow sensors. Science 299, 1042‐1044 (2003). 34. Pop, E. et al. Negative differential conductance and hot phonons in suspended nanotube molecular wires. Physical Review Letters 95, 155505‐155508 (2005). 35. Zhang, K. L., Chou, S. K., Ang, S. S. & Tang, X. S. A MEMS‐based solid propellant microthruster with Au/Ti igniter. Sensors and Actuators A‐Physical 122, 113‐123 (2005). 36. Phipps, C., Luke, J., Lippert, T., Hauer, M. & Wokaun, A. Micropropulsion using a laser ablation jet. J. Propul. Power 20, 1000‐1011 (2004). 37. Patel, K. D. et al. Electrokinetic pumping of liquid propellants for small satellite microthruster applications. Sens. Actuators, B 132, 461‐470 (2008). 38. Kuan, C. K., Chen, G. B. & Chao, Y. C. Development and ground tests of a 100‐millinewton hydrogen peroxide monopropellant microthruster. J. Propul. Power 23, 1313‐1320 (2007). 39. Kemp, M. A. & Kovaleski, S. D. Ferroelectric plasma thruster for microspacecraft propulsion. J. Appl. Phys. 100, 113306‐113311 (2006). 40. Chaalane, A., Rossi, C. & Esteve, D. The formulation and testing of new solid propellant mixture (DB plus x%BP) for a new MEMS‐based microthruster. Sens. Actuators, A 138, 161‐
Acknowledgements
This work was supported primarily by a grant to M. S. S. from the Air Force Office of Scientific Research and from an NSF Career Award also to M. S. S. S. B. appreciates support by WCU (World Class University) program through the Korea Science and Engineering Foundation funded by the Ministry of Education, Science and Technology, Korea (R31‐2008‐000‐10029‐0). J. T. A. and W. J. C. acknowledge fellowship support from the National Science Foundation and ILJU, respectively. J. ‐ H. H. acknowledges support from the Korea Research Foundation (MOEHRD, KRF‐2006‐214‐ D00117). We acknowledge T.M. Swager for help with TNA extraction.Author contributions
W. J. C., M. S. S., and J.‐H. H developed the concept. W. J. C. and S. H. carried out experiments. W. J. C. and J. T. A. conducted modeling and simulations. All authors contributed to data analysis and scientific discussion.a
CNT
TNA layer around carbon nanotube (CNT)
Heat release
Heat release
Ignition
Ignition
b
c
b
c
P
S)
P
S)
20 nm
(C
P
(C
P
20 nm
7 nm
s
ity
(
sity
10 nm
ten
s
ten
s
10 nm
In
t
In
t
16.8 nm
9.4 nm
22 nm
20 nm
20 nm
20 nm
O
O
N
N
N
N
O
O
O
O
+
+
-N
N
N
N
O
O
-N
N
+
N
O
O
+
-O
O
O
O
N
N
N
N
O
O
O
O
+
+
-N
N
N
O
O
N
N
+
-N
O
O
+
-CNT
TNA
CNT
TNA
N
A
MWNT : Multi Walled carbon nanotube
5 0
W
NT
A
TNA
TN
MWNT : Multi-Walled carbon nanotube
TNA : Cyclotrimethylene trinitramine
4 0
M
W
TN
A
T
TNA
y
y
3 0
TNA A
T
2 0
TNA
A
N
T
T
TN
A
A
TNA
2 0
MW
N
T
TNA TN
A
N
A
N
A
TNA
A
A
A
TN
A
TNA
1 0
TN
A
TN
TN
TN
A
T
TN
A
0
MWNT
TNA
TNA
a
b
a
b
2.5
m
m)
TNA/MWNT = 10.35
0
1 2
1 6
3 6
m/s)
2.5
n (
m
0ms
1.2ms
1.6ms
3.6ms
mm
2.0
a
tio
t(
m
1.5
p
ag
a
Scale bar : 2 mm
Alignment of MWNT
ocit
1.5
p
ro
p
TNA/MWNT = 5.5
Scale bar : 2 mm
elo
1.0
m
e
p
0ms
0.6ms
1.4ms
2.2ms
on
0.5
fla
m
act
io
0.5
n
of
Re
a
0.0
itio
n
Bulk TNA X 1000
R
0.0
0.2
0.4
0.6
0.8
1.0
1.2
1.4
1.6
P
os
i
P
Time (ms)
c
35
c
35
30
30
25
a
20
e
ta
β
B
e
15
13 nm diameter
13 nm diameter
2
2
10
5
4
5
10
-5
10
-4
Thermal diffu
CNT Thermal Di
b
− Parallel direction to aligned MWNT
b
800
m/s)
− Perpendicular direction to aligned MWNT
mm
600
ty
(m
ocit
400
velo
on
v
MWNT + TNA
200
act
io
Re
a
0
R
20
40
60
80 100 120 140 160 180 200
0
Temperature (Celsius)
18 35
18 82
19 30
19 3
s
)
9 769
10 02
10 27
10 54
10 81
11.08
11.36
11.66
11.95
12.26
12.57
12.89
13.22
13.56
13.91
14.26
14.62
15.00
15.38
15.77
16.18
16.59
17.01
17.45
17.89
18.35
18.82
19.30
10 8
19.3
/s)
m/
s
5 201
5 334
5 470
5 609
5.753
5.900
6.050
6.205
6.363
6.526
6.692
6.863
7.039
7.218
7.403
7.592
7.786
7.984
8.188
8.397
8.612
8.832
9.057
9.289
9.526
9.769
10.02
10.27
10.54
10.81
6 027
10.8
(m
/
ty (
2 700
2 769
2 839
2 912
2 986
3.062
3.141
3.221
3.303
3.387
3.474
3.563
3.654
3.747
3.843
3.941
4.041
4.145
4.251
4.359
4.470
4.585
4.702
4.822
4.945
5.071
5.201
5.334
5.470
5.609
5.753
3.368
6.027
ty
(
o
ci
t
1 437
1 474
1 512
1 550
1 590
1.630
1.672
1.715
1.758
1.803
1.849
1.897
1.945
1.995
2.046
2.098
2.152
2.206
2.263
2.321
2.380
2.441
2.503
2.567
2.632
2.700
2.769
2.839
2.912
2.986
3.062
1.882
3.368
o
ci
t
e
lo
0 7651
0 7846
0 8047
0 8252
0 8463
0.8679
0.8901
0.9128
0.9361
0.9600
0.9846
1.010
1.035
1.062
1.089
1.117
1.145
1.175
1.205
1.235
1.267
1.299
1.332
1.367
1.401
1.437
1.474
1.512
1.550
1.590
1.630
1.052
e
lo
t v
e
0 4073
0 4177
0 4284
0 4393
0 4505
0.4620
0.4738
0.4859
0.4984
0.5111
0.5241
0.5375
0.5512
0.5653
0.5798
0.5946
0.6098
0.6253
0.6413
0.6577
0.6745
0.6917
0.7094
0.7275
0.7460
0.7651
0.7846
0.8047
0.8252
0.8463
0 86 9
0.588
t
ve
o
n
t
0 2168
0 2224
0 2281
0 2339
0.2398
0.2460
0.2523
0.2587
0.2653
0.2721
0.2790
0.2862
0.2935
0.3010
0.3086
0.3165
0.3246
0.3329
0.3414
0.3501
0.3591
0.3682
0.3776
0.3873
0.3972
0.4073
0.4177
0.4284
0.4393
0.4505
0.328
on
t
n
fr
o
0 1126
0 1154
0 1184
0 1214
0 1245
0.1277
0.1309
0.1343
0.1377
0.1412
0.1448
0.1485
0.1523
0.1562
0.1602
0.1643
0.1685
0.1728
0.1772
0.1817
0.1864
0.1911
0.1960
0.2010
0.2062
0.2114
0.2168
0.2224
0.2281
0.2339
0.2398
0.184
n
fr
22 nm diameter
io
n
0 05992
0 06145
0 06302
0 06463
0 06628
0.06797
0.06971
0.07149
0.07332
0.07519
0.07711
0.07908
0.08110
0.08317
0.08529
0.08747
0.08970
0.09199
0.09434
0.09675
0.09922
0.1018
0.1044
0.1070
0.1098
0.1126
0.1154
0.1184
0.1214
0.1245
0.1277
0.103
io
n
TNA
22 nm diameter
a
ct
i
0 03190
0 03271
0 03355
0 03441
0 03529
0.03619
0.03711
0.03806
0.03903
0.04003
0.04105
0.04210
0.04317
0.04428
0.04541
0.04657
0.04775
0.04897
0.05022
0.05151
0.05282
0.05417
0.05556
0.05697
0.05843
0.05992
0.06145
0.06302
0.06463
0.06628
0.06797
0 032
0.057
act
i
TNA
R
e
a
0 01698
0 01742
0 01786
0 01832
0.01878
0.01926
0.01976
0.02026
0.02078
0.02131
0.02185
0.02241
0.02298
0.02357
0.02417
0.02479
0.02542
0.02607
0.02674
0.02742
0.02812
0.02884
0.02958
0.03033
0.03111
0.03190
0.03271
0.03355
0.03441
0.03529
0 036 9
0 018
0.032
R
e
a
3
2
R
0.01000
0.01026
0.01052
0.01079
0.01106
0.01134
0.01163
0.01193
0.01224
0.01255
0.01287
0.01320
0.01353
0.01388
0.01423
0.01460
0.01497
0.01535
0.01574
0.01615
0.01656
0.01698
0.01742
0.01786
0.01832
0.01878
0 010
0.018
R
10
-3
10
-2
2
0.01000
0.010
usivity
iffusivity (m
(
m2/s
y (
)
2
/s)
/ )
b
a
b
Laser
Laser
Ignition
Electrode
Direction of reaction
Negative
voltage
Positive
voltage
voltage
voltage
c
0 04
0.06
60
40
Reaction
TNA/MWNT : 5.9
V
)
0 02
0.04
40
20
Reaction
starts
Mass : 11.4 mg
L
h 4
(m
V
0.00
0.02
20
0
Length : 4 mm
age
-0.02
‐20
V
olt
a
-0 05
0 00
0 05
0 10
0 15
-0.04
‐40
0 20
0 00
0 05
0 10
0 15
V
0.05
0.00
0.05
0.10
0.15
Time (sec)
0.20
0.00
0.05
0.10
0.15
Time (sec)
20
)
(
)
TNA/MWNT : 9
Reaction
10
(mV
)
Mass : 0.65 mg
Length : 4 mm
Reaction
starts
m
V)
0
a
ge
(
Length : 4 mm
ge
(
m
-10
V
olt
a
lt
ag
-20
V
Vo
0.0
0.1
0.2
0.3
20
Ti
(
)
Time (sec)
b
30
TNA/MWNT : 9
b
30
m
V)
TNA/MWNT : 9
Mass : 0.8 mg
Positive voltage
20
e
(
m
Mass : 0.8 mg
Length : 3 mm
10
tag
e
Reaction starts
10
Vol
t
0 0
0 2
0 4
0 6
0 8
1 0
0
0.0
0.2
0.4
0.6
0.8
1.0
Time (sec)
0
0
V
)
Reaction starts
-10
e
(m
V
Reaction starts
-20
ag
e
-30
V
ol
t
Negative voltage
0 0
0 2
0 4
0 6
0 8
1 0
-40
V
g
g
0.0
0.2
0.4
0.6
0.8
1.0
Time (sec)
d
d
10
4
10
10
4
4
10
4
10
3
10
3
g
)
Li-ion battery
10
10
W
/k
g
10
2
10
2
e
r (
W
10
o
w
e
10
1
10
1
c
p
o
(4 5 13)
(TNA/MWNT, Diameter)
c
ifi
c
(4.5, 13)
(4.5, 22)
10
0
10
0
S
pe
c
(4.5, 22)
(9, 22)
1
1
S
(2.8, 22)
10
-3
10
-2
10
-1
10
0
10
1
10
2
10
-1
10
-3
10
-2
10
-1
10
0
10
1
10
2
10
-1
0.4
10
10
10
10
10
10
10
10
10
10
10
10
TNA-MWNT mass (mg)
( g)
a
b
3.0
{TNA/MWNT TNA (mg)}
2 6
Initial reaction
a
b
2 5
{TNA/MWNT, TNA (mg)}
s
)
{42, 18}
2.6mm
2.5
{18, 11}
(m/
s
{42, 18}
Alignment of MWNT
N)
2.0
{4, 4}
ity
(
90 °
0 °
(
1 5
e
loc
1.5
Anisotropic reaction
n
v
e
of TNA-MWNT film
f
1.0
tio
n
t
0.5
e
ac
t
h
0 0
0 5
R
e
T
0.0
-90
-60
-30
0
30
60
90
Angle (degree)
d
c
d
10
/kg)
10
:
Aligned direction of CNT
N
•
s/
8
m
)
ass
(N
m
m
lMa
6
o
n
(
To
ta
l
4
1mm
siti
o
Gravity
e
/
T
4
1mm
Po
s
pulse
2
Y
Y
lImp
Ground
X
To
ta
l
0
2
4
6
8
10
0
T
0
2
4
6
8
10
X Position (mm)
X Position (mm)
60
(TNA/MWNT, TNA (mg))
(EM/CNT, EM(mg))
(18 10 2)
TNA−MWNT
0
(42, 17.8)
(18, 10.2)
50
(5, 3.6)
(23, 10.7)
N)
40
(3, 3.1)
(5 4 4)
(5, 3.6)
(m
40
(5, 4.4)
Force sensor
rce
Force sensor
Ignition
30
fo
r
20
u
s
t
20
h
ru
10
T
0
0
50
100
150
200
250
0
0
50
100
150
200
250
Time (ms)
10
7
10
7
10
3
C
fi
t
i d f
i t
i
l
/kg)
Confinement required for anisotropic release
/kg)
N
s/
s
(s
/
6
6
10
2
ass
(N
M
as
10
6
10
6
Total
l Ma
o
ta
l M
10
1
To
ta
l
/
To
10
5
10
5
Specific
e
/
T
u
lse
10
5
10
5
10
0
pulse
Imp
u
10
l Imp
ific
I
10
4
10
4
10
-1
To
ta
l
Spec
1
10
10
4
1
2
3
4
5
10
1
N
T
lent
er
sed
ster
lent
er
es
T
S
1
1
2
3
4
5
−MW
N
ropel
l
hrust
e
r typ
e
S−
Ba
s
othru
s
ropel
l
hrust
e
TNA
−
olid p
r
crot
h
Othe
M
EM
S
m
icr
o
onop
r
crot
h
T
So
mi
M
m
M
o
mi
SUPPLEMENTARY INFORMATION
Materials and methods
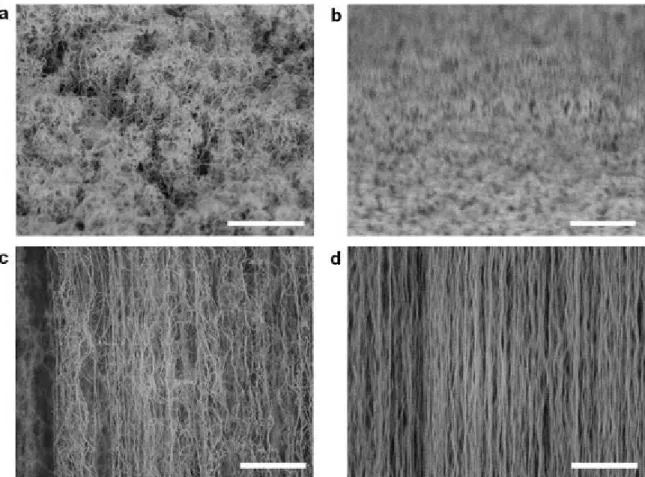
1. Synthesis of Vertically Aligned Multi‐walled Carbon Nanotubes
Vertically aligned multi‐walled carbon nanotubes (VAMWNT) were synthesized by the
chemical vapor deposition (CVD) method in a horizontal quartz tube furnace with an inner
diameter of 29 mm. Catalyst layers, 0.5 – 1 nm Fe and 10 nm Al
2O
3,were deposited on a
silicon wafer by electron beam evaporation
1. Ethylene (C
2H
4) was the carbon source.
Hydrogen (H
2) and argon (Ar) were used as catalytic and carrier gases, respectively
2. The
gases were preheated by a tungsten filament (12 – 14 amps) to induce the decomposition
of the hydrocarbons
3. The key steps in this fabrication process are described below.
a.
For 28 minutes, the furnace temperature was increased from 25 to 750 ºC with Ar
gas flow (400 sccm).
b.
Next, the temperature was maintained at 750 ºC for 10 minutes while H
2(100
sccm) and Ar (400 sccm) were injected. During this process, the Fe layer changed
form to Fe nanoparticles.
c.
C
2H
4(147 sccm), H
2(100 sccm) and Ar (400 sccm) were introduced into the furnace
at 750 ºC and 1 atm. To grow 22 nm‐diameter MWNT, bubbling water (50 sccm) was
injected for 1 minute every 15 minutes or continuously to decrease amorphous
carbon production and increase the straightness
of MWNT
1. For 13 nm‐diameter
MWNT, water was not injected. As shown in Fig. S1a, SEM confirmed that the final
lengths of MWNT were similar and that pulsed water injection resulted in well
aligned VAMWNT. Figure S2 shows the comparison between 22 nm‐diameter
MWNT and 13 nm‐diameter MWNT. The method for growing 13 nm‐diameter
MWNT has a lower degree of alignment and a higher quantity of amorphous
carbon compared to the 22 nm sample.
d.
At the end of the CVD process, the Ar flow rate was decreased to 50−100 sccm in
order to weaken bonding between the MWNT array and substrate
4and create a
free‐standing aligned MWNT array.
The resulting films were 3 to 5 mm tall on a silicon wafer approximately 5x5 mm in cross‐section (Fig. S1a). The MWNT were either dispersed as individual nanotubes for characterization or kept in an array form for further reaction testing. We calculated the porosity of the VAMWNT using a previously published protocol 5. The mass and volume of the VAMWNT were measured directly. The information about tube diameter and number of walls was obtained from TEM images (Fig. 1b). The 22 nm‐MWNT had an average of ten walls, an inner radius of 7.6 nm, and an outer radius of 11 nm, giving them a cross‐sectional area of 197.6 nm2. The porosity was estimated as 99%. Alternative growth conditions (Furnace tube diameter: 29mm, Fe: 0.5 nm, Al2O3: 20nm, C2H4: 30 sccm, H2: 55 sccm, Ar: 150 sccm) produced 13 nm‐diameter MWNT with an average of nine walls. TEM images are shown in Fig. S1b. The inner radius was 3.4 nm and outer radius was 6.5 nm. The cross‐sectional area was 96.4 nm2 and the porosity was 97%.Figure S1
|
Microscopic images of VAMWNT.a,
Scanning electron microscopic images of nanotubes synthesized using water injection method. Cross‐section is 5 x 5 mm and average height is 3 to 5 mm.b,
Transmission microscopic images. Inner diameter is 7 to 8 nm, and outer diameter is 11 to 13 nm.Figure S2
|
Scanning electron microscope images of VAMWNT with (22 nm‐diameter MWNT) or without water‐assisted method (13 nm‐diameter MWNT).a,
Tilted view of VAMWNT without water‐assisted method. A great deal of amorphous carbon exists on the top surface.b,
Tilted view of VAMWNT with water‐assisted method. The top surface of the VAMWNT is clear.c,
Side view of VAMWNT without water‐assisted method. The array is relatively poorly aligned.d,
Side view of VAMWNT with water‐assisted method. The array is relatively well aligned. All scale bars indicate 1 m.2. Synthesis and characterization of TNA‐MWNT
TNA was received in a sand mixture. Washing the mixture with acetonitrile dissolved TNA. The solution was filtered to eliminate impurities, resulting in pure TNA solution. 0.2 g of TNA was dissolved in 10 mL of acetonitrile. The solution was added to VAMWNT. When liquids are introduced into sparse VAMWNT and evaporated, the cross‐section of VAMWNT significantly shrinks due to the surface tension of the liquid and strong van der Waals interactions between nanotubes 6. Thus TNA was trapped among the MWNT and coated their walls (Fig. 1b). The aligned structure of TNA‐MWNT was maintained after the wet impregnation as shown in Fig. S3a. The TNA shows up as a bright coating compared to the nanotubes (Fig. S3b). 5 L of NaN3 in aqueous solution with a concentration of 50 mg/mL was then added to serve as a primary igniter, since NaN3 has a much lower activation energy (40 kJ/mol) 7 than TNA (120–200 kJ/mol) 8. TheVAMWNT were dried under atmospheric conditions (300 K, 1 atm) for 24 hours. The mass of the array was measured with a microbalance before and after impregnation to determine the mass ratio of TNA to MWNT. The mass ratio could be controlled by the concentration and amount of TNA solution added to the VAMWNT. Figure S4 shows the X‐ray diffraction data demonstrating that both the crystal structures of MWNT and TNA are preserved in the composite.
Figure S3
|
TNA‐MWNT scanning electron microscopic images. Each TNA‐coated MWNT was dispersed from the bundles before electron microscopy. a, The aligned structure was maintained after the wet impregnation. In several places, larger crystallites of TNA were visible, as in the transmission electron microscopic images of Fig. 1b. b, The TNA shows up as a bright coating compared to the nanotubes. c, Bulk TNA‐MWNT arrays were aligned along length axis, and weremore densely packed in comparison with MWNT arrays lacking TNA due to capillary forces during evaporation.