Publisher’s version / Version de l'éditeur:
ASTM Special Technical Publications, 879, pp. 140-53, 1985
READ THESE TERMS AND CONDITIONS CAREFULLY BEFORE USING THIS WEBSITE. https://nrc-publications.canada.ca/eng/copyright
Vous avez des questions? Nous pouvons vous aider. Pour communiquer directement avec un auteur, consultez la première page de la revue dans laquelle son article a été publié afin de trouver ses coordonnées. Si vous n’arrivez pas à les repérer, communiquez avec nous à PublicationsArchive-ArchivesPublications@nrc-cnrc.gc.ca.
Questions? Contact the NRC Publications Archive team at
PublicationsArchive-ArchivesPublications@nrc-cnrc.gc.ca. If you wish to email the authors directly, please see the first page of the publication for their contact information.
NRC Publications Archive
Archives des publications du CNRC
This publication could be one of several versions: author’s original, accepted manuscript or the publisher’s version. / La version de cette publication peut être l’une des suivantes : la version prépublication de l’auteur, la version acceptée du manuscrit ou la version de l’éditeur.
Access and use of this website and the material on it are subject to the Terms and Conditions set forth at
Discussion of heat flow meter apparatus and transfer standards used
for error analysis
Bomberg, M. T.; Solvason, K. R.
https://publications-cnrc.canada.ca/fra/droits
L’accès à ce site Web et l’utilisation de son contenu sont assujettis aux conditions présentées dans le site
LISEZ CES CONDITIONS ATTENTIVEMENT AVANT D’UTILISER CE SITE WEB.
NRC Publications Record / Notice d'Archives des publications de CNRC:
https://nrc-publications.canada.ca/eng/view/object/?id=a0dbdc25-865e-4110-9ce9-a4b7a2dd4fe6 https://publications-cnrc.canada.ca/fra/voir/objet/?id=a0dbdc25-865e-4110-9ce9-a4b7a2dd4fe6
Ser
TH9,National Research Conseil national
l Y
747
.o.
1342
6 .
2
Division of Division desBI;DG
Building Research recherches en MtimentDiscussion of Heat Flow
Meter Apparatus and
Transfer Standards
Used for Error Analysis
by M. Bomberg and K.R. SolvasonReprinted from ASTM STP 879, 1985 p. 140-153 (DBR Paper No. 1342) Price $2.00 NRCC 25262 N R C
-
C l O T lL I B R A R Y
modification subsiquente des normes d'essai de 1'ASTM ont rendu plus pressante la nicessiti d'ivaluer la precision que permet d'obtenir le fluxmetre thermique. Cette Ovaluation se fait habituellement au moyen de normes de transfert Stablies sur une plaque chaude gardie. La Mvision des recherches en bltiment du Conseil national de recherches du Canada (DRBICNRC) a mis au point une banque de normes de transfert et d'ichantillons calibris qui sert 3 verifier les procedures d'essai du fluxm2tre thermique et la merge d'erreur de l'appareil. Ce document traite de la calibration et de l'utilisation du f l u d t r e thermique, et il 6 c r i r 1-
---
'- - - --
d s e s au poinrAuthorized Reprint from Special Technical Testing Publication 879
Copyright
American Society for Testing a n d Materials
19 16 R a c e Street. Philadelphia, PA 1 9 103 1985
Mark
Bomberg' and
K.
Richard Solvasonl
Discussion of Heat Flow Meter
Apparatus and Transfer Standards
Used for Error Analysis
REFERENCE: Bomberg, M. and Solvason, K. R., "Discussion of Heat Flow Meter Ap- paratus and Transfer Standards Used for E m r Analysis," Guurded Hor Plutv und Heur Flow Mvtvr Mvthodologv. ASTM STP 879, C. J. Shirtliffe and R. P. Tye, Eds.. Ameri- can Society for Testing and Materials, Philadelphia. 1985. pp. 140-153.
ABSTRACT: The nced for thermal tcsinancc measurements on thick specimens 0 0 0 to
I80 mnl) of law-density thermal insulation and subsequent changes in ASTM rest stan- dards have increased the need fortheevaluation of prccis~ln and accuracy attainable with the heat flow meter (HFM) apparatus. Such an evaluation is usually performed with transfer standards erlablished on a guarded hot plate. 'l'he Division of Building Research of the National Research Cuuncil of Canada (DBR/NRCC) has developed a transfer stan- dard and calibrated specimen bank to he used in verifying HMF rest procedures and in-
strument error evaluation. This paper discu.wssuch calibration and the use of the HFM apparatus and revicws the transfer standards developed at NRCC.
KEY WORDS: thcrmal resistance, thermal conductivity, heat flow measurements, heat flow transducers, heat flow apparatus, heat flow meter
For the past several years the only Canadian laboratory performing thermal conductivity (thermal resistance) tests on insulating materials for official evaluation and acceptance programs has been that of the Division of Building Research of the National Research Council of Canada (DBR/NRCC). I t has been also responsible for developing expertise in thermal conductivity testing.
Rapid developments in thermal insulating materials and advancement in
r laboratory instrumentation has forced DBR/NRCC to review its role. Tech-
I
!
nology transfer, enhancement perform reliable and precise measurements, has of the capability of industrial laboratories to been deemed more impor- tant than the maintenance of one. highly specialized, national testing facility.I
'Senior research officers, Division of Building Rescarch. National Research Council of Canada, Ottawa. Canada.
This paper reviews recent developments and. in particular, information de- veloped at DBRiNRCC related to:
1. Determination of uncertainty in thermal resistance testing. using trans- fer standard specimens developed at DBR/NRCC.
2. Determination of the technical expertise or proficiency of laboratory staff. using calibrated specimens developed at DBR.
The term "transfer standard" is used to describe an insulation specimen with an established mean R-value and an uncertainty estimate of its thermal resistance. The term "calibrated specimen" is used to describe a specimen that is sent to a laboratory for a proficiency check. The laboratory must deter- mine the thermal resistance of the specimen. and the result is then compared, by the certifying agency, with the characteristic obtained by the standard lab- oratory, in this case, DBR/NRCC.
The two apparatuses in most common use for laboratory determination of thermal resistance are the guarded hot plate (GHP) and the heat flow meter (HFM). At DBR/NRCC the
GHP
apparatus is used to develop transfer stan- dards and calibrated insulation specimens; the HFM apparatus is used for routine thermal conductivity testing. It is also used by most independent com- mercial testing laboratories and by the research and development and quality control laboratories of manufacturers of thermal insulating material.In this discussion a HFM apparatus means an instrument for laboratory determination of thermal resistance that employs one or more heat flow trans- ducers. Although similar comparative methods have existed for approxi- mately LOO years, it is only recently that the range of testing conditions in which the HFM method is utilized has exceeded that of other laboratory tech- niques. Broadening the range of HFM apparatus applications, however, has introduced new problems.
Historic Background2
Between 1870 and 1878 P6clet proposed three different methods of deter- mining thermal conductivity: sphere, pipe section, and a vertical slab. At about the same time, in 1872, Forbes introduced a slab method for determin- ing negative temperatures in which he measured the thickness of the ice layer formed on one surface of the specimen while the other side was exposed to a freezing mixture. In 1881 Christiansen built a comparative instrument that later was developed into a HFM apparatus. It contained three relatively thick copper plates with carefully drilled holes for thermometers. Two specimens, Z T ~ o Russian books, namely: B . S. Pietuchow. 0prno;e 1iuczm1;e Procesow Tiep1opierieduc;i IExperimenrul Study oj' Hear Trunsfer Processes), Gosenergoizdat. 1952. and D. N. Timrot. Opriedielrnije ~iep/f~prowodnosliSrrr~irielrlych Muteriulow (Determinorion o$ Thermul Coridi~c-
riviy of Building Muteriuls) Gosenergoizdat. 1932. provide a detailed review of the historic back- ground for this area of testing.
142 GUARDED HOT PLATE AND HEAT FLOW METER
one with known thermal conductivity and another for which thermal conduc- tivity was to be measured, were placed between the plates. Christiansen pro- posed a formula
where
A,L = thermal conductivity, thickness of the specimen,
&,Lo = same as above, for the reference material, and
T 3 , T 2 , T I = temperatures of copper plates, starting from the hot plate. Over the years the slab apparatus has been developed into a GHP through the efforts of many research workers, for example, Lees in 1892, Lees and Chorlton in 1896, Niven in 1906, Nusselt and Groeber in 1911, and Ponsgen in 1912 who introduced guarding heaters surrounding the main heater,
The concept of a heat flow transducer was used in Germany by Hencky in 1919 and by Schmidt in 1923 for field work. particularly on industrial insula- tions. While Henckg added a layer with thermal resistance comparable to that being measured, Schmidt's transducer had a small themal resistance and was provided with compensating rubber strips of approximately the same tesistance as the transducer. Depending on the nature of the substrate and the edge loss error, the number of compensating (guarding) strips could be
increased (for example. to five if the heat flow transducer was placed on the metal surface).
It may be surprising that 60 years later the same technique is used, with the same magnitude of error. The explanation is simple: the physical principles involved remain practically unchanged, but understanding of the measure- ment uncertainties has improved significantly. Progress in such measure- ments is therefore not so much in the development of more precise instru- ments as in enlarging the range of materials and testing conditions for a given level of precision and accuracy.
HFM
apparatus developments are very char- acteristic in this respect. With the abundance of inexpensive electronic corn-ponents it is possible to build today an apparatus that can yield results several times faster than a GHP apparatus can, one moreover that permits testing under conditions in which the GHP would yield excessive errors.
Advantages and Drawbacks of the HFM Method
The HFM method is not an absolute one and requires calibration with specimens having both mean thermal resistance and the uncertainty range of this value determined by an absolute method, for example, by the GHP method. In an earlier paper [ I ] that compared various calibration techniques for the HFM the authors concluded that the preferred technique is to use
transfer standards. As errors in measurement vary with thickness, mean tem- perature. and often even with temperature gradient across the specimen. one must either calibrate the HFM apparatus with the same type of specimen un- der the same testing conditions for which the apparatus will be used or per- form a complex error verification to establish how different test conditions affect the uncertainty of HFM results.
If the HFM apparatus is to be used for quality control in the manufacture of thermal insulation, the calibration should be performed using a transfer standard of the same material as that manufactured. If it is to be used in a broad range of testing conditions, the same approach, that is, use of transfer standards, would require that G H P tests be performed on a variety of materi- als and under a variety of testing conditions. However, there may be signifi- cantly larger errors in G H P measurement results.
Another paper [2] discussing errors associated with G H P measurements dealt only with errors in the basic measurement characteristics of the equip- ment; the effect of the characteristics of the material under test was not dis- cussed. Precision of the G H P apparatus was shown to be strongly dependent o n the uniformity of heat flow across the gap between the metering and guard ring areas and "zero balance" of the system. It was also shown that only ho- mogeneous, thin, uniform, "ideal" specimens could be used for experimental determination of the uncertainties in G H P testing.
Errors associated with the G H P apparatus arise from uncertainties in basic electrical (power and temperature) and thickness measurements and from de- viation from one-dimensional heat flow [ 3 . 4 ] . The errors in basic measure- ments are characteristic of the equipment used; for example, for a 600 by 600- mm G H P apparatus a t DBR/NRCC the repeatability precision of 0.2% and accuracy of 1.2% were determined a t the 90% probability level. The errors resulting from multidimensional heat flow, that is, unbalance and edge loss error, depend on the nature of the material as well as on the equipment used and can be easily larger.
It is therefore important to remember that while the G H P method yields high precision and accuracy under well-defined conditions of unidirectional heat flow, this may not be the case for thick, low-density thermal insulations with a significant fraction of radiative heat transfer or for layered specimens with a high conductivity facing material.
Restrictions in the use of the G H P method relate to combinations of speci- men thickness and testing conditions, where a lateral flow occurs over the air gap between main and guard ring heaters and in the specimen. Although a proper design of G H P apparatus may enlarge the range of testing conditions and material selection, its precision is reduced for thick specimens of thermal insulation faced with high-conductivity skins or membranes, layered and highly nonisotropic materials, or low-density materials in which a significant fraction of heat transfer is by radiation. In such cases the HFM apparatus may be used to better advantage than the G H P apparatus.
144 GUARDED HOT PLATE AND HEAT FLOW METER
All these considerations limit the choice of specimen thickness and the ma- terials and testing conditions that can be used for calibration and verification of HFM apparatus. If thicker transfer standards are needed, they must con- sist of two or more layers, each tested separately.
Principles of HFM Calibration
Bomberg and Solvason [2] have compared two methods of calibration. The first involves the use of calibrated specimens whose thermal resistance has been determined previously in the GHP. The heat flux in the HFM apparatus may be then inferred from the temperature difference across the specimen. This method is referred to as calibration of the HFM apparatus. In the second method, referred to as calibration of the heat flow transducer, the transducer and a dummy sample are placed between the plates of the one-sided GHP apparatus. The heat flux through the metering area of the transducer is as- sumed to be the same as that for the GHP measurement.
Both methods have advantages and disadvantages. In the calibration of the transducer, heat flow rate is measured directly and does not depend on a ref- erence specimen. Accuracy depends, however, on the assumption that the heat flux through the dummy specimen and the transducer is strickly one- dimensional.
Two transducer types were examined: cork core [5], called ARM, and com- mercially available transducers [6] called SG heat flow meters. The 300-mm square transducers (ARM 1 and ARM 2) were built on a 6.3-mm core of Arm- strong cork (No. 975), average density 496 kg/m3, following the construction method described by Zabawsky
[ A .
Nine pairs of Chromel-Constantan ther- mocouple junctions were installed to provide a central 150 by 150-mm meter- ing area. The total thickness of the transducer, including cork cover sheets, copper, and Mylar films, is about 8.4 mm. The surfaces were covered with the same black Nextel paint as was used on the SG heat flow meters, yielding the same emittance.Table 1 gives the results of the calibration of ARM type transducers with high-density glass fiber and polystyrene transfer standards. Table 2 shows the
TABLE I- CaIibration coefficients and confidence intervals as described by three starrdard deviations for ARM transducers (10 measurements).
- --
ARM 1 , Hot Side ARM 2, Cold Side Calibration Procedure
and Specimens C l at 35°C. 3 o C2 at 13'C. 3 o
Double HFM apparatus heat flux from high-density glass fiber and polystyrene transfer standards
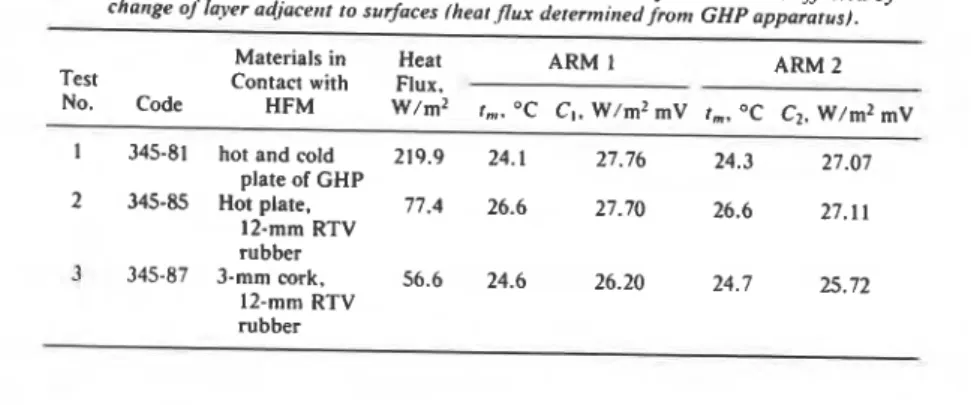
TABLE 2- Calibrariori coeflicie~rt of ARM I and ARM 2 hear flow meters as afjecred by charrge oj'layer adiacertr to surfaces (hear flux determined from GHP appararus).
- - -
Materials in Heat ARM 1 ARM 2
Test Contact with Flux.
No. Code HFM W/m2 r , . "C C I . W/m2 mV t,, OC C z . W/m2 mV
1 345-81 hot and cold 219.9 24.1 27.76 24.3 27.07
plate of GHP 2 345-85 Hot plate. 77.4 26.6 27.70 26.6 27.11 12-mm RTV rubber 3 345-87 3-mm cork, 56.6 24.6 26.20 24.7 25.72 12-mm RTV rubber
calibration coefficient for the same transducers inserted in the square 300- mm GHP apparatus:
ARM transducer alone, Test 1,
ARM transducer in series with 12-mm RTV rubber, Test 2,
ARM transducer between 3-mm cork and 12-mm RTB rubber, Test 3.
The thermal properties of the Layer adjacent to the transducer surface, as shown in Table 2, have a large effect on the apparent calibration coefficient, indicating a significant lateral component of heat flow.
Thus, one should calibrate the HFM apparatus using transfer standards, not the transducer alone. The transfer standards should be tested in the GHP apparatus under conditions identical to those used during
HFM
calibrationand should cover the range of test conditions for which the
HFM
apparatus is intended. Most errors in calibration are. however, inversely proportional to the heat flux, suggesting that theHFM
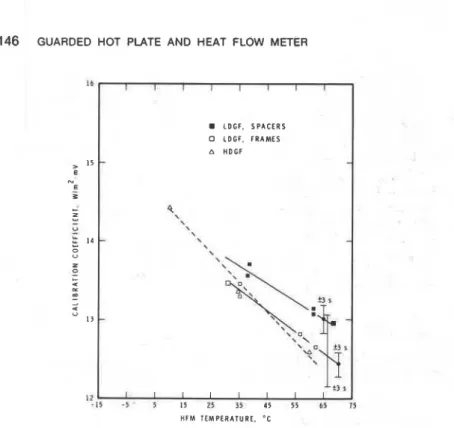
should be calibrated using thin trans-1 fer standards and high heat fluxes. This calibration would be valid for the Iow heat flux associated with testing thick specimens only if the output of the ther- mopile were proportional to the heat flux through it under all test conditions. Figure 1 shows that this is not always the case even for thin specimens. It gives an example of a calibration performed on a heat flow transducer, using 26-mm thick specimens of three different materials:
low-density glass fiber (LDGF), tested with spacers,
LDGF specimens, tested with wooden frames,
high-density glass fiber (HDGF) specimens.
Figure 1 also indicates that the calibration coefficient obtained for each cali- bration specimen is different (with probability higher than 95%). There is a difference in the slope of the temperature dependence of the calibration for
146 GUARDED HOT PLATE AND HEAT FLOW METER I* I I I I ( I I 1 8 L D G F . S P A C E R S 0 L D G F . F R A M E S A H D G F > ' 5
-
-
m E-
s H F M T E M P E R A T U R E . 'CFIG. I-Calibration of HFM with 26-mm thick LDGF and HDGF specimens.
bration coefficient, using LDGF, appears to be the same as that for speci- mens of HDGF. With extreme temperatures the differences are larger.
As the precision of an HFM calibration using LDGF specimens is as good as that for the high-density standard reference material, it should be possible to obtain the same precision over a larger range of specimen thicknesses or temperatures. This issue has been discussed elsewhere
[a,
91. Although cali-I
bration of the HFM apparatus in the same range of conditions as will be used in testing identical material (or similar) may constitute a practical solution, a design that will ensure the same calibration coefficient for various materials
1
and testing conditions appears to be a more satisfactory approach.The response of the heat flow transducer to the properties of the tested
I
specimen may be affected by nonuniformity of the transducer core, which may have low resistance paths through the thermopile junctions. Output willbe slightly higher if high conductivity material contacts the surface in the area of the thermopile junctions. This effect can be eliminated by facing the trans- ducer core with a high conductivity layer such as a few metal plates, separated with air gaps, to provide an isothermal surface adjacent to the specimen with- out increasing the lateral heat flow component at the metering area. Alterna-
tivelp. the HFM plate can be faced with a layer of low conductivity material such as 1.5 or 2-n~m cork. This allow's the temperature of the surface adjacent
to the specimen to vary. depending on the nature of the contact resistances with the specimen. In both cases the thermal regime at the transducer surface will be always the same. regardless of the properties of the specimen. Two
HFM instruments based on these considerations were built at NRCC 111.
Other transducer constructions were also tried, for example, dividing the metering field into a number of smaller, separately recorded areas to assess the errors caused by nonnniformity of either the specimen or the transducer itself. In calibrating the apparatus under a given set of testing conditions one has to examine the effect of a specific change in testing conditions on the
overall accuracy of thermal resistance testing. This kind of activity is called verification of
HFM
uncertainties. Different types of transfer standards are required for this purpose.Transfer Standards for HFM's Error Verification
The following materials were used at DBR/NRCC to establish sets of trans- fer standards based on uniformity, stability, and handling qualities:
1. Expanded polystyrene with density not less than 18 kg/m3. 2. Air-filled extruded polystyrene.
3. Medium- and high-density glass fiber insulation (Standard Reference Material No. 1450 from National Bureau of Standard [lo].
4. Thin (nonconvective) air layers with or without reflective surfaces. 5. Thin layers of glass fiber insulation with a density between 7 and 10 kg/m3.
A transfer standard is established as follows. A pair of specimens matched in both thermal resistance and density are tested at least nine times in the GHP apparatus. Five of the tests are performed with a mean temperature in the range 20 to 2g°C, and four are performed at the extreme ends of the test range, for example, a mean temperature between 0 and 10°C and one be- tween 40 and 50°C. If the standard deviation calculated for these test series is less than 0.5% and a substantial amount of information exists on the same lot (batch) of the material from which the specimens were selected, this pair of specimens will be called transfer standards. If, however, either the standard deviation is higher than 0.5% or there are no other test results on the same lot of the material, the specimens will be called calibrated specimens. They can be used for comparison purposes such as verification of the
HFM
apparatus errors. However. they are not recommended for calibration of the HFM appa- ratus. The following sections describe examples of a transfer standard; for other examples see Ref 8.148 GUARDED HOT PLATE AND HEAT FLOW METER
Glass Fiber Transfer Standard for Calibration of 300-mm H F M Appurutus Two specimens, coded 357-154-A and 357-154-B, were prepared from a 1.2
by 2.4 m by 25-mm sheet of glass fiberboard produced by Johns-Manville for the National Bureau of Standards, Washington, D.C., in 1978. Specimens were cut and placed in frames in June 1980.
Density, Specimen A = 56.1 kg/m3 (3.50 Ib/ft3) Density, Specimen B = 56.5 kg/m3 (3.53 Ib/ft3) Mean = 56.3 kg/m3 (3.51 Ib/ft3).
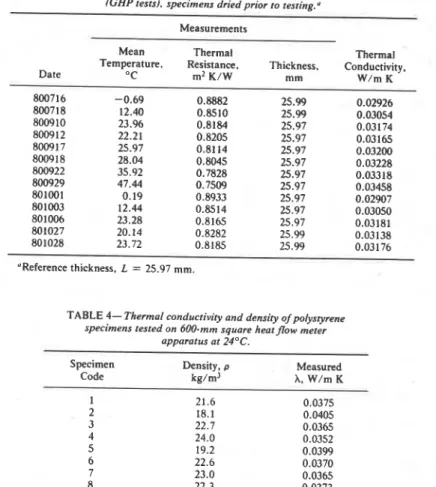
Table 3 gives the values of thermal resistance measured in the GHP appa- ratus, with corresponding values of mean specimen temperature, thickness, and thermal conductivity.
Thickness measured in the GHP apparatus is allowed to differ +_0.2%
from the specimen thickness determined outside the apparatus. If it differs by
more than 0.270, the test results are excluded. For a difference of less than
0.1 % the measured thermal resistance value is used; for a difference between
0.1 % and 0.2% a correction is applied.
The following relation was obtained from a regression analysis of the test results
where
R = thermal resistance, mZ K / W and T = mean specimen temperature, OC.
The mean standard deviation between measured R , recalculated to reference thickness, and the R-values calculated from Eq 1 is s = 0.2%. An error of
k0.4, therefore, can be estimated on a 90% probability level by using two
I standard deviations.
I
Use of Expanded Polystyrene for Transfer Standards
Three groups of specimens cut from a special run of expanded polystyrene were examined. Spatial variability in density and in associated thermal con- ductivity was found to be too large in materials with density less than
18 kg/m3. Two other series of specimens from materials with a density range of 18 t o 24 kg/m3 (1.1 to 1.5 Ib/ft3) showed satisfactory results. Table 4 shows thermal conductivity values as a function of specimen density measured at a mean temperature of 24OC. Using a linear regression for thermal conductivity
I as a function of density and comparing this with the measured values, there is
TABLE 3- Thermal resistance of 357-154A/E medium-density glass fiber specimens (GHP tests), specimer~s dried prior to testing."
Date 800716 800718 800910 800912 800917 800918 800922 800929 801001 801005 801006 801027 801028 Measurements Mean Temperature, "C -0.69 12.40 23.96 Thermal Thermal
Resistance, Thickness, Conductivity.
m2 K/W mm W/m K 0.8882 25.99 0.02926 0.8510 25.99 0.03054 0.8184 25.97 0.03174 0.8205 25.97 0.03165 0.8114 25.97 0.03200 0.8045 25.97 0.03228 0.7828 25.97 0.03318 0.7509 25.97 0.03458 0.8933 25.97 0.02907 0.8514 25.97 0.03050 0.8165 25.97 0.03181 0.8282 25.99 0.03138 0.8185 25.99 0.03176 - - - "Reference thickness, L = 25.97 mm.
TABLE 4- Thermal conductivity and density of polystyrene specimens tested on 600-mm square heatflow meter
apparatus at 24'C.
Specimen Density, p Measured
Code kg/rnJ A, W/m K
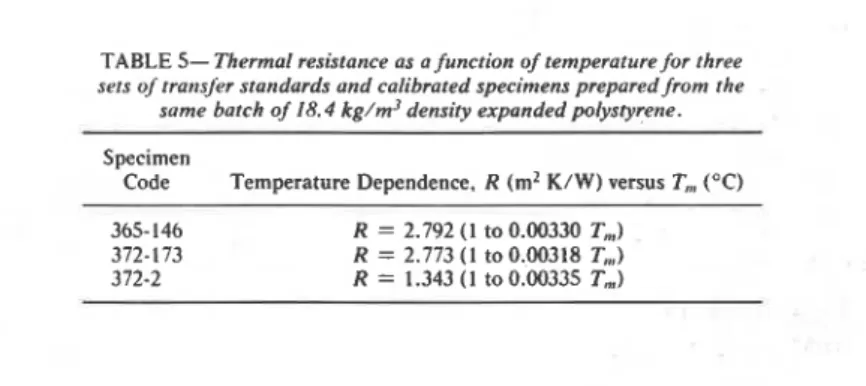
parable with that obtained on high-density glass fiber transfer standards. Temperature dependence for three sets of transfer standards prepared for the same lot of material is shown in Table 5. The agreement is good.
Use of Layered. Low-Density Glass Fiber Specimens as Transfer Standards
The following technique was used at DBR/NRCC to fabricate low-density transfer standards ranging in thickness from 50 to 200 mm. Using a light
150 GUARDED HOT PLATE AND HEAT FLOW METER
TABLE 5- Thermal resistance as a function of temperature for three sets of rransJkr standards and calibrated specimens prepared from the
same batch of 18.4 kg/m3 density expanded polystyrene.
Specimen
Code Temperature Dependence, R (m2 K/W) versus T,,, ("C)
table [ I l l , 30 specimens were selected whose density varied between 7.2 and 10.0 kg/m3. To reduce the number of tests required to establish their thermal characteristics two specimens separated by one paper layer (septum) to inter- cept radiative heat transfer were tested. Nine pairs were finally selected [ 8 ] .
Thermal conductivity tests on glass fiber multilayer specimens with and without paper septa were useful in examining the effect of specimen thickness [12,13] on apparent thermal conductivity and HFM apparatus errors related to increasing specimen thickness
[a,
91. Although thick, uniform, calibrated specimens are developed in a manner identical to that used for transfer stan- dards (see description of the glass fiber transfer standard in the previous sec- tion), the development of layered, calibrated specimens is far more difficult. The thermal resistance of these specimens is determined for standard condi- tions (24OC mean) only. To determine such values DBR/NRCC uses GHP and HFM measurements as well as computer calculations.Proficiency Testing
I
In contrast to transfer standards, which are loaned by DBR/NRCC to-
.
gether with certificates stating both the mean value and the uncertainty in thermal resistance over a given temperature range, calibrated specimens for proficiency testing are made available without any information on their ther- mal resistance. Each laboratory must decide on a testing procedure for deter-1
mining the thermal resistance of the calibrated specimens; it knows only thatdifferent results may be obtained with different testing conditions.
r There are two kinds of proficiency tests: those performed at standard con- ditions of mean temperature 24
+
1°C and temperature difference of 22+
2°C; and those performed over a range of mean temperatures between 0 and 50°C. Although some requirements for the two cases will be different, the same specimens are used. Those for proficiency testing will include homoge- neous transfer standards and the layered, calibrated specimens specially con- II structed for the purpose of proficiency testing.
Use of Layered Specime~ts
At DBR/NRCC the following were built and developed as calibrated, lay- ered specimens for proficiency testing:
1. 180 to 190-mm thick, uniform, layered polystyrene (type 21,
2. 150 to 180-mm thick, uniform, layered, low-density glass fiber, 3. 90 to 120-mm thick, cellular plastic specimens covered on one surface with medium conductive, uneven, metal reinforced bonding cement surface. Table 6 shows thermal resistance of one pair of layered specimens as tested on
HFM and GHP apparatus.
Proposed Requirements for Standard Test Conditions
1. The laboratory should perform, in sequence, a minimum of eight tests on one pair of transfer standards: Specimen A alone; Specimen B alone; Specimens A and B together, with a paper septum between. The mean ther- mal conductivity should be within 2.0% of the mean value determined in the
GHP apparatus at DBR/NRCC, and the standard deviation of thermal resis-
tance determined in this test series should not exceed 1.0% (that is, twice that allowed for transfer standards at DBR/NRCC).
2. Three coded, layered, calibrated specimens should be tested. The mean test results should not differ more than 3% from the mean determined at
NRCC, and none of the separate test results should differ more than 5% from the mean value determined by NRCC.
Proposed Requirements for Testing over a Temperature Range
1. The laboratory should perform a minimum of nine tests on each pair of transfer standards, five with mean temperature in the range 20 to 28OC, and
TABLE 6-Apparent thermal resistance of 90-mn~ thick polystyrene specimen covered on one side with bonding cement reinforced by expanded metal lath to
increase lateral conduction of surface layer.
-
Heat Flux Measured on Side Contacting
Equipment Test Placement
Type Code Stucco Polystyrene of Stucco
- - GHP 380-30 GHP 380-29 HFM 380-24 HFM 380- 14 HFM 380-25 HFM 380-15 HFM mean value .
.
. - 100.0 cold side 94.3 hot side 95.3 99.5 hot side 93.2 98.1 hot side 96.2 100.1 cold side 96.0 101.1 cold side 95.2 100.3 ...152 GUARDED HOT PLATE AND HEAT FLOW METER
four at the extreme ends of the test range, for example, between 0 and 10°C and between 40 and 50°C. Thermal conductivity should be within the follow- ing limits:
(a) Mean of three or more tests at 24 f 2OC should be within 2.0% of
the NRCC determined value.
( b ) Mean of two or more tests at other temperature should not differ by more than 2.5%.
2. Three layered, calibrated specimens should be tested at 24
+
1°C. Therequirements are the same as for point 2, Standard Test Conditions. 3. Lateral heat flow tests with three different ambient air temperatures should also be performed [ 8 ] .
Closing Remarks
The transfer standards and calibrated specimens must be returned to DBR/NRCC. In addition, the laboratory applying for accreditation should develop its own reference specimen. It may be one specimen or a pair of iden- tical specimens (material may be supplied by NRCC). The verification tests will be performed at DBR/NRCC and the specimens then returned to the accredited laboratory. Control charts must be established by that laboratory and adjusted during subsequent testing of the reference specimen [ 9 ] . The reference specimen must be retested by the accredited laboratory periodically and not more than 30 days before the test to be reported.
Cooperative projects performed by DBR/NRCC and by testing and indus- trial laboratories have proved that HFM apparatuses may be recalibrated quite easily to meet the proposed requirements.
Acknowledgment
The authors wish to thank J. G. Theriault, R. G. Marchand and Nicole
Normandin of the Thermal Insulation Laboratory, DBR/NRCC, for their contribution to the development of testing facilities transfer standards and for making the measurements. They also wish to express their gratitude to C. M. Pelanne for detailed discussion of HFM apparatus calibration.
This paper is a contribution from the Division of Building Research, Na- tional Research Council of Canada, and is published with the approval of the Director of the Division.
References
[ I ] Bomberg, M . and Solvason, K . R . in Thermal Insulations. Materiuls. and Systems for En- ergy Conservation in the '80s. ASTM STP 789, American Society for Testing and Materials, Philadelphia, 1983. pp. 277-292.
121 Bornberg. M. and Solvason. K. R. in Pmrpcdirrgs. 17th lnternatwnal Thermal Conduefiv- it? Conference, Plenum Ress. New York. pp. 393-410.
131 Woodside. W., Thernral Condrrcrivi+ Measurmr~nh. ASTM STP 21 7, American Society
for Testing and Materials. Philadelphia, 1957. pp. 49-62.
141 Woodside, W. and Wilson. A. G.. Thermal Condurrivir~ Meaauremmu. ASTM STP2I 7 ,
American Society for Testing and Materials, Philadelphia. 1957. pp. 32-46.
151 Bmwn. W. C. and Shinliffe. C. 1. in Proceedi~*gs, 14th Thermal Conductivity Canference, Plenum P m s , New York. 1975. pp. 539-542.
f61 Degenne. M.. Klarrlcfd. 5.. and Barthe. M. P. in Thcrmat Tra~smission Mra$uremen~saf Irrsularion. ASTM STP 660. American Society for Testing and Materials. Philadelphia,
L978. pp. 130-144.
171 Zabawsky, Z., ISA Test Measurements Symposium. Vol. 5 , Paper No. 68-520, 1968,
pp. 1-6.
181 Bornberg, M . . Pelanne. C. M., and Newton, W.. "Analysis of Uncertainties in Calibration of a Heat Flow Meter Apparatus," Thermal Conductiviry, Vol. 18, Plenum Press. New York.
191 Newton, W.. Pelanne, C. M.. and Bombeq. M.. "Calibration of Heat Flow Meter Appa-
ratus Used for Quality Control of Low Density Mineral Fiber Insulations,'' Thermal Con-
ductivity, Val. 18. Plenum Press. New York.
IIU] Siu, M. C. I. in Thermal Insulatiorr P~rjormance. ASTM STP 718. American Society for
Tcrting and Materials. Philadelphia. 1980, pp. 343-360.
fill Pelanne. C. M. in Thernral Tronsmisriorr Measurements Insulation, ASTM STP 660.
American Society for Tesring and Materials. Philadelphia. 1978, pp. 263-280.
[ f 2 j Pelanne. C. M. in Thermal Insulutinn Pe~fotmonce. ASTMSTP 718. American Society for
Testing and Materials, Philadelphia. 1980. pp. 322-334.
1131 Albens. M. A. and Pelanne. C. M. infioceedings. 17th International n e m a l Conductiv- ity Conference. Plenum R e s s , New York. 1983, pp. 471481.
T h i s paper, w h i l e being d i s t r i b u t e d i n r e p r i n t form by t h e D i v i s i o n of B u i l d i n g
Research, remains t h e c o p y r i g h t of t h e
o r i g i n a l p u b l i s h e r . It should n o t be
reproduced i n whole o r i n p a r t without t h e permission of t h e p u b l i s h e r . A l i s t of a l l p u b l i c a t i o n s a v a i l a b l e from t h e D i v i s i o n may be o b t a i n e d by w r i t i n g t o t h e P u b l i c a t i o n s S e c t i o n , D i v i s i o n of B u i l d i n g R e s e a r c h , N a t i o n a l R e s e a r c h C o u n c i l of Canada. O t t a w a , O n t a r i o . K I A OR6. Ce document e s t d i s t r i b u e s o u s forme de t i r 6 - a - p a r t par l a D i v i s i o n d e s recherches en batiment. Les d r o i t s de r e p r o d u c t i o n s o n t t o u t e f o i s l a p r o p r i € t B de l l € d i t e u r o r i g i n a l . Ce document n e p e u t L t r e r e p r o d u i t en t o t a l i t 5 ou en p a r t i e s a n s l e consentement de l ' b d i t e u r . Une l i s t e des p u b l i c a t i o n s de l a D i v i s i o n p e u t O t r e obtenue en B c r i v a n t 3 l a S e c t i o n d e s p u b l i c a t i o n s , D i v i s i o n d e s recherches en b l t i m e n t , C o n s e i l n a t i o n a l de r e c h e r c h e s