Characterization of Ionic Liquid Ion Sources for
Focused Ion Beam Applications
by
Carla S. Perez Martinez
B.S.,
Aeronautics and Astronautics, Massachusetts Institute of
Technology
Submitted to the Department of Aeronautics and Astronautics
in partial fulfillment of the requirements for the degree of
Master of Science in Aeronautics and Astronautics
at the
MASSACHUSETTS INSTITUTE OF TECHNOLOGY
June
2013
@
Massachusetts Institute of Technology 2013. All rights reserved.
Author ...
Department of Aeronautics and Astronautics
May 23, 2013
Certified
by...
I
Paulo Lozano
Associate Professor
Thesis Supervisor
I Accepted by ... v. .. ....Eytan Modiano
Professor of Aeronautics and Astronautics
Chair, Graduate Program Committee
\~A2sAcusErrNr~#
*
I~-***-~--d~Ii
Characterization of Ionic Liquid Ion Sources for Focused Ion
Beam Applications
by
Carla S. Perez Martinez
Submitted to the Department of Aeronautics and Astronautics on May 23, 2013, in partial fulfillment of the
requirements for the degree of
Master of Science in Aeronautics and Astronautics
Abstract
In the Focused Ion Beam (FIB) technique, a beam of ions is reduced to nanometer dimensions using dedicated optics and directed to a substrate for patterning. This technique is widely used in micro- and nanofabrication for etching, material deposi-tion, microscopy, and chemical surface analysis. Traditionally, ions from metals or noble gases have been used for FIB, but it may be possible to diversify FIB applica-tions by using ionic liquids. In this work, we characterize properties of an ionic liquid ion source (ILIS) relevant for FIB and recommend strategies for FIB implementation. To install ILIS in FIB, it is necessary to demonstrate single beam emission, free of neutral particles. Beams from ILIS contain a fraction of neutral particles, which could be detrimental for FIB as they are not manipulated by ion optics and could lead to undesired sample modification. We estimate the neutral particle fraction in the beam via retarding potential analysis, and use a beam visualization tool to determine that most of the neutral population is located at the center of the beam; the neutral population might then be eliminated using filtering. The same instrument is used to determine the transition of the source from single to multiple beam emission as the extraction voltage is increased. These studies should guide in the design of the optical columns for an ILIS-based FIB.
Thesis Supervisor: Paulo Lozano Title: Associate Professor
Acknowledgments
I would like to thank my advisor, Professor Paulo Lozano. Since I stepped into his
office all those years ago to get a UROP, I have received much knowledge, curiosity and excitement, but I have been taught most importantly in humbleness and kindness.
I feel privileged to be one of his lab children.
Many thanks to Drs. Jacques Gierak and St6phane Guilet for hosting me in France that summer and getting me excited about focused ion beams. I would like to thank Professor Manuel Martinez-Sinchez and Professor Sheila Widnall for their guidance, and Professor David Darmofal for being a terrific undergraduate advisor. I would also like to thank Dr. Jason Sanabia, Dr. John Notte, Dr. Mark Schattenburg and Professor Karl Berggren for their scientific advice.
Thank you to Dan Courtney, Tim Fedkiw and Anthony Zorzos, who advised me as an undergrad and made possible much of this work. Thanks to Todd Billings and David Robertson for all the technical support in fulfilling these experiments, and to Marilyn Good and Meghan Pepin for their support outside the lab. And thank you to UROP students Jennifer Quintana, Alex Feldstein and specially Jimmy Rojas for being such stars in the lab. Thank you also to all my lab mates for their help along the way.
Many thanks to the peers that have been so kind to me these years: my friends Bruno Alvisio, Agata Wisniowska, Lina Garcia, Nina Siu, Michael Lieu, Eric Dow, Vedran Sohinger, Elizabeth Qian, Adrienne Tran, Maria de Soria and Carmen Guerra. Thank you to Stanley and Connie Kowalski and Jose Pacheco and Letty Garcia, for taking care of me and embracing me into their families.
I have been blessed above all things with my wonderful family. Muchas gracias, Mami, Papi, M6nica y Renato por todo su apoyo y su paciencia conmigo, por quer-erme tanto y por darme fuerzas todos los dias. Gracias a mis tias, tios, abuelas y primos por su cariio y su apoyo. Tanto amor es prueba que Dios no se deja vencer en generosidad. Esta tesis es de todos.
bumpy moments and for encouraging me to be a better scientist, I am so happy to have found you.
This research has been made possible by funds provided by the National Science Foundation and the Air Force Office for Scientific Research.
Contents
1 Introduction
1.1 Focused Ion Beam Overview and Applications 1.2 Ion Sources for FIB . . . .
1.2.1 Requirements . . . . 1.2.2 Liquid Metal Ion Sources . . . .
1.2.3 Gas Field Ionization Sources . . . . 1.2.4 Other Ion Sources . . . .
1.3 A new hope: Ionic Liquid Ion Sources . . . . . 2 Physics of Ionic Liquid Ion Sources
2.1 ILIS Basic Physics . . . .
2.1.1 Taylor Cone formation . . . .
2.1.2 Ion Evaporation and Emission Site . . . .
2.1.3 Starting Voltage . . . .
2.2 ILIS performance in FIB . . . . 2.2.1 Brightness and Energy Characteristics of ILIS Beams 2.2.2 Probe Size Estimation and Preliminary Focusing . . .
2.3 Thesis Contributions . . . .
3 Experimental Techniques
3.1 Source Fabrication and Emitter-Extractor Setup . . . .
3.2 Ion Beam Visualization . . . . 3.3 Neutral Beam Visualization . . . .
15 . . . . 15 . . . . 17 . . . . 19 . . . . 20 . . . . 22 . . . . 25 . . . . 27 31 . . . . . 31 . . . . . 31 . . . . . 34 . . . . . 38 . . . . . 42 . . . . . 42 . . . . . 44 . . . . . 47 49 49 52 54
3.4 Retarding Potential Analysis . . . .5
4 Experimental Results 57 4.1 Beam Visualization . . . . 57
4.1.1 Basic Beam Profile and Polarity Alternation Stability . . . . . 57
4.1.2 Influence of the Applied Voltage . . . . 59
4.2 Neutral Beam Visualization . . . . 66
4.3 Retarding Potential Analysis . . . . 69
5 Conclusions and Future Work 73 5.1 Implications of characterization results . . . . 73
5.2 Distal Electrode Configurations for long lifetime . . . . 75
5.3 The road to an ILIS-based FIB . . . . 76 55
List of Figures
1-1 FIB column outline, based on [9] . . . . 16
1-2 (a) FIB thinning of a sample to produce a sample for TEM inspection, from [9] (b) TEM lamella, from [21] . . . . 17 1-3 Schematic of Einzel lens chromatic aberration. Particles coming at
different energies are deflected differently in the electric field generated
within an Einzel lens . . . . 19
1-4 (a) LMIS basic setup (b) Gallium ion source in operation (from [9]) . 21
1-5 Basic GFIS setup . . . . 23 1-6 (a) Blunt GFIS tip, emitting many beamlets from ionization disks
lo-cated above atoms (b) Beam pattern produced by GFIS (c) Super tip, emitting beamlets only from topmost atoms (d) Few beamlets pro-duced by super tip [35] . . . . 24
1-7 (a) He Ion Microscope (left) vs. Scanning Electron Microscope images (right). Note the finer topography details in the HIM image. Both images have 20 pm field of view
[35]
(b) 5 nm ribbon patterned ongraphene using He FIB [12] . . . . 25 1-8 (a) EMI-BF 4, C6N2H+BF- Courtesy T. Coles (b) ILIS basic setup 27
1-9 (a) Pure mechanical etching (b) Mechanical etching with reactive gas assistance (c) ILIS milling with reactive ions does not require gas as-sistance . . . . 28 1-10 (a) Experimental Setup for ILlS etching experiments (b) Si wafer after
2-1 Diagram of a Taylor Cone. . . . . 32
2-2 Field Emission. (a) Image charge diagram (b) Potential due to image charge and electric field . . . . 35 2-3 (a) Emission site diagram (b) Liquid Vacuum interface and Gaussian
pillb ox . . . . 37
2-4 Prolate spheroidal coordinate system (x = 0 plane) . . . . 40
2-5 Diagram of break-up from n=1 to n=0 . . . . 43
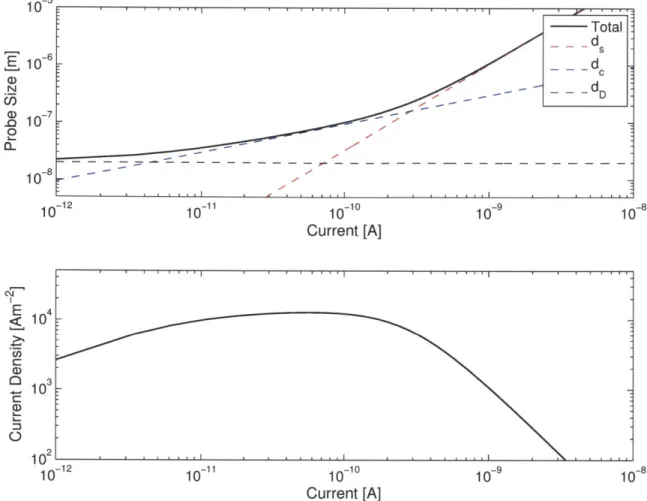
2-6 Probe Size and Probe Current Density for a hypothetical ILIS FIB . 45
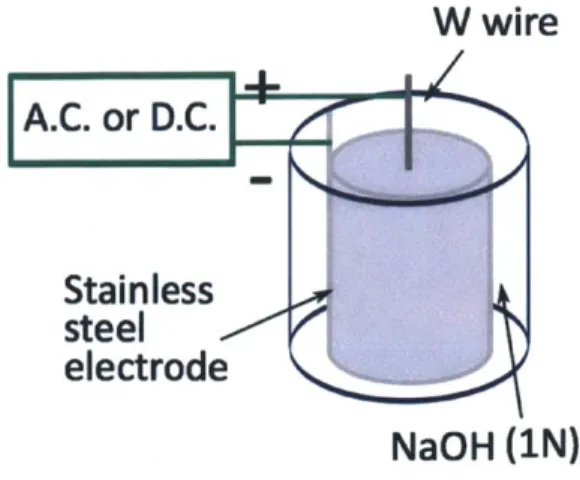
3-1 Electrochemical Etching Setup . . . . 50 3-2 Scanning electron micrograph of ILIS tip after wetting with EMI-BF4. 5 1
3-3 (a) Visualization setup diagram (b) Pictures of experimental setup . . 53
3-4 Visualization setup with deflector plates . . . . 54
3-5 Sample trajectories of EMI+ for different deflection voltages. The en-trance of the deflector is at x=0. . . . 55 3-6 (a) RPA diagram (b) Picture of setup . . . . 56
4-1 Beam profiles for emission in alternating polarity. (a and b) Contour plots of beam profile in negative and positive mode, respectively. (c and d) Beam profile cross-section in negative and positive mode,
re-spectively, with comparison to theoretical parabolic distribution. . . . 58
4-2 (a)-(f) Beam profiles for emitter voltages from Vapp = 1.1 to Vapp = 1.7 kV. We note that the profiles appear rounded off as the BVS has
a circular imaging area; data appearing near x = 0 mm, y = 40 mm
corresponds to reflections of light on the metal surrounding the imaging area . . . . 60
4-3 (a)-(f) Beam profiles for emitter voltages from Vapp = -1.1 kV to Vapp = - 1.6 kV . . . . 61
4-4 (a)-(k) Beam profiles for emitter voltages from Vapp = 1 kV to Vapp = 1.5 kV . . . . 63
4-5 (a)-(k) Beam profiles for emitter voltages from Vapp = -1 kV to Vapp =
- 1.5 kV . . . . 64
4-6 Beam profiles for different emitter voltages for a larger Rc tip . . . . . 65
4-7 Diagram of emitter with Taylor cone at (a) Starting voltage (b)
Volt-ages for which multiple cones can be sustained . . . . 65 4-8 (a and b) Undeflected beam profiles (c and d) Profiles of neutral
par-ticles and deflected beam. . . . . 67
4-9 (a and b) Undeflected beam profiles (c and d) Profiles of neutral par-ticles and deflected beam. . . . . 68
4-10 (a) Undeflected beam profile of a multiple cone emission (b) Multiple
beams are deflected and neutral signal observed . . . . 69 4-11 Retarding Potential Analyzer Curves for Vapp = ±1.4 kV . . . . 70 5-1 Schematic of possible filtering setup for ILIS FIB implementation . . 74
List of Tables
Chapter 1
Introduction
Focused Ion Beam (FIB) systems have become ubiquitous in semiconductor manufac-turing and in micro and nanofabrication. Commercial systems based on Liquid Metal Ion Sources (LMIS) and Gas Field Ionization Sources (GFIS) allow manufacturing and microscropy of materials down to the nanometer scale, but these technologies have some limitations that could be overcome by using a different source of ions. In this thesis, we focus on the development of Ionic Liquid Ion Sources (ILIS) as a new option for FIB systems, discuss the advantages these sources could bring, and perform some initial characterization required to optimize and implement ILIS in FIB.
In this chapter, we review the basics of FIB technology, the different ion sources technologies available, and introduce ILIS as a new and versatile option in FIB ap-plications.
1.1
Focused Ion Beam Overview and Applications
In the FIB technique, a beam of ions is obtained from an ion source, and then directed to an optical column containing apertures, electrostatic lenses and defiectors, that narrow the beam to nanometer dimensions and direct it to a substrate for patterning, as shown in Fig. 1-1.
Focused ion beams have a number of uses in the semiconductor industry, in the fabrication of microelectromechanical systems, and in biological studies. FIB systems
Defining Aperture Condenser lens Deflectors Objective Lens Probe Size Target
Figure 1-1: FIB column outline, based on [9]
are routinely used for micromachining applications, such as material removal due to sputtering of the incident ions, or material deposition, where a precursor gas reacts with the surface in the presence of the ion beam to produce a microstructure [24, 34].
A key application is circuit modification and repair, in which it is possible to edit
integrated circuit connections by means of an ion beam. One of the areas where FIB has become indispensable is the preparation of samples for Transmission Electron Microscopy (TEM), where a sample must be thinned out to less than 100 nm in order to be electron transparent [9, 21]. The material around the sample is removed
by FIB-induced sputtering. A schematic of the process and an example lamella are
shown in Fig. 1-2.
FIB systems can also be used to analyze surfaces. When an ion impacts the surface, it has the effect of removing both ions and electrons from the surface. In Sec-ondary Ion Mass Spectrometry, the ions ejected from the surface are used for chemical analysis, and since the ion beam removes material gradually from the sample, it is possible to profile the composition along the depth of the sample. Furthermore, the secondary electrons produced upon ion impact can be used for imaging. Recently, the Helium Ion Microscope (HIM), a FIB system based on a helium GFIS, has demon-strated sub-nm resolution and has been able to overcome some of the artifacts posed
by traditional scanning electron microscopy [35].
(a)
(b)TEM inspection beam
Figure 1-2: (a) FIB thinning of a sample to produce a sample for TEM inspection, from [9] (b) TEM lamella, from [21]
or improve the capabilities of current systems. We now give an overview of the different FIB systems based on the ion source type, by reviewing their advantages and their limitations. This thesis is concerned with the development of a new ion source for FIB, the ionic liquid ion source (ILIS), which is introduced at the end of the chapter.
1.2
Ion Sources for FIB
FIB systems strive for improvement of the probe size, which is defined to be the smallest diameter of the beam after focusing, while maintaining a current density in the probe that is high enough for the required application. The probe size d determines the resolution that can be patterned using a FIB system, and thus should be as small as possible. The probe size depends on several parameters from the ion source and the optical system, and can be calculated to be the contribution of the lens magnification on the source size and the contributions of chromatic and spherical aberrations of the optical system [24].
For a perfect, symmetric Einzel lens, the probe size would be simply given by the lens magnification M of the source size D:
Lenses, however, have artifacts that increase this theoretical size. A lens focuses particles that are coming further from its optical axis more strongly than the particles coming close to it, an effect known as spherical aberration. The spherical aberration depends on the current accepted from the beam, I (note this might be different than the current emitted from the source, as we may limit the current accepted into the optical system using defining apertures, see Fig. 1-1), as well as on the current angular spread ., where Q is the unit solid angle. We assume a constant d for this analysis.
The spherical aberration also depends on the lens magnification and the lens spherical aberration coefficient Cs, and its contribution to the probe size is given by
I3/2 02
d = S (1.2)
72 M22s]3/2
dn
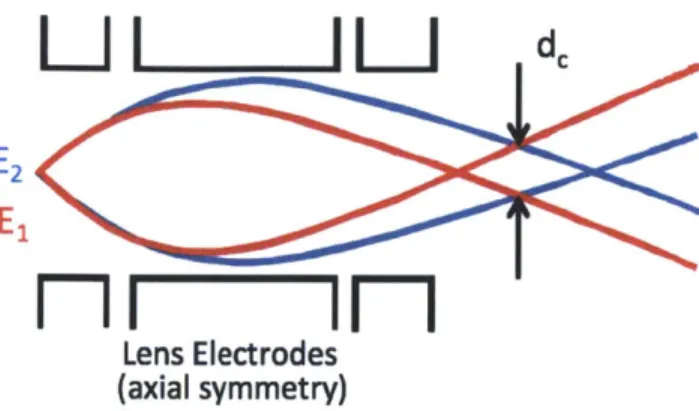
Chromatic aberration is also an important contribution to the probe size. Einzel lenses traditionally used for FIB will focus a particle depending on the particle's energy, so if particles come at different energies from each other, the lens will focus them on a different spot, giving in a larger beam size, as shown in Fig. 1-3. Ideally, an ion source emits all particles at an energy W. However, due to the physics of ion emission, some particles come at energies slightly different from the main energy peak. Let AWi/2 be the full-width-at-half-maximum of the energy distribution. The
chromatic aberration contribution to the probe size is given by
d= /2 (A /2 c (1.3)
W [7M2 d 1/2
do
where Cc, the chromatic aberration aberration coefficient, quantifies the spreading effect for a given lens. Adding up the contributions from equations 1.1, 1.2, and 1.3 in quadrature, the probe size is given by
d2 L C 2 + I / 2 c +_ M 2D2 (1 4) 4 [7M2 ]3 W [7M2D(
From 1.4, we observe that reducing the current will lead to a smaller probe size, but doing so is not always practical. Some applications, such as material removal, require high current densities in the sample in order to reduce the processing time,
LI
IJ
Mm1
im
Lens Electrodes (axial symmetry)Figure 1-3: Schematic of Einzel lens chromatic aberration. Particles coming at dif-ferent energies are deflected difdif-ferently in the electric field generated within an Einzel lens
and in microscopy, having higher currents improves the signal available for image acquisition. Thus, it becomes necessary for the source to have optical properties that will favor a smaller probe size without resorting to current reductions. We enumerate some of the requirements an ion source must satisfy in order to be implemented in a FIB system reliably and with sub-micrometer probe size, before numbering the sources available.
1.2.1
Requirements
The following properties of an ion source measure its viability in a FIB system:
9 High Brightness. An ion source produces a current Ib from a source size D and sprays it into a cone with half angle ao, or into a solid angle Q =
27r(1 - cos ao) ~ 7ra2. The brightness of the source is a measure of how tightly we can confine the current of the ion beam, and is given by
=
(1.5)
(7raoD)2
Brightness affects the probe size through the beam angular spread, current density and source size. The higher
#,
the better probe size and current that can be achieved; it is usually required that a source has 3> 106Acm-2sr- [12]." Energy Spread. From equation 1.4 it is evident that the smaller the energy spread, the better the resolution of the FIB system. The value of AWI/2 must
be minimized [32], and should be restricted to less than 10 eV.
* Lifetime. FIB systems are very complex machines with high-vacuum systems,
specimen stages and delicate optics. It is desirable for a source to have lifetimes greater than hundreds of hours in order to minimize source replacement and the exposure of these systems to contamination.
" Beam Stability. The beam from an ion source must be "precisely in relation
with the elements of an optical system" [22] for adequate focusing, which means that the beam should not drift during operation. Furthermore, we require the current emitted should be constant to within 1-2% over periods of several minutes, so that there are no variations at different points in the scan during the patterning process.
There are a few ion source candidates for FIB operation, and we discuss LMIS and GFIS in detail, as they are used in commercially available systems capable of sub-100 nm patterning. Other less popular ion sources are also discussed.
1.2.2
Liquid Metal Ion Sources
LMIS are the most widely used sources for FIB, due to their high-brightness and
reliability [9]. The ion production mechanism in LMIS is field evaporation from liquid metals. To achieve ion evaporation, a tungsten tip that has been sharpened
to a radius of curvature of - 10 pm is covered with a molten liquid metal. The
tip, or emitter, is in contact with a liquid reservoir. The tip is placed in front of a metallic plate with an aperture in it, the extractor, as shown in Fig. 1-4. The emitter extractor assembly is placed in vaccum. By applying a potential difference of 10 or more kV between the emitter and the extractor, the electrostatic pressure overcomes the surface tension forces on the liquid, and the liquid surface evolves into a conical structure known as a Taylor cone [31]. At the apex of the Taylor cone, the electric
(a)
(b)
Reservoir V>Vs W tip Taylor Cone ---- ExtractorI
Ion BeamFigure 1-4: (a) LMIS basic setup (b) Gallium ion source in operation (from [9])
field is of the order of several V/nm, which triggers direct ion evaporation from the liquid surface.
Several ion species can be produced from LMIS, although the list of available species is limited. Metals used in LMIS must have low vapor pressures for vacuum operation as well as low melting points, since operation at high temperatures can lead to reactions with the substrate and also promote the evaporation of neutrals. Sources capable of producing Ga, In, Bi, Al, Sn, Cs, and Au have been demonstrated. It is possible to obtain other elements including B, As, Si, Ge, and Pt if an alloy source is used, in which case the optical column will contain a Wien filter that separates and selects ion species based on their masses [24]. By far, the most widely used source in FIB is the Ga+ LMIS.
Ga+ LMIS have attributes that allow them to be routinely focused to sub-100 nm dimensions [9]. They emit currents of several pA, although they are usually operated at 2 pA in order to minimize the energy spread, which increases at higher currents. The minimum energy spread is 5 eV. At this current, the source has a current an-gular spread of 20 pAsr-1. The ion emission area at the apex of the Taylor cone is approximately 5 nm in diameter, but due to space charge effects from the high current density near the emission site, the beam spreads through Coulombic interac-tion, and the effective emission site is 50 nm in diameter. Using these values, LMIS brightness is estimated to be 106 Acm-2sr-1. The smallest probe size demostrated,
Ga+ LMIS FIB systems have become a tool for creating nanostructures through both substractive and additive processes. The large sputter yield 1 of Ga+ ions allows
removing material for patterning of nanoscale holes, arrays and channels [33]; the beam can also be used to perform 3D milling not accesible to other methods like conventional optical lithography [8]. Ga+ beams can also be used to perform ion implantation and growth of 3D structures with ion induced deposition.
Despite their widespread use, Ga+ FIB systems have key limitations. When pat-terning at scales below 30 nm, the focused beam has tails that perform undesired modification in the edges of the fine structures being created. In addition, use of Ga+ ions can lead to sample contamination, which is not acceptable in some applications; Ga+ contamination can affect both electrical and magnetic properties of a device [32].
1.2.3
Gas Field Ionization Sources
Gas Field Ionization Sources produce beams of ions from noble gases by virtue of field ionization [22]. The basic GFIS setup is shown in Fig. 1-5. A sharpened tungsten needle, with a radius of curvature of ~ 100 nm, is placed in front of an extractor. A voltage difference of a few kV is applied between the emitter and the extractor, so that fields in the order of 10 V/nm are achieved at the tip. A gas (usually noble) is introduced near the tip, in order to supply the particles to be ionized. The emitter must be cooled cryogenically in order to increase the density of atoms available for ionization. Once an atom is in the vicinity of the tip, it is possible for the atom to be ionized by quantum mechanical tunneling of the electron into the metal, as the energy barrier has been distorted by the electric field. The resulting positive ions are accelerated away from the tip by the electric field. Several ion beams are obtained, one from each emitter atom involved in ionization.
FIB systems using GFIS had been demonstrated in the 1970s by the group led by Levi-Setti [4] and Orloff and Swanson [23]. Probe sizes of 50 nm with current densities of 10 pA were demonstrated [24]. Nonetheless, these ions sources were difficult to
'Sputtering yield is defined as the ratio of the number of atoms removed from the sample to the number of incident ions
W tip, <100 nm
diameter
Extractor Ion Beams
Figure 1-5: Basic GFIS setup
maintain, had current fluctuations if any impurities were present in the source gas, and the current densities achievable were too low in comparison with the LMIS, so they were not implemented widely in FIB [32]. Recently, however, improvements in the tip construction and geometry have allowed implementation of these sources in FIB systems.
In a generic GFIS, the tip is roughly a few hundreds of atoms in diameter, and the ionization of the gas is distributed between all these atoms, as shown in Fig. 1-6. However, by sharpening the tip to be only three atoms at the apex, it is possible to concentrate the total gas supply to these three atoms instead of the hundreds of atoms in the blunter tip [35]. Such a tip can be produced reliably and can last months in operation. Using He, the source produces three main beamlets, of which one is selected for focusing. The source size is approximately 3
A,
and the current density is 2.5 pAsr-1, giving a brightness of 4 - 10' Acm-2sr-. In addition, the source has an energy spread of less than 1 eV; these properties allow it to be focused to an ultimate spot size of 0.25 nm. This improved He+ source has been implemented in FIB as an ultra-high resolution microscopy tool. Scanning electron microscopes have probe sizes of down to 1 nm, but incident electrons will interact with the sample through an extended volume and produce signals from an area larger than the probe size. Helium ions, with a much larger mass, will keep going straight through the sample and have a smaller interaction volume, thus producing signals from a smaller area than electrons would, and giving images with improved resolution (Fig. 1-7(a)).(a) (b)
O 91
(c) (d)
Figure 1-6: (a) Blunt GFIS tip, emitting many beamlets from ionization disks located above atoms (b) Beam pattern produced by GFIS (c) Super tip, emitting beamlets only from topmost atoms (d) Few beamlets produced by super tip [35]
Furthermore, helium ions can be used to pattern materials at scales not accesible by LMIS; it is much easier to produce sub-10 nm structures using a He+ beam than Ga+, as Ga+ FIB require dedicated optics to achieve the smallest probe sizes, and because of the Ga+ beam tail effects explained above. An example of patterning in graphene
by He+ is shown in Fig. 1-7(b).
Despite their resolution capabilities, He+ systems are limited in their throughput for machining applications, as the current achieved in the probe cannot exceed 30 nA, and because He+ ions are not as efficient as Ga+ in material removal. Neon, which should be more effective than Helium in sputtering due to its larger mass, has also been introduced in a GFIS and used for sub-10 nm lithography [36]. Neon ions are still less effective than Ga+ in sputtering, and the Ne+ technology is incipient. GFIS FIB systems are also complex, as they require both cryogenic cooling, high-purity gases and ultra-high vacuum operation.
(a) (b)
HIM SEM
Figure 1-7: (a) He Ion Microscope (left) vs. Scanning Electron Microscope images (right). Note the finer topography details in the HIM image. Both images have 20 pm field of view [35] (b) 5 nm ribbon patterned on graphene using He FIB [12]
1.2.4
Other Ion Sources
Ion sources of lower brightness and energy spreads than LMIS and GFIS have been mentioned in the literature, and although they cannot reach the same level of resolu-tion of the two sources we have discussed, they can be of advantage in applicaresolu-tions requiring rapid milling or other ion species. We mention three plasma ion sources and an electrolyte ion source:
* Inductively Coupled Plasma (ICP) Source. In ICP sources, a plasma is
created inductively by an RF antenna, and ions are extracted from the plasma chamber through an aperture of 200 pm in diameter [30]. Beams of Ar+ can be produced, with a brightness of 4590 Acm 2sr 1 and an energy spread of 7 eV, as well as Xe+ beams with brightness of 10500 Acm 2sr- and spread of
10 eV. These sources have current densities of several mA sr 1, considerably
larger than those of Ga+ LMIS, but the low value of the brightness results from the effective source size of ~ 10 pm. ICP sources cannot compete with the Ga+ LMIS in producing small beam sizes, although ICP sources are capable of producing sub-100 nm probes, albeit at limited probe currents. ICP sources do become useful, however, if probe sizes of several hundreds of nm are desired (for instance, for removal of bulk material). In this case, the ICP can give much larger current densities than a Ga+ LMIS thanks to the superior current emitted. The larger current density, coupled with the sputter yield of heavy
ions like Xe+, is beneficial for rapid milling applications. Furthermore, ions like Ar+ or Xe+ do not have the same issues with contamination as Ga+.
" Multicusp Plasma Ion Source A source of this type was described by
Scipi-oni et al.
[29].
A plasma is formed in a 50 cm3 volume by a filament discharge,with electrons confined by a multicusp magnetic field, and the ion beam exits through a 1 mm diameter aperture. Beams of inert ion species such as Kr+, Ne+, and He+ have been produced by this source, although their brightness does not exceed 2000 Acm-2sr- 1 and so sub-100 nm probes are impractical.
" Penning Type Plasma Ion Source Guharay et al. [10] developed a Penning
surface plasma source capable of producing both positive or negative ions. The authors report H- beams with brightness of 5 -104 Acm -2sr-1, with less than
3 eV energy spread. This source has the unfortunate need for pulsed operation
and has not been developed further, but is one of the few ion sources of relatively high-brightness capable of producing negative ion species, which, as will be explained later, could be beneficial for applications where charging of samples
is not desired.
" Solid Electrolyte Ion Sources Escher et al. [3] demostrated an ion source
based on the solid electrolyte (AgI)o.5(AgPO3)o.5. In the solid electrolyte, mobile
ions (such as Ag+ for Escher's source) can move freely; by shaping the electrolyte as a sharp tip and placing it in front of a metallic extractor, it is possible to extract the mobile species by applying a voltage difference of several kV. The source tested by Escher et al. could sustain pA over several days. These sources have not been developed further, but could potentially provide many other species, such as Cu+, F-, 02- and H+, by choosing an appropriate electrolyte.
From this survey of ion sources for FIB, it is clear that although several ion species are accessible, there is a need to develop ion sources of brightness comparable to LMIS, capable of providing a greater variety of ion species, especially negative ions.
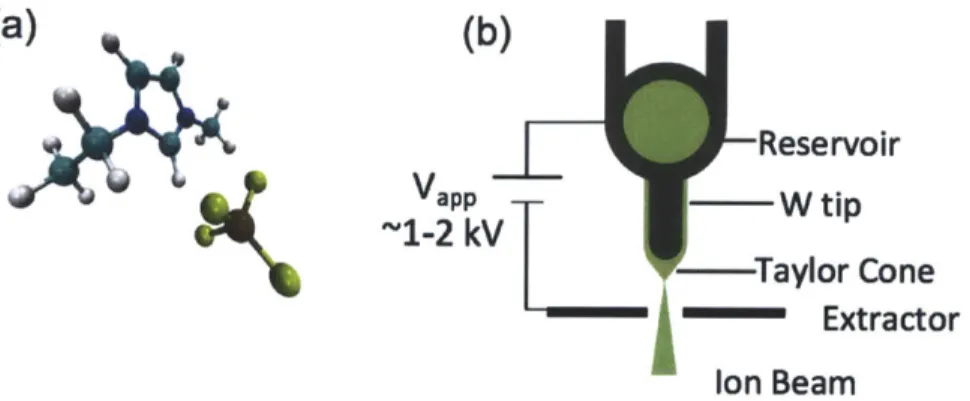
(a)
(b) Reservoir VappW
tip -1-2 kVT--Taylor
Cone Extractor Ion BeamFigure 1-8: (a) EMI-BF4, C6N2HhBF- Courtesy T. Coles (b) ILIS basic setup
1.3
A new hope: Ionic Liquid Ion Sources
Ionic Liquid Ion Sources have been recently proposed as a new tool for FIB [19, 37, 6].
ILIS are very similar to LMIS, but instead of relying on the field evaporation from liquid metals, ILIS beams are obtained from field evaporation of ionic liquids, or room-temperature molten salts. These substances are a mixture of complex organic and inorganic ions, which have negligible vapor pressures, making them apt for oper-ation in vacuum. In addition, ionic liquids have high conductivities and low surface tensions, which make them capable of being electrostatically stressed into a Tay-lor cone to obtain ion evaporation. An example ionic liquid, EMI-BF4,
1-ethyl-3-methylimidazolium tetrafluoroborate, is shown in Fig. 1-8(a).
The ILIS consists of an electrochemically sharpened tungsten needle-the emitter-coated with an ionic liquid (Fig. 1-8(b)). As in LMIS, the emitter is placed in front of a downstream metallic extractor, and a potential difference of 1-2 kV is applied between the emitter and the extractor in order to stress the liquid meniscus into a Taylor cone, from which ion emission is obtained.
ILIS have several key novelties that could be beneficial in FIB processes:
1. ILIS are capable of producing either positive or negative ion beams, by simply
reversing the polarity of the applied potential. Negative ion beams can be of advantage in applications where the target is a dielectric sample; when a sam-ple is irradiated with an ion beam, secondary electrons will be emitted from it. As a result, a non-conductive sample starts charging positively. If irradiated
(a) .(c)LMISIGFIS C_ LMIS/GFIS ILlS
Beam Beam Beam
Sputtered Volatile Volatile
Particles Gaeti
* *
0Compounds O0 CompoundsGases0
Substrate Ausrt Substrate O0
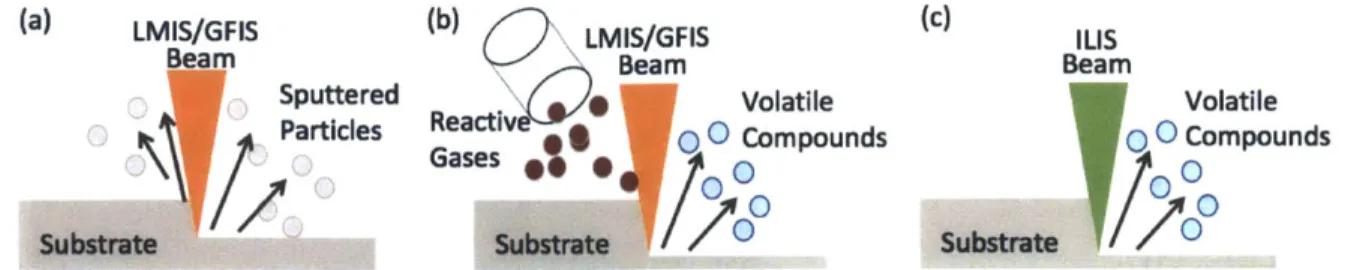
Figure 1-9: (a) Pure mechanical etching (b) Mechanical etching with reactive gas
assistance (c) ILIS milling with reactive ions does not require gas assistance
with positive beams, the sample will charge even more positively. This charging results in the creation of a local electric field that will distort the incoming ion
beam, and therefore blur the pattern being written. If using negative beams,
the charging issue can be alleviated without the need for electron flooding
sys-tems that are usually used to compensate for positive charging with other FIB systems.
2. ILIS have the potential of producing a completely new selection of ion species,
for example heavy molecular ions and reactive ions, as there are many ionic
liquids described in the literature that could be used in ILIS. If using reactive ions in etching applications, a combination of physical erosion from the incident ions with chemical reactions at the surface could enhance the etching rates. In FIB, it is common practice to introduce reactive gases such as XeF2 near the
specimen. The gases react readily with the surface under the ion beam influence,
create volatile species that aid in material removal, and therefore accelerate the
milling process. This is depicted in Fig. 1-9 (a),(b). If using ILIS beams with
reactive species such as I-, BF4 and Cl-, there is no need for introducing
reactive gases in the chamber to achieve large milling rates (Fig. 1-9(c)). It has been demonstrated that beams obtained from the liquid EMI-BF4 are
capable of etching silicon at rates faster than typical Ga+ mechanical sputtering.
A silicon wafer covered with copper grids was irradiated with an ILIS beam at 15 keV landing energy; after removing the copper grids, which acted as masks,
the pattern was transferred to the silicon substrate (Fig.1-10). The sputtering
(c) (a)
(a) Extractor ILlS tip V extractor (15kv) (12.5kW) Figure 1-10: (a) ILIS irradiation, Cu grids (mask) Si Wafer (b)
Experimental Setup for ILIS etching experiments (b) Si wafer after with grid pattern transferred onto substrate
yield was measured to be from 5 to 35 atoms of silicon removed per incident ion, compared to yields of 2 for Ga+ ions at the same energy. [26]
3. ILIS operation is simpler than LMIS/GFIS, as ILIS emit at room temperature
with no need for ultra-high vacuum.
These novelties should make ILIS ideal candidates for FIB utilization. In the next chapter, we will discuss in detail the physics of electrospray emission from ionic liquids. We will also mention the optical properties of ILIS relevant for FIB and previous work related to ILIS-FIB development.
Chapter 2
Physics of Ionic Liquid Ion Sources
In this chapter, we provide a review of the physics of ion production in ILIS and discuss the optical properties of ILIS relevant for FIB. We revisit Taylor cone forma-tion, review the Schottky model of ion evaporation and derive a simple model of the emission site. We then mention brightness estimates for ILIS and give a review of the energy distributions of these sources. The chapter ends with a discussion of the probe sizes that could be reached by an ILIS based FIB.2.1
ILIS Basic Physics
2.1.1
Taylor Cone formation
When the interface between an electrically conducting liquid and an insulator (often air or a vacuum) is charged electrically beyond a certain critical level, it becomes unstable and evolves from a rounded meniscus to a stable conical structure known as a Taylor cone [7]. It is possible to gain insight into the shape of the cone and the
electric field distribution through a simple analysis.
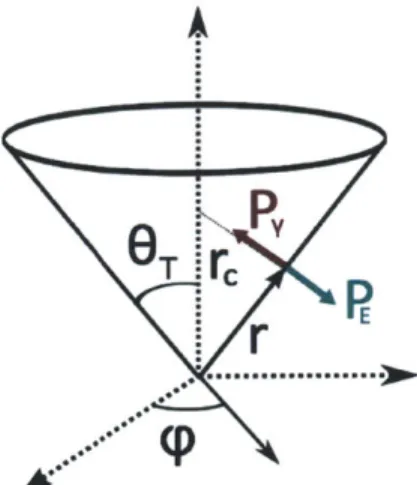
We first solve for the electric field at the surface of the cone. Consider a cone of half-angle OT, with the origin at the apex of the cone, as shown in Fig. 2-1. We
consider three stresses that act on the liquid: (1) the hydrostatic pressure difference with the medium, (2) the surface tension pressure and (3) the electric field stresses.
P
A
T Ecr
Figure 2-1: Diagram of a Taylor Cone.
Let Ap be the pressure difference between the liquid and the surrounding medium. The pressure due to surface tension is given by P = -yr, , where -y is the surface tension of the liquid, and , is the surface curvature. A distance r from the apex of
the cone, K is given by
1 _cotOT7
I
-OT (2.1)
Tc r
The liquid is assumed to behave as a perfect conductor, i.e., the relaxation time
has transcurred (~ 0.1 ns for an ionic liquid), so that all free charges have migrated to the surface of the conductor. The electric field is normal to the surface of the cone and zero inside the cone. With this assumption, the electrical pressure on the
surface of the cone is given by the normal component of the Maxwell stress tensor,
PE = 60n.
Balancing stresses, we obtain
-oEt+ Ap - T = 0 (2.2)
2 r
We assume we have no active pressure feed to the liquid, and we will assume that there are no pressure drops along the liquid due to viscosity effects. If we have no active pressure feed to the liquid (i.e. Ap = 0), the electric field along the surface of
the liquid is given by
E= 2 Cot IT
(2.3)
We proceed to find the electric field around the Taylor cone. If we assume no space charge in the region surrounding the cone, the electric potential D must satisfy Laplace's equation:
V2<D = 0 (2.4)
In our axisymmetric problem, there is no dependence on the azimuthal coordinate
(
= 0), and this equation 2.4 reduces tor + 2 (sin 0 = 0 (2.5)
r 2 r
Or
r2 sin 0 00 0The solution to equation 2.5 is a combination of functions including Legendre func-tions
Q,,
P,4D (A,Q,(cos 0) r' + BP,(cos 0) r') + (o (2.6)
V
Here, v can be any real number, A, and B, are constant coefficients, and (o is a constant potential dependent on boundary conditions. We note that P, has a singularity for 0 = 7r; as this is a region of free space where the potential should be
finite, we must impose Bv = 0 V v. This potential solution should also be consistent with the electric field at 0 = OT, which requires
1@ - 2-ycotOT
E
r r 80
(
V
AQ'r"- C (2.7)eor
From here, we find that the only Legendre function permitted is that corresponding to v = 1/2, which implies the potential is of the form
1(r, 0) = A1/ 2Q1/2(cos 0)r1/2 + (o (2.8)
As we had considered the liquid to be a perfect conductor, the 0 = OT surface must
through r unless Q1/2(cos OT) = 0, which occurs for a cone half-angle of 49.29'. We
note that this half-cone angle is independent of the liquid or the applied potentials. This analysis predicts well the shape of observed electrified menisci, but it is not an exact treatment. The solution for the field in equation (2.3) has a singularity at
r = 0, which is not physical. The equilibrium breaks close to the apex of the cone,
and emission of charged particles under different regimes can occur depending on the liquid conductivity or on the flow rates supplied to the cone. The most-studied of these regimes is the cone-jet regime, in which the apex of the Taylor cone deforms into a thin jet that eventually breaks apart into a spray of charged drops and ions
[7].
However, if the conductivity of the liquid is high or the flow rate of liquid to the cone is small, the jet size is reduced, and eventually it is possible to eliminate the jet and obtain pure ionic emission with no intervening droplets. This is the case for Taylor cones from liquid metals, and for ionic liquids.In 2003, Romero-Sanz et al. [28] demonstrated pure ionic emission at low flow rates from a capillary emitter using the ionic liquid EMI-BF4. Later on, Lozano and
Martinez-Sanchez [17] obtained ionic emission from the same liquid using externally-wetted tungsten emitters, which came to be Ionic Liquid Ion Sources. Larriba et. al used this geometry to produce beams of ions from other ionic liquids [13], and so far every ionic liquid tested with this configuration has produced beams of ions with no intervening droplets.
In this thesis, we will only discuss ion evaporation, as ILIS operate in the purely ionic regime. Information on the cone-jet regime can be found elsewhere [7].
2.1.2
Ion Evaporation and Emission Site
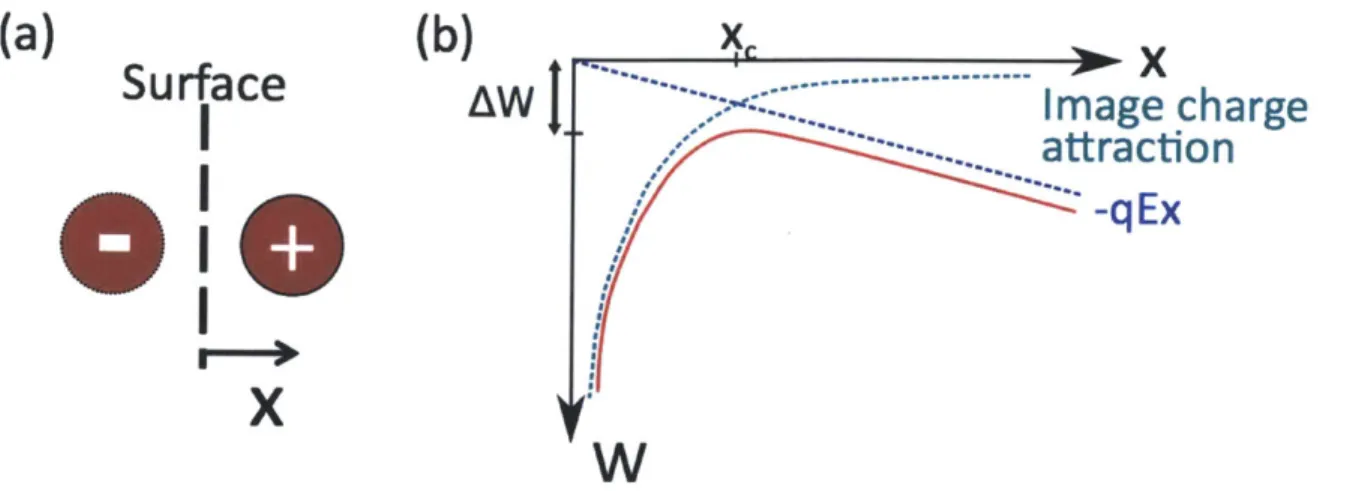
In ILIS, we have evaporation of ions from a region close to the apex of the cone. For FIB, it is important to know the size of the emission site and the corresponding current in order to estimate the brightness of the source, and to find this, we require the critical electric field required for ion evaporation. This field can be found via Schottky's model, which we review in this section. Having the field, we proceed to estimate the emission site size and the associated current.
(a)
(b)
Surface
---AW
--....
attraction
Image charge
O
O
-qEx
x
Figure 2-2: Field Emission. (a) Image charge diagram (b) Potential due to image charge and electric field
We first consider a liquid-vacuum interface with no external electric field. The rate of evaporation of ions is given by the Richardson-Dushman law,
3 = . exp ( G) (2.9)
h kT
where o- is the surface charge density, k is Boltzmann's constant, h is Planck's con-stant, T is the temperature, and AG is the energy barrier for ion evaporation, which is of the order of 1-2 eV for an ionic liquid [18]. At room temperature, the rate of ion evaporation is negligible, but it is possible to enhance it by applying an external electric field.
Let E be the externally applied electric field. We will consider the case of a positive ion of charge q evaporating from the liquid, although the argument is analogous for the negative ion case. The positive ion will experience two forces, the first an attraction towards the liquid from its image charge (see Fig. 2-2(a)), and the other the pull of the electric field away from the interface. A distance x away from the interface, the force felt by the ion is given by
-. q2
F= - 47rco(2x)2) X (2.10)
The potential energy corresponding to this force is the sum of the potential due to the electric field and the potential due to the image charge, as shown in Fig. 2-2b,
and is given by
W = -qEx - q (2.11)
167reox
From the potential energy diagram, we see that once the ion reaches a critical dis-tance xc, the attractive force is overcome by the electric field pull, and the ion ef-fectively escapes from the attractive potential. The potential barrier is efef-fectively lowered by an amount AW = -W(xc), thanks to the prescence of the electric field.
The critical distance can be found by maximizing 2.11, giving
qc = 4 (2.12) 16760E q3E AW = -W(xc) AW =(.3Fq E(2.13) = -Wxc) 47eo
Coming back to the Richardson-Dushman law, the energy barrier for evaporation is now AG - AW, giving
S= k- exp (AG - &3E (2.14)
h kT( 47eo
Equation 2.14 is known as the Schottky Emission model. We can see that for small electric fields the evaporation rate is limited, but once we exceed a critical field
4ireoAG2
E* = 37 (2.15)
q3
copious ion emission can be obtained. Taking q equal to the elementary charge and AG = 1.5 eV, we find E* ~ 1.56 V/nm. This means that, once we reach E, = E*,
ions can be produced from the Taylor cone.
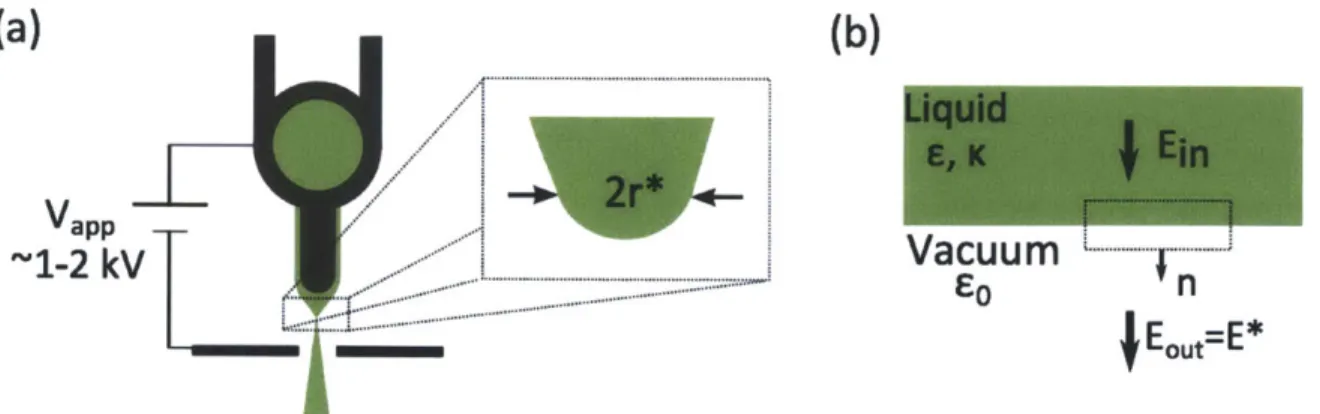
Ion emission will occur from a small region surrounding the apex, as shown in Fig. 2-3a. Let r* be the characteristic radius of the emission region. It is possible to solve for r* through the pressure equilibrium on the surface. However, in finding the electrostatic stresses, we cannot assume that the liquid behaves as a perfect conductor in this region, as charges are being removed from the surface and the liquid might
(a)
(b)
Vapp-~1-2
kV
Vacuum
. .
...
j
EOUt-"EFigure 2-3: (a) Emission site diagram
(b)
Liquid Vacuum interface and Gaussian pillboxnot fully relax.
Let us take the electric field just outside of the evaporation region to be equal to the field required for ion evaporation, E*, as shown in Fig. 2-3b. The internal electric field normal to the surface is Ei,; any contributions from tangential electric fields are neglected for this analysis. If we integrate Gauss' Law for an infinitesimally thin pillbox with boundaries along the vacuum and the liquid, the following relation for the internal and external electric fields must hold:
coE* - EcoEi = o (2.16)
where e is the dielectric constant of the liquid and o is the surface charge density on the interface. In the regions of the liquid where there is no evaporation, the surface charge must be EoE,, and the internal electric field is zero, as the liquid behaves as a conductor; however, in the evaporation region, the surface charge must be greatly reduced by the charge removal, and the internal electric field must be significant. Therefore, we neglect the right hand side of equation 2.16, and approximate Ei, as E*/e. The force balance on the surface of the evaporation region is now
1 1 (E*\ 2 2
-coE *2 - E() - 2--y (2.17)
which implies
r* =-(2.18)
cEoE*2 C _1
If we take E* = 1.56 -109 V/m, e ~ 10, and 'y = 0.0452 N/m [14] (approximate values for EMI-BF4), we find r* ~ 10 nm. Although this value is an approximation,
it indicates that ILIS could have competitive brightness for FIB.
We can also use this analysis to estimate the current produced by an ILIS. Let us suppose that the beam current corresponds to the liquid carried by conduction inside the meniscus. The current density is then
j
= kE, = kE*/e, where k is the conductivity of the liquid. If we assume that the current density constant is in the semi spherical cap from which emission occurs, the current isI = 27rr*2k (2.19)
E
Using k ~ 1 Si/m, which is the conductivity of EMI-BF4 at room temperature, the
current is estimated to be 85 nA. This value is slightly below the currents measured, which are of the order 100s of nA for operation at room temperature. There can be several reasons for this discrenpacy; Higuera [11] notes that the temperature could increase locally at the emission site due to ohmic dissipation, which would further increase the conductivity of the liquid. Furthermore, this analysis ignores the effects of convenction within the meniscus as well as the effects of concentration gradients near the emission site, where particles of the extraction polarity are depleted due to ion evaporation.
2.1.3
Starting Voltage
A Taylor cone will develop once the electrostatic traction forces overcome the surface
tension of the liquid. In this section, we follow the procedure given in reference [20] to find the required voltage applied to a liquid for it to sustain a Taylor cone. It is possible to find the starting voltage by solving for the electric field around an emitter and then matching the electrostatic pressure to the surface tension force, which is the
equilibrium condition under which the cone can be sustained. However, instead of solving for the field in the cone coordinate system as we did in section 2.1.1, we use a more convenient coordinate system that can take into account the overall shape of the emitter.
The prolate-spheroidal coordinate system is an orthogonal system with
coordi-nates (I,
#).
In terms of cartesian coordinates, the transformation isr1 - r2 r + r2 (2.20)
a a
where
ri= x2+y2+ z+ r2 = X2+y2(+ Z - (2.21)
Here, a is a scaling factor dependent on the overall size of the system, and
#
is the angle about the z-axis. In this coordinate system, the lines of constant r/ are confocal hyperboloids while the lines of constant are confocal ellipsoids with the same foci. We can take our emitter, which is a sharpened tip (with radius of curvature Rc) covered with liquid, to be approximately represented by a constant r = ro line, as shown in Fig. 2-4. The extractor can be represented by the rq = 0 plane, placed a distance d away from the tip.Before proceeding, we must find the relation between the tip-extractor distance d and the emitter radius of curvature Rc with the unknown scale factor a and
un-known rO. Along a constant r line, if R2 = x2 + y2, the z-coordinate can be expressed
as
a2 R2
z = - + iR2 (2.22)
Thus, at the tip, where R = 0, d = a r/o/2. Furthermore, the radius of curvature
p of the constant 7 surface is given by
1 - r(2 R2/a2
Z
Tip
:fl flo
,=const.
I I I I I # Ii 6 1 -*o 2d o -.'.' !lo .. ... .! . .. .. . 4 44 29g T hus, we find 7+ c -/a = 2d( .5 go=1+ d 1 + (.5
To find the electric field at the tip and the region surrounding the emitter, we solve Laplace's Equation for the potential, V2(D = 0, and impose boundary conditions. The
potential should be 4D = V on the emitter surface (,q = qo) and 4 = 0 on the extractor (,q = 0). Because of the boundary conditions, the potential can depend only on the Tj
coordinate, and so Laplace's equation reduces to
a (1 - 172) ab)= 0 (2.26)
89 44 By *
The solution to equation 2.26 is
(D = V _ah- 7 (2.27)
And from here, we can calculate the electric field at the point (x = 0, y = 0, z = d) and hence the electrostatic pressure at the apex of the emitter. The electric field at the apex of the emitter is given by
Eti, - - (2.28)
az 89 az
If we assume Rc
<
d (which is often the case, as for ILIS, Rc is about 10 pm and dis roughly a mm), the electric field at the tip reduces to
2Vo/Re
Et.,= (2.29)
- In (4d/Rc)
For the Taylor cone to exist, the equilibrium condition requires the electrostatic pres-sure at tip to match the surface tension, i.e.,
1 W 2 (.0
cOi(230 =)
and finally, by substituting 2.29 in 2.30, we find an expression for the start voltage:
Vstart = In 4d) (2.31)
60 Re
We note there is a weak dependence on the tip-extractor distance for the start-up voltage of an ILIS, but the key factors determining this onset are the surface tension of the liquid and the tip radius of curvature. For instance, for an ILIS wetted with the ionic liquid EMI-BF4, with Rc ~ 10 pm, and d = 1 mm, Vtart = 1350 V. This
value is of the same order as experimental values reported [17]. It has been verified that the start-up voltage increases as a function of tip radius [2], and we observe such dependencies in some of the experimental results presented in this thesis.
2.2
ILIS performance in FIB
2.2.1
Brightness and Energy Characteristics of ILIS Beams
As discussed in Chapter 1, an ion source's brightness and energy spread are key parameters in determining how well the beam can be focused.
We estimate the brightness than can be obtained from an ILIS by considering the size of the emission site. An ILIS can operate at a current of 600 nA, and the beam angular spread has been measured experimentally to be about 180 [17]. If we take the
size of the emission site to be D = 20 nm, we find a value of 3 = 6.16. 105 Acm-2sr-1.
This value is on the order of the quoted requirement, and could be improved by operating ILIS at higher currents (by increasing the operation temperature or using liquids of higher conductivity).
For FIB, it is of utmost importance to minimize the energy spread of an ion beam in order to limit the contributions of lens chromatic aberrations to the probe size. ILIS beams contain ion populations with energy characteristics that make them adequate for FIB; Lozano measured the energy profiles of several ionic liquids using Retarding Potential Analyzer (RPA) techniques. The author measured the beam after focusing it through an Einzel lens, used for guiding the beam into the detector. The use of the lens could filter out some of the particles coming at energies different from the main energy peak. Nonetheless, it was determined that a the majority of the beam has energy spreads of 6-8 eV for the liquids EMI-Im 1 and EMI-BF4, with energy
deficits of 6-7 eV[19, 16]. The deficit can be attributed to the energy required for ion evaporation, whereas the energy spread can be attributed to possible variations in the electric field along the finite emission site. This energy distributions are very promising for FIB, although we must take into account the energy distribution of the whole beam.
An ionic liquid composed of anions (A-) and cations (C+) will produce ion species
(AC),A- or (AC),C+, for the negative and positive extraction polarity, respectively,
and where n, the degree of solvation, is the number of neutral clusters attached to the
Figure 2-5: Diagram of break-up from n=1 to n=0
ion (n =0, 1 and sometimes 2). For example, previous time-of-flight spectrometry for the liquid EMI-BF4 indicates that the current in the beam is roughly equally divided
between the n=O and n=1 degrees of solvation [17], with some minor contribution of larger species. It was found that the heaviest species (n > 1) are metastable, and they can break during flight, yielding neutrals and a new ion. (see Fig. 2-5). From experimental observations, it is known that breakup can happen in regions of zero potential as well as in the acceleration zone between the emitter and the extractor
[19, 6, 5]. For FIB applications, these neutrals could lead to undesired effects in the
sample as they are not manipulated by optics. Furthermore, the break-up significantly affects the energy distribution of the beam, as we explain in this section. A concern of this thesis is determining the distribution of neutral particles within the beam.
A large fraction of the current in the beam corresponds to a monoenergetic
pop-ulation with an energy close to the applied potential, but there is also a poppop-ulation of ions coming with a continuum of energies below the main energy peak, since these ions are the result of breakup of larger species [19]. Ideally, all ions should have a
final kinetic energy K = qV,,pp, where V,,pp is the applied potential. However, if an
ion with degree of solvation n and mass m breaks into a neutral and ion with degree of solvation m (m < n) and mass mm, at a region with potential Vb (say, in between
the emitter and the extractor, where the potential varies from V,,pp to ground), then the final kinetic energy of the ion resulting from breakup will be
K. = qb + MMq | K,,_ - | . (2.32)
![Figure 1-1: FIB column outline, based on [9]](https://thumb-eu.123doks.com/thumbv2/123doknet/14241781.486899/16.918.376.527.112.357/figure-fib-column-outline-based.webp)