HAL Id: hal-01068120
https://hal.archives-ouvertes.fr/hal-01068120
Submitted on 25 Sep 2014
HAL is a multi-disciplinary open access
archive for the deposit and dissemination of
sci-entific research documents, whether they are
pub-lished or not. The documents may come from
teaching and research institutions in France or
abroad, or from public or private research centers.
L’archive ouverte pluridisciplinaire HAL, est
destinée au dépôt et à la diffusion de documents
scientifiques de niveau recherche, publiés ou non,
émanant des établissements d’enseignement et de
recherche français ou étrangers, des laboratoires
publics ou privés.
Modeling and simulation of drying operations in PVC
powder production line: Experimental and theoretical
study of drying kinetics on particle scale
Antoine Aubin, Renaud Ansart, Mehrdji Hemati, Thierry Lasuye, Marc
Branly
To cite this version:
Antoine Aubin, Renaud Ansart, Mehrdji Hemati, Thierry Lasuye, Marc Branly. Modeling and
sim-ulation of drying operations in PVC powder production line: Experimental and theoretical study
of drying kinetics on particle scale. Powder Technology, Elsevier, 2014, vol. 255, pp. 120-133.
�10.1016/j.powtec.2013.08.019�. �hal-01068120�
Any correspondence concerning this service should be sent to the repository administrator:
staff-oatao@inp-toulouse.fr
Identification number: DOI: 10.1016/j.powtec.2013.08.019
Official URL:
http://dx.doi.org/10.1016/j.powtec.2013.08.019
This is an author-deposited version published in:
http://oatao.univ-toulouse.fr/
Eprints ID: 9723
To cite this version:
Aubin, Antoine and Ansart, Renaud and Hemati, Mehrdji and Lasuye, Thierry
and Branly, Marc Modeling and simulation of drying operations in PVC powder
production line: Experimental and theoretical study of drying kinetics on
particle scale. (2014) Powder Technology, vol. 255 . pp. 120-133. ISSN
0032-5910
O
pen
A
rchive
T
oulouse
A
rchive
O
uverte (
OATAO
)
OATAO is an open access repository that collects the work of Toulouse researchers and
makes it freely available over the web where possible.
Modeling and simulation of drying operations in PVC powder
production line: Experimental and theoretical study of drying
kinetics on particle scale
Antoine Aubin
a,b,⁎
, Renaud Ansart
a,b, Mehrdji Hemati
a,b, Thierry Lasuye
c, Marc Branly
c aUniversité de Toulouse, INPT, UPS, Laboratoire de Génie Chimique, 4 Allée Emile Monso, F-31030 Toulouse, FrancebCNRS, Laboratoire de Génie Chimique, F-31030 Toulouse, France cINEOS ChlorVinyls France, Chemin des Soldats, F-62670 Mazingarbe, France
a b s t r a c t
Keywords:
PVC
Convective drying Fluidization Drying kinetic model Pneumatic dryer model
An experimental method to determine drying kinetic at a particle scale and a pneumatic dryer model are presented. The particle scale kinetics were obtained by immersion of a fixed mass of wet PVC particles (cake) in a batch dense fluidized bed containing inert hot particles (glass bead). It appears clearly that the PVC drying is controlled by a competition between internal and external transfers. The drying kinetic was described by a shrinking core type model and integrated in a one-dimensional steady-state model simulating a pneumatic dryer. A two-phase continuum model was used to describe the steady-state flow of a diluted dispersed phase (wet PVC powder) and a continuous phase (humid air) through dryer. The model takes into account the convec-tive heat, mass and momentum transfers. The numerical results are compared with industrial experimental data. The results show that the inlet temperature is the most important parameter in the operation.
1. Introduction
This study has been realized in the Chemical Engineering Laboratory in Toulouse in partnership with INEOS ChlorVinyls. In PVC powder pro-duction line, after the polymerization step, a suspension, composed of water and PVC particles, is obtained. Most of this suspension water is eliminated during a centrifugation step, leading to a wet porous pow-der, called cake (with a humidity between 0.2 and 0.35 kg of water/kg of dry PVC). The cake drying occurs essentially in a pneumatic dryer coupled with a fluidized bed dryer with a role of eliminating the residual humidity of PVC (less than 0.05 kg of water/kg of dry PVC). This opera-tion, which consumes a lot of energy, between 800 and 1500 kJ/kg dry PVC, in accordance to the operating conditions and the PVC grade, rep-resents 30% of the production cost. With the purpose of reducing drying cost, it is important to understand the different physical phenomena involved (mass transfer, heat transfer, hydrodynamic phenomena spe-cific to the dryers). This study focuses firstly on the acquisition of the kinetics data in a batch dense fluidized bed, and secondly on the model-ing of the dehydration of PVC particles in a pneumatic dryer.
The drying kinetic is obtained by immersing a small amount of PVC particles (mean diameter: 143 μm) in a hot fluidized bed filled with glass beads (mean diameter: 324 μm). These bigger particles' role is to
suppress the agglomeration phenomena between PVC particles and to realize the drying in isothermal conditions. The experimental results show that the drying kinetic is strongly dependent on air temperature and humidity.
These experimental results were represented according to a kinetic model based on heat and mass exchanges between PVC and air (external transfers), and heat and mass diffusion inside the par-ticle (intern transfers). That kinetic model is then included in a steady-state one-dimensional pneumatic dryer model, which simu-lates the industrial dryer.
2. Background
Porous media drying is a complex problem and still not well-understood despite of the numerous studies that can be found in the literature, due to the coupled exchanges (mass, heat, and momentum transfers) between the gas and the particles[1], depending on solid par-ticles' morphological parameters and water/solid affinity. As shown inFig. 1, during the drying of a porous particle, two periods can be dis-tinguished. The first period consists in the elimination of free water located at its surface. In this period the evaporation is controlled by external transfers which can be, in accordance to the dryer technology, e.g., conductive, convective or radiative. In our case (pneumatic and flu-idized bed dryer), these transfers are convective and depend on the local relative velocity between air and particles, called slip velocity. These transfers depending on the drying technology have been widely studied, and the literature provides a lot of correlations, sometimes
⁎ Corresponding author at: Université de Toulouse, INPT, UPS, Laboratoire de Génie Chimique, 4 Allée Emile Monso, F-31030 Toulouse, France. Tel.: +33 5 34 32 36 93.
E-mail address:antoine.aubin@ensiacet.fr(A. Aubin).
contradictory, for its estimation ([2–4]). In the second period, the water located in the particles' pores is eliminated: the drying is con-trolled by a combination between internal and external transfers. The internal transfers depend on the solid properties and structure. The literature shows that many elementary phenomena may occur during drying. Such phenomena are complex and depend on the structure of the solid particle, the water–solid liaison, and the water composition. These elementary mechanisms, represented inFig. 2can be ([5,6]):
• capillary forces, depending on liquid wetting on the solid surface (γLV⋅ cos(θ)), temperature and particle pore size and distribution. These last properties affect the saturation water vapor tension at the solid/liquid interface and the internal liquid movement in the pores.
• vapor diffusion through the pores under the influence of tempera-ture and water vapor partial pressure,
• solid diffusion, corresponding to bound water migration on the solid surface. This mechanism occurs in the case of a solid partially dissolved in water and with a strong liaison between water and solid (chemical interaction, hydrogen liaisons, …).
Thus, the modeling of a wet particle drying by hot air has to consider: water evaporation at the particle surface during constant drying rate period, and the movement of an evaporation zone between the wet core and the dry crust of the particle. This zone progresses from the par-ticle surface to its core. Several numerical simulations were realized on porous material ([7,8]). The thickness of that drying zone is due to the wetting properties of the liquid in the pores: if the wetting is perfect, the liquid can spread on the pores' internal surface and affect the ther-mal gradient[9].
In the present case, the wetting properties of PVC, which depends on the superficial tension (γLV) of the aqueous solution introduced
during the polymerization step and the affinity between the solid particles and this solution, are represented by the contact angle (θ). The low values of liquid superficial tension and high values of the contact angle (between 80° and 94.7°[10,11]), lead to suppose that the drying zone could be modeled by a surface of discontinuity.
Concerning the capillarity effect, the pore-size distribution of a PVC particle, presented in Fig. 3, shows that the minimal pore size is about 30 nm. The Kelvin law expresses water activity (pw/p°) as a
function of pore radius and shows that, for pore radius higher than 10 nm, the water activity is equal to 1. Hence the capillary effect does not influence the liquid/water equilibrium in this study. Concerning the solid and liquid diffusion, previous analysis on INEOS's PVC shows that it is non soluble in water and that the PVC has a small affinity
Fig. 1. Different phases of the particle drying.
Fig. 2. Internal transfer in a porous particle[23].
Fig. 3. Pore size distribution of a PVC particle, determined by mercury porosimetry (Micrometrics — Autopore IV).
with water. For example, in an atmosphere with 75% of relative hu-midity, the equilibrium humidity of PVC is 2.4 g of water/kg of dry PVC (at 50°C). Hence the liquid and solid diffusion can also be neglected in this study, and the only internal transfer remaining is the vapor diffu-sion. This mechanism is influenced by temperature and water vapor partial pressure gradients.
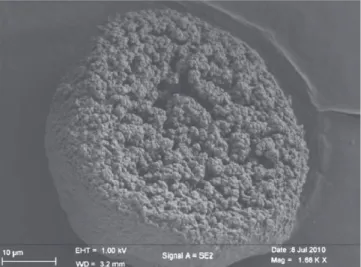
The SEM picture of a PVC particle (Fig. 4) shows a typical pellet– grain structure [12], indeed each particle is a primary particle stack. With such a structure two pore families can be distinguished (Fig. 3):
•the space between the primary particles (pore size superior to 250 nm), which is macroporosity (the average size of these pores is 3335.6 nm). These pores are dried in the pneumatic dryer (93% of pore volume). •the primary particles' own porosity (pore size inferior to 250 nm),
which is mesoporosity (the average size of these pores is 81.6 nm). These pores are dried in the fluidized bed dryer (7% of pore volume).
A shrinking-core type model is used by numerous authors ([13–16]) to represent the evaporation front evolution with particles having a pellet–grain structure. In this kind of model, the particle is divided into two zones: a wet core, which shrinks over time, and a dry crust, through which the evaporated water diffuses to the particle surface. The elementary mechanisms involved here are conductive heat transfer (from particle surface to its core) and water vapor diffusion through the pores. If the heat transfer leads the drying phenomena, the problem is analogous to the classical Stefan problem for drop evaporation or freez-ing ([17,18]).
Concerning the pneumatic dryer, this technology is commonly used in order to eliminate free or barely-bound water. A pneumatic dryer is a continuous, convective dryer with a diluted solid transport. This technology presents numerous advantages ([19,20]) such as: •the short resident time of particles allows the drying of thermosensible
product,
•in parallel flow, high temperature can be applied at the inlet, resulting in a high thermal efficiency,
•the dryer can be used as a transport system.
From a hydrodynamic point of view, pneumatic drying is analogous to pneumatic conveying. Hence several pneumatic conveying models ([21,22]) have inspired the pneumatic drying models presented in the literature. These models ([4,23–25]) consider the interactions (mass, heat, and momentum transfer) between a gas phase and a dispersed phase coupled with internal mechanisms.
3. Material and methods
The experiments were realized with a cake provided by INEOS Chlorvinyls France (the properties are presented inTable 1). The particle size analysis realized on dry particles shows a Gaussian-type dis-tribution with a mean particle diameter of 144 μm. The characteristic sizes presented inTable 1are determined by laser granulometry (Malvern Mastersizer 2000–Sirocco 2000 — ±0.1 μm). The particle density, porosity, tortuosity, and pore-size distribution (Fig. 3) were deter-mined by mercury porosimeter on dry product (Micrometrics — Autopore IV — ± 0.1 nm). To determine the cake humidity, different samples were placed in a ventilated oven at 50 °C during 24 h: the cake initial humidity varies between 0.195 and 0.205 kg of water/kg of dry PVC.
Preliminary experiments realized in a convective dryer have shown that the drying kinetic strongly depends on the external conditions (sample weight and thickness, air flowrate, …). The study of the physical phenomena at a particle scale is then difficult to realize. Hence, just as several studies realized in our laboratory, ([26,27]) the drying kinetic is studied by immersing a small sample of wet PVC (about 3 g) in a hot fluidized bed containing 1.3 kg of glass beads with a mean particle diameter of 324 μm (see properties in Table 1).
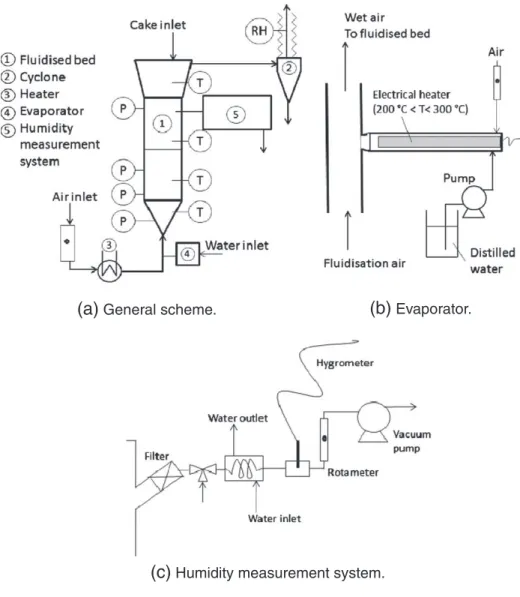
The experimental pilot is represented inFig. 5. The dryer is com-posed of a 10 cm diameter and 40 cm height glass column. The presence of an extended section on the top prevents the fine parti-cles to be elutriated. The fluidization air is pre-heated in an electri-cal heater, and when it is necessary, mixed up with water vapor produces by an evaporator as shown inFig. 4. A water flowrate is spread on an electrical heater. The water is instantaneously evapo-rated and carried into the warm air stream. The fluidization flowrates (velocities) are chosen in agreement with the character-istic velocities (minimal fluidization and terminal settling velocity) of PVC particles and glass beads. These values determined at ambi-ent temperatures are presambi-ented inTable 1. The air velocity range chosen is from 25 to 40 cm/s, which corresponds to 3 and 4.5 times the minimal fluidization velocity of the glass beads.
The dryer is equipped with several temperatures (± 0.1 °C) and pressure (± 0.1 mbar) sensors and two capacitive hygrometers (temperature and humidity sensors). As shown inFig. 4, a vacuum pump collects the wet air to measure its humidity. The measure-ment system, whose role is to ensure that the humidity measuremeasure-ments are realized at constant conditions (air flowrate and temperature), is equipped with: a filter to prevent particles to damage the sensor, a thermostatic bath to maintain a constant temperature and prevent con-densation phenomena, the hygrometer, and a rotameter to maintain a constant flowrate. This hygrometer measures the air dew point with an accuracy of 0.1 °C. This hygrometer measurement is controlled according to a second hygrometer (which measures the relative humid-ity with an accuracy of 0.1%) placed at the cyclone outlet. To avoid
Fig. 4. SEM picture of a PVC particle.
Table 1
Powder PVC and glass bead physical properties (* experimental measurement ± 0.1 cm/s).
Properties PVC Glass beads
d50(μm) 144 324 d10(μm) 104 233 d90(μm) 199 450 d3,2(μm) 139 314 p (kg/m3) 1175 2500 τ (−) 3.0115 – χ (%) 37.7 – λp(W/(m · K)) 0.17 – Cp (J/(kg · K)) 1670 – Umf⁎ (cm/s) 1.2 8.8 Ut(cm/s) 65.3 242.5
condensation near the sensor, the pipe is heated with heater cables. Both hygrometers are coupled with a data acquisition system, which permits to record the temporal evolution of air humidity.
A previous study, realized on the hygrometers, showed that the response times of the sensors are not neglectable regarding the opera-tion time. Indeed, the response time to a humidity step signal (i.e., tran-sition from a dry air atmosphere to a wet air atmosphere) is about 40 s while the time of the experiments occurring in the fluidized bed is about 1 min (Fig. 6). This study was realized with both hygrometers by switching from a dry air atmosphere to a wet air atmosphere (room atmosphere), according to the three-way valves for the hygrom-eter placed in the humidity measurement system, and by removing suddenly the sensor from the pilot. The sensor response is modeled by the association of a plug-flow reactor (representing the lag during the first seconds of the experiments) and a batch reactor with a time con-stant of 9.5 s (Fig. 5). The experimental and numerical responses of the hygrometer to a humidity step are presented inFig. 5. As this transfer function models correctly the hygrometer behavior, it is used for the kinetic result exploitation and modeling. So it is impor-tant to differentiate the experimental kinetic, given by the raw re-sults of the sensor, and the inherent kinetic: the real drying kinetic in the fluidized bed.
The temperature range chosen is from 30 to 60 °C: if the bed tem-perature is higher than 70 °C the PVC surface becomes sticky and can cause an agglomeration in the bed. The influence of surrounding air rel-ative humidity is studied from 1.2 to 63.1%.
4. Methodology
The temporal evolution of the outlet air relative humidity (RH), recorded during each experiment, permits to calculate at each instant Y, the absolute air humidity (in kg of water/kg of dry air) and so, Wdrying,
the drying flowrate (in g of water/s), knowing the dry air flowrate (Fg0in
kg/s) going through the dryer:
Y ¼ 0:622 ! RH ! pB Tð hÞ P−RH ! pB Thð Þ ð1Þ pB Tð hÞ ¼ exp 16:83 ! Th 228:74 þ Th þ 6:4075 ! ð2Þ Wdrying¼ F0g! Y ð3Þ
with Thas the temperature measured by the hygrometer (in°C), p°(Th)
as the saturated water vapor pressure at this temperature, and P as the absolute pressure in the dryer.
By integrating the curve representing the temporal evolution of the drying flowrate, the amount of water evaporated during the time t (mw)
and the total amount of water evaporated during the experiments
(a)
General scheme.
(b)
Evaporator.
(c)
Humidity measurement system.
(mw0) were determined. These informations enable the calculation of
the initial (X0) and the instantaneous (X) solid humidity (with m0as the dry sample weight).
X ¼mw0−mw
m0 and X0¼
mw0
m0 : ð4Þ
The calculated initial humidity corresponds to the initial humidity measured in the ventilated oven at 50 °C during 24 h with an error inferior to 5%.
The temporal evolution of the normalized solid humidity (X/X0), represented inFig. 7, is used to determine characteristic times. t75, t50, t25, and the drying time, tdry, correspond to the time necessary
for the normalized solid humidity to reach, respectively, 0.75, 0.50, 0.25, and 0.05.
5. Preliminary results
The cake (wet PVC) is a very cohesive powder, so the particles tend to agglomerate themselves. This phenomenon reduces external and internal transfers. Indeed the bigger the particles are, the lower the con-vective transfer is. In the same way, the internal transfer is reduced with particle agglomerates as the water vapor has a longer diffusion path. So the evolution of outlet air humidity during batch drying is evaluated with cake samples of different masses. The initial calculated humidity was compared to the real sample's humidity. This study showed that the optimal sample mass is between 2 and 4 g of cake. Indeed with inferior mass the sensor precision is too low, and with higher mass the sample is too sticky to disperse and the results are not reproducible. To reduce this phenomenon, the sample is mixed up with glass beads at
ambient temperatures before being introduced in the fluidized bed. This proceeding breaks the bounds between wet particles, and so improves the sample dispersion in the bed.Fig. 8shows that the glass bead mass ratio has an influence until 25%. For higher values, the drying time stays constant. Hence, the following experiments are realized with a glass bead mass ratio of 30%.
Fig. 9a and b shows an example of the results obtained with the experimental conditions summarized inTable 2(Experiment 1). It can be observed that:
• the drying time is about 30 s, which is close to the response time of the hygrometers,
• there is an initial 3 s lag, due to the sample injection and the time needed for the wet air to reach the hygrometer,
• the absolute air humidity and the drying flowrate have a similar evolution,
• the bed temperature decrease during the experiments stays below 1 °C, which shows that the drying is effectuated in isothermal conditions.
InFig. 8the evolutions of the normalized solid humidity versus time for different experiments realized in the same conditions (Exps. 1, 2, & 3) are presented. This figure shows that our experimental system is reproducible and the variance of t50is less than 1 s.
6. Experimental results
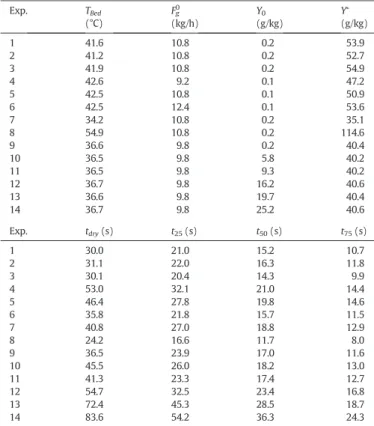
Table 2sums up the experimental data (bed temperature, inlet air absolute humidity, and air velocity) and characteristic times: t25, t50,
(a)
Comparison between numerical and experimental results
(b)
Hygrometer transfert function
Fig. 6. Hygrometer response to a step signal.
Fig. 7. Definition of the characteristic times.
Fig. 8. Evolution of solid humidity for different fraction of glass beads. Air velocity: 32.3 cm/s; Tbed= 34.2 °C; cake weight: 2.9 g.
and t75. Moreover the saturation air humidity (see Eq.(5)) is presented in this table.
Y%¼ 0:622 ! pB Tð BedÞ
P−pB TBedð Þ: ð5Þ
The effect of bed temperature, air velocity, and air initial humidity on the drying kinetic is presented inFigs. 10, 11, and 12. They show that the drying is extremely fast even at low temperature. In the op-erating conditions used, the drying time stays below 85 s. It is impor-tant to note that this is overestimated because of the hygrometer
response time. These results also show that even in a strongly stirred dryer, as the fluidized bed, the external transfer resistance is not neglectable. These resistances, controlled by the hydrodynamic pa-rameters of the system, determine the energy and mass flow ex-change between the dryer atmosphere and the PVC particles.
Indeed, the experimental results inFig. 10show that a rise of the air flowrate from 9.2 to 12.4 kg/h decreases the drying time from 53 to 36 s. The higher the air velocity is, the higher the relative velocity between the air and the particles is. Hence, the mass and heat transfers are increased and the drying time is shorter. Regarding the bed temperature effect, the results presented inFig. 11show that a rise from 35 to 55 °C strongly decreases the drying time from 40 to 24 s. Indeed, a bed temperature in-crease will improve the heat transfer between the fluidized bed and the particles but also the mass transfer driving force (Y∗
− Y).
Fig. 12shows the influence of air humidity on the drying kinetic and drying characteristic times and presents the evolution of the normalized solid humidity versus time. These results show that a rise of the air absolute humidity from 16 to 25 g of water/kg of dry air increases the drying time from 55 to 84 s. This can be explained by the effect of the drying driving force: a rise of initial humidity results to an increase of Y and so there is a drying driving force reduction.
All these results show that the drying kinetic of PVC particles is directed by both external and internal humidity transfer.
7. Kinetic model
From our experimental results and knowing the properties of the PVC powder, we determined a kinetic law. This law is implemented in a model simulating our experimental setup: the kinetic model. In this section, we described the hypothesis and the equations of this model, and, in order to validate it, we compare its results to our experimental results.
(a)
Absolute air humidity& drying flowrate evolution (Exp.1)
(c)
Reproductibility results: Evolution of normalised solid
humidity (Exp. 1, 2, & 3)
(b)
Solid humidity and bed temperature evolution (Exp. 1)
Fig. 9. Typical results example obtained during the drying of 2.9 g of wet PVC in fluidized bed at 41.6 °C with an air mass flowrate of 10.8 kg/h.
Table 2 List of experiments. Exp. TBed (°C) Fg0 (kg/h) Y0 (g/kg) Y∗ (g/kg) 1 41.6 10.8 0.2 53.9 2 41.2 10.8 0.2 52.7 3 41.9 10.8 0.2 54.9 4 42.6 9.2 0.1 47.2 5 42.5 10.8 0.1 50.9 6 42.5 12.4 0.1 53.6 7 34.2 10.8 0.2 35.1 8 54.9 10.8 0.2 114.6 9 36.6 9.8 0.2 40.4 10 36.5 9.8 5.8 40.2 11 36.5 9.8 9.3 40.2 12 36.7 9.8 16.2 40.6 13 36.6 9.8 19.7 40.4 14 36.7 9.8 25.2 40.6 Exp. tdry(s) t25(s) t50(s) t75(s) 1 30.0 21.0 15.2 10.7 2 31.1 22.0 16.3 11.8 3 30.1 20.4 14.3 9.9 4 53.0 32.1 21.0 14.4 5 46.4 27.8 19.8 14.6 6 35.8 21.8 15.7 11.5 7 40.8 27.0 18.8 12.9 8 24.2 16.6 11.7 8.0 9 36.5 23.9 17.0 11.6 10 45.5 26.0 18.2 13.0 11 41.3 23.3 17.4 12.7 12 54.7 32.5 23.4 16.8 13 72.4 45.3 28.5 18.7 14 83.6 54.2 36.3 24.3
7.1. Hypothesis and equations
Knowing the low affinity of water with the PVC surface, the dry-ing inside the particle can be represented by the movdry-ing of an evaporation front from the surface to the core of the particle (Fig. 13). The shrinking core model principle is based on the fol-lowing hypotheses:
• The particles are considered perfectly spherical and uniform. • The evaporation occurs on the evaporation front.
• The fluidized bed is considered as a stirred tank.
•The wet core humidity and the dry crust humidity are respectively considered equal to the particle initial humidity (X0) and null. • The mass transfer is directed by the water vapor diffusion through the
dry crust and the convection at the particle surface.
• The heat is transferred from the air to the particle by convection and is diffused in the dry crust by conduction.
• The sample weight is low enough to assure the bed isothermicity. • The particle temperature is considered uniform. This hypothesis
can be justified by the low value of the thermal Biot number. In ad-dition, this hypothesis has been justified with an analog model cal-culating the temperature profile in the dry crust.
• The instantaneous profile of the air humidity in the dry crust is obtained with the quasi-stationary state hypothesis.
The equations of the model, solved with the variable steps Runge– Kutta method, are presented below:
• Water vapor flux density at particle surface:
NwjR¼ ky BiM! 1−R=rð cÞ þ 1
! Y" %−Y#; ð6Þ
• with BiMthe mass Biot number, defined as:
BiM¼ ky! R Dapp! ρg
: ð7Þ
• Mass balance on the particle: dX
dt ¼ − 6 ! NwjR
ρp! dp
: ð8Þ
• Instantaneous solid humidity:
X ¼ dc dp
!3
! X0: ð9Þ
• Wet core radius evolution: drc dt ¼ −ky! R2 ρp! rc! Bi½ M! R−rð cÞ þ rc( !Y % −Y X0 : ð10Þ
• Heat balance on the particle ρp! Cph! dTp dt ¼ 3 ! h R ! T ∞ −Tp & ' −ρp! ΔHV! dX dt; ð11Þ
(a)
Evolution of drying flowrate and normalised solid humidity versus time(b)
Evolution of characteristic times versus air mass flowrateFig. 10. Evolution of drying flowrate, normalized solid humidity, and characteristic times for different air mass flowrate. Exps. 4, 5, & 6.
(a)
Evolution of drying flowrate and normalised solid humidity versus time(b)
Evolution of characteristic times versus air temperatureFig. 11. Evolution of drying flowrate, normalized solid humidity, and characteristic times for different temperatures. Exps. 1, 7, & 8.
• with Cphthe specific heat of the wet particle, defined as:
Cph¼ Cppþ X ! Cpl: ð12Þ
To solve these equations, the apparent diffusion and the mass and heat transfer coefficients are calculated using the below correlations: • The apparent diffusion coefficient is calculated from the binary
molec-ular diffusion coefficient.
Dapp¼ Dair−H2O! χ
τ ð13Þ
•with χ and τ given inTable 1. The binary molecular diffusion coeffi-cient is calculated from the Fuller, Schettler, and Giddings correlation [28]:
Dair−H
2O¼ 1:1757 ) 10 −9
! T1:75g : ð14Þ
•The heat transfer coefficient is calculated from the Baeyens correla-tion[29]:
Nu ¼ 0:15 ! Re: ð15Þ
•The mass transfer coefficient is calculated from the Chilton and Colburn analogy, which is classically used in drying:
h ky¼ Cph! Sc Pr !2=3 : ð16Þ 7.2. Model validation
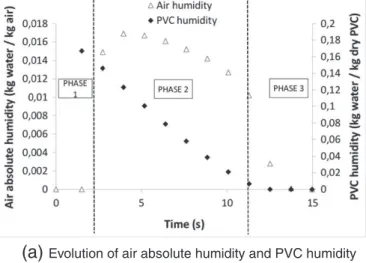
InFigs. 14 and 15typical numerical results are presented. These results show that the real drying time is about 11 s, which is four
Fig. 13. Shrinking core model.
(a)
Evolution of the normalised solid humidity versus time(b)
Evolution of characteristic times versus inlet air absolute humidityFig. 12. Evolution of the normalized solid humidity and characteristic times for different initial relative humidity. Exps. 9 to 14.
(a)
Evolution of air absolute humidity and PVC humidity
(b)
Evolution of particle temperature
Fig. 14. Modeling results: inherent kinetic. Operating parameters: Y∞= 0 kg/kg;
T∞= 41.6 °C; F
g
0= 9.87 kg/h; X
0= 0.167 kg/kg; T0= 15 °C; m0= 2.487 g.
times faster than the time observed with the hygrometer and that the drying operation occurs in three phases:
• The sample warming-up period, from 0 to 3 s (phase 1). • The constant drying rate period, from 3 to 10.5 s (phase 2). • The falling drying rate period, from 10.5 to 13 s (phase 3).
In order to compare the numerical results with the experimental data, the hygrometer transfer function is integrated in the model. The theoretical results are compared with the experimental finding (Exps. 1, 2, and 3).Fig. 15indicates a good concordance between the model predictions and the experimental data.
To have a better understanding of the relative influence of the internal and external resistances to mass transfer, the sensitivity of the mass Biot number was studied. Its expression is remembered below: BiM¼ ky! R Dapp! ρg ¼ ky=ρg Dapp=R ð17Þ ¼internal resistance external resistance:
In the previous simulation conditions, the Biot number estimated by the model is equal to 1.44, which means a competition between both transfer resistances.Fig. 16shows the outlet air absolute humidity evo-lution versus time for different Biot number values (from 0.1 to 10 times the Biot number calculated by the model). These results show that the drying is longer and more difficult with the high Biot number. So
in our case, the external resistance is not negligible in front of internal resistance. This phenomenon can be explained by the morphological parameters of PVC particles. The low internal resistance can be attribut-ed to the evaporation of water inside the macroporosity of small parti-cles and to the low affinity with water.
The model considers a monodisperse granulometry, while in real-ity the PSD shows a Gaussian-type distribution (d10, d50, and d90 presented inTable 1).Fig. 17shows that, in our case, the particle di-ameter has a small influence on the characteristic times. So, the monodisperse hypothesis does not alter significantly the model results.
Fig. 18shows the comparison between the characteristic times given by the model and by the experimental data. These results show that the model predicts correctly the effect of: bed temperature (Fig. 17), inlet air humidity between 0 and 16 g of water/kg of dry air (Fig. 17), and flu-idization air flowrate up to 11 kg/s (Fig. 17), on the characteristic times. Besides, at lower air fluidization air flowrate and at higher inlet air humidity (N16 g of water/kg of dry air) the model underestimates the characteristic times, especially t25.
This phenomenon can be explained by different reasons:
• The effect of inlet air humidity and fluidization air flowrate on the cake dispersion. Indeed, a rise of inlet humidity and a decrease of flu-idization flowrate disfavor this phenomenon.
• The effect of air humidity on the local equilibrium, which is not taken into account.
• And by considering the PVC particle as a homogeneous media (i.e., a uniform pore size). Indeed, an increase of air humidity can lead to a slow down of the drying rate. Moreover, the presence of mesoporosity in the PVC particles can explain the gaps observed, especially at the
(a)
Evolution of air absolute humidity versus time
(b)
Evolution of PVC normalised humidity versus time
Fig. 15. Comparison between experimental and numerical results. Drying of 2.9 g of wet PVC in fluidized bed at 41.6 °C with an air velocity of 32.3 cm/s.
Fig. 16. Air absolute humidity evolution versus time for different Biot number values.
end of the drying operations. In that case, transfers are controlled by a combination between molecular and Knudsen diffusion.
8. Pneumatic dryer model
The aim of this study is to model a pneumatic dryer (macroscopic model) using the particle scale kinetics previously elaborated. As shown inFig. 1, the drying occurs in two periods:
• the removal of surface water, which is governed by a convective mechanism.
• the removal of pore water, which is driven by convective and diffusive mechanisms. This period is modeled with the shrinking core model described in the previous parts.
8.1. Hypothesis and equations
In this model, a two-phase continuum model was used to describe the steady-state flow of a diluted dispersed phase (wet powder) and a
continuous phase through a pneumatic dryer. The model is based on the following assumptions:
•Mass, energy and momentum balances occur between the two phases. •The friction forces between the dispersed phase and the wall can be
neglected.
•The continuous phase, composed of a mixture of water vapor and other gas, is considered as an ideal gas.
•The particles are spherical and composed of a homogeneous porous ma-trix.
•The particle size distribution is considered as monodisperse. •Electrostatic forces and surface tension effects are neglected. •The wall heat loss is neglected.
The mass, energy, and momentum balances developed in one-dimensional steady-state for the k-phase and the transport equations for solid and gas humidity, deducted from the mass balances are presented below. In this work, the k-phase can be either the gas phase (k = g) or the particle phase (k = p).
•Mass balance: d
dzðαk! ρk! UkÞ ¼ Γk ð18Þ •with Γkthe volume rate of mass transfer of the k-phase, expressed
from the water vapor flow density Nw:
Γp¼ −Γg¼ −αp! sp! Nw ð19Þ •where αpis the local volume fraction of solid and spthe specific surface
area of a particle. The water vapor flux density can be expressed as the product of a “global mass-transfer coefficient” and the drying driving force: Nw¼ Ky! Y % −Y " #: ð20Þ
•The global mass-transfer coefficient is expressed as a function of the mass Biot number (as seen in the previous part in Eq.(6)): 0.43
Ky¼ ky BiM! X X0 !−1=3 −1 ( ) þ 1 ! 1 X0−Xc : ð21Þ
•Eq.(21)is valuable for solid humidity less than or equal to the critical humidity, Xc:
Xc¼ρwater! χ ρp
: ð22Þ
•This case is commonly observed when the pneumatic dryer is fed by a cake obtained by an efficient centrifugation. In opposite, when the initial humidity is greater than Xc, the evaporation takes place
es-sentially on a continuous liquid film at the particle surface (convective transfer). The reduction of this film thickness during the evaporation decreases the drying surface. In this case the global mass transfer co-efficient can be estimated by:
Ky¼ ky! ρp! X ρwaterþ 1−χ !2=3 for X NXc: ð23Þ •Energy balance: F0k!dHk dz ¼ Qq→kþ Qw→kþ Ac! Γk! Hgw ð24Þ
(a)
Influence of the bed temperature
(b)
Influence of the air inlet humidity
(c)
Influence of the dry air flowrate
• with Qq → kas the energy exchanged from the q-phase to the k-phase
and Qw → kis the heat loss of the k-phase.
Qg→p¼ −Qp→g¼ αp! Ac! sp! h ! Tg−Tp & '
ð25Þ
• where Acis the pipe cross section, h is the heat-transfer coefficient,
and Tpand Tg, are the solid and gas phase temperatures, respectively.
As the solid flow is very diluted, the heat loss of the solid phase is neglected; for the gas phase it is expressed as:
Qw→g¼ hwall! Twall−Tg & ' : ð26Þ • Momentum balance: d dz αk! ρk! U2k & ' ¼ αk! dP dz−αk! ρk! g þ Iq→k þ Up−Uk & ' ! Γkþ Ff ;w→k: ð27Þ
• The first two terms on the right-hand side of this equation represent, respectively, the influence of pressure and gravity on the flows, Iq → k
represents the interactions between the phases and Ff,w → krepresents
the friction forces between the wall and the k-phase. In this model, the only interaction taken into account is the drag:
Ig→p¼ −Ip→g¼
3 ! αp! ρg! U2r ! Cd 4 ! dp
ð28Þ
• where Uris the slip velocity (Ur= Ug− Up). The drag coefficient, Cdis
calculated by the Wen and Yu correlation[30]:
Cd¼24 Re 1 þ 0:15 ! Re 0:687 & ' ! α−1:7 g : ð29Þ
• The friction force between the pipe and the continuous phase is esti-mated by:
Ff ;w→g¼ f ! ρg 2 ! Dpipe
! U2g: ð30Þ
• The friction factor, f, is calculated by the Blasius formula:
f ¼ 64
Repipe if Repipeb2100 ð31Þ
f ¼0:0791
Re1=4pipe if RepipeN 10; 000: ð32Þ • As the solid flow is much diluted, the particle friction forces are
neglected.
• Humidity transport equations:
dX dz¼ Ac! Γp F0 p ð33Þ dY dz¼ Ac! Γg F0 g ¼ −F 0 p F0 g !dX dz ð34Þ
• with Fp0and Fg0as the dry flowrate of the solid and gas phases.
• Transfer coefficients
Some dimensionless empirical correlations can be used to calculate the heat-transfer coefficient in a pneumatic dryer:
• Baeyens correlation[29]see Eq.(15), • De Brandt correlation[29]:
Nu ¼ 0:16 ! Re1:3! Pr0:67 ð35Þ
• Bandrowski correlation[31]
Nu ¼ 0:00114 ! α−0:5984
p ! Re0:8159 ð36Þ
The Chilton and Colburn analogy (see Eq.(16)) is used in order to calculate the mass transfer coefficient.
Baeyebs and De Brandt correlations predict the transfer coefficient in a diluted phase. In order to model the effects of collisions between par-ticles on the transfer rate, Bandrowski correlation[31]expressed the Nusselt number as a function of the solid volume fraction, αp. This
rela-tion indicates that in the inlet secrela-tion of a pneumatic dryer, the impor-tant value of αpcan counterbalance the high values of slip velocity. In
other words, it takes into account the effect of solid dispersion in the inlet zone.
9. Results and discussion
Firstly, the model predictions are compared with the experimental measurements effectuated by Baeyens[29]on an industrial pneumatic dryer. Secondly, they are confronted with our preliminary industrial re-sults obtained at INEOS ChlorVinyls company.
The simulation data, PVC properties, geometrical and operating pa-rameters, are resumed inTable 3.
9.1. Comparison with literature findings
In the case of the industrial experiments published by Baeyens[29], the inlet PVC humidity (0.26) is greater than the critical humidity (0.134), so the drying rate is controlled by a two stage process. The first stage corresponds to the surface water evaporation and the second to the pore water evaporation.Fig. 19represents the theoretical results obtained using the different correlations previously presented and the experimental measurements effectuated by Baeyens[29]on an indus-trial process.Fig. 18represents the evolution of solid humidity versus
Table 3
Simulation data[29].
Data Baeyens INEOS
Particle properties
Mean particles diameter (μm) 180 160 Solid density (kg/m3) 1116 1016 Inlet PVC humidity (kg/kg) 0.26 0.33 Porosity (−) 0.15 0.367 Tortuosity (−) 8.0 3.2562 Dryer geometry Pipe diameter (m) 1.25 1.7 Pipe length (m) 25 22 Operating parameters
Inlet air temperature (°C) 127 180 Inlet air humidity (kg/kg) 0.003 0.004 Dry air flowrate (t/h) 46.48 45 Dry PVC flowrate (t/h) 6.670 8.545
pipe length whileFig. 18represents the evolution of air temperature versus pipe length.
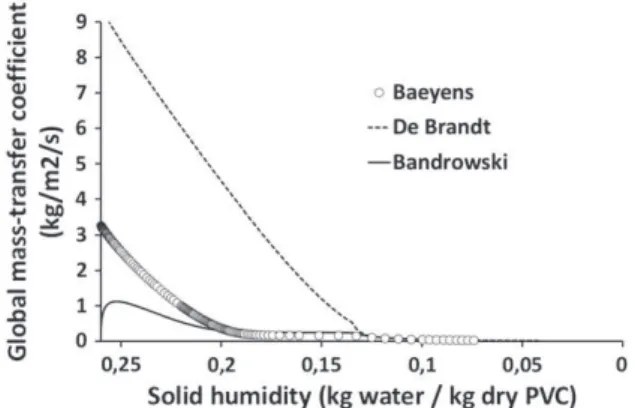
The differences observed between experimental data and theo-retical results can be explained by the worst dispersion of the wet co-hesive PVC in the gas phase at the pipe's inlet zone. The theoretical results which fit the best the experimental data were obtained using the Bandrowski correlation. This can be explained by the effect of the slip velocity on the Reynolds number, and so on the heat and mass transfer coefficients. As shown inFig. 20, this magnitude is re-ally important at the inlet and progressively decreases along the dryer. This leads to very important variations of the transfer coeffi-cients (seeFig. 21). In the Bandrowski correlation, this effect is atten-uated by the solid volume fraction of the dispersed phase.
9.2. Comparison with INEOS ChlorVinyls results
To establish the humidity and temperature profiles along the pneumatic dryer, INEOS' industrial dryer is equipped with several
hygrometers and thermocouples.Fig. 22shows the comparison be-tween industrial data and numerical results obtained using the Bandrowski correlation. It can be noticed that the temperature pro-file is correct while some differences appear on the drying flowrate evolution: in the industrial dryer, the humidity is barely constant in the first meters while in the model results, humidity rises strongly. This is due to the dispersion phenomenon (not taken into account in the model) which slows down the drying in the acceleration zone. 9.3. Parameter study
The results of the following simulations were obtained using the Bandrowski correlation and Baeyens parameters (seeTable 3).
The effect of dry air mass flowrate was examined between 25 and 46.4 t/h. As shown inFig. 23, this parameter has a small influence on the drying rate above 35 t/h. The air velocity influences the drying rate only in the acceleration zone, then the slip velocity is equal to the terminal settling velocity. At the dryer outlet the air is far to be saturated, so the decrease of the dry air flowrate does not affect the dry-ing drivdry-ing force significantly (e.g., a decrease of dry air flowrate from 46 t/h to 35 t/h increases the outlet solid humidity from 0.054 to 0.067 kg water/kg dry PVC, and a decrease of dry air flowrate from 35 t/h to 25 t/h increases the outlet solid humidity from 0.067 to 0.097 kg water/kg dry PVC).
Concerning the inlet air temperature, Fig. 24 shows a dominant effect (e.g., an increase of inlet air temperature from 96 °C to 156 °C decreases the outlet solid humidity from 0.097 to 0.014 kg water/kg dry PVC). Indeed, increasing the temperature leads to a more important heat-transfer driving force. But as the equilibrium humidity depends on the temperature, it will also increase the mass-transfer driving force.
Fig. 21. Evolution of global mass transfer coefficient versus solid humidity for different correlations.
Fig. 22. Comparison between numerical results and INEOS industrial data. Fig. 20. Evolution of slip velocity versus pipe length.
(a)
Evolution of solid humidity versus time for different correlations(b)
Evolution of air temperature versus time for different correlationsThe inlet air humidity effects were investigated between 0 and 0.0105 kg water/kg dry air. The last value corresponds to an atmo-spheric air (15 °C) almost saturated (98.4% of relative humidity). As shown inFig. 25, such an increase of inlet air humidity increases the outlet solid humidity from 0.052 to 0.054 kg water/kg dry PVC. This increase shows that the inlet air humidity, which is a sustained parameter, slightly influences the drying driving force. It can be noticed that the solid temperature is influenced by:
• the dry air flowrate during the falling drying rate period only, •the air humidity during the constant drying rate period only, and •the air temperature influences it during both periods.
In fact the temperature stage value of the constant drying period is controlled by the drying driving forces. As shown in Eqs.(19) and (20), this force depends only on the air humidity, Y∞, and the equilibri-um hequilibri-umidity, Y∗, which is directly related to the solid temperature. In the falling drying rate period, the solid temperature increases until the thermal equilibrium with the air, this equilibrium is controlled by the dry air flowrate and temperature.
10. Conclusion
An experimental and numerical protocol was developed to study the drying kinetic of porous media at the particle scale. The results show the significant influence of the operating parameters, essentially air temperature and humidity. It appears clearly that the PVC drying is controlled by a competition between internal and external transfers. The use of a shrinking-core type model to simulate the particle-scale drying was confirmed by the experimental results.
PVC is essentially constituted of macropores (dporeb 250 nm).
The volume fraction of mesopores (10 b dporeb 250 nm) is inferior to 10%. So we choose a shrinking core type model, supposing that the par-ticles can be represented like a spheric pseudo-homogeneous sphere (i.e., uniform porosity and pore size). This model permits the drying kinetic to be simulated correctly. The gaps observed at the end of the drying operation is probably related to the transfers in the mesoporosity (primary particles).
A one-dimensional steady-state model for pneumatic dryer was established. This model is applied for the drying process of wet PVC powder. The drying rate is controlled by the convective transfer in the first period and by the convective and diffusive transfers in the second. The first period corresponds to the surface water drying; besides the second corresponds to the evaporation of the water in the pores, simu-lated by a shrinking core model. The model takes into account the con-vective heat, and mass and momentum transfers. The parameter study shows that the inlet temperature is the most important parameter in the operation. But this model does not take into account the wet powder dispersion, which is certainly the limiting step of this process.
Nomenclature Roman symbols Ac Pipe cross-section m2 Cd Drag coefficient – Cp Specific heat J ⋅ kg−1⋅ K−1 dp Particle diameter m d3,2 Sauter diameter m d50 Median diameter m
Dapp Apparent diffusion coefficient m2⋅ s−1
DH2O Water vapor/air binary diffusion coefficient m2⋅ s−1
Dpipe Pipe diameter m
f Friction factor –
Ff,w → k Wall friction force on k phase kg ⋅ m−2⋅ s−2
g Acceleration of gravity m ⋅ s−2
h Convective heat transfer coefficient W ⋅ m−2
⋅ K−1
Hk k-phase mass enthalpy J ⋅ kg−1
Hgw Water vapor mass enthalpy J ⋅ kg−1
Iq → k Interface forces from q to k phase kg ⋅ m−2⋅ s−2
ky Convective mass transfer coefficient kg ⋅ m−2⋅ s−1
Ky Global mass transfer coefficient kg ⋅ m−2⋅ s−1
m0 Dry sample mass kg
mw Mass of evaporated water at t time kg
mw0 Total mass of evaporated water kg
Nw Mass transfer rate kg ⋅ m−2⋅ s−1
p∘ Saturated water vapor pressure Pa
pw Water vapor partial pressure Pa
P Absolute pressure Pa
Qq → k Heat transfer from q to k phase W ⋅ m−1
Qw → k k-phase wall heat loss W ⋅ m−1
rc Wet core radius m
Fig. 24. Evolution of solid humidity and temperature versus pipe length for different inlet temperatures: 126, 96, and 156 °C.
Fig. 25. Evolution of solid humidity and temperature versus pipe length for different inlet air humidity.
Fig. 23. Evolution of solid humidity and temperature versus pipe length for different dry air flowrates: 46.4, 35, and 25 t/h.
Roman symbols
R Particle radius m
RH Air relative humidity –
sp Particle Specific Surface m2⋅ m−3
tdry Time when X reaches 0.05 ⋅ X0s
t25 Time when X reaches 0.25 ⋅ X0s
t50 Time when X reaches 0.50 ⋅ X0s
t75 Time when X reaches 0.75 ⋅ X0s
Tk k-phase temperature °C
Uk k-phase velocity m ⋅ s−1
Umf Minimal fluidization velocity m ⋅ s−1
Ur Relative velocity m ⋅ s−1
Ut Settling velocity m ⋅ s−1
Wdrying Drying flowrate kg ⋅ s−1
X Solid humidity kg ⋅ kg−1
Xc Critical humidity kg ⋅ kg−1
Xpore Pore humidity kg ⋅ kg−1
Y Air absolute humidity kg ⋅ kg−1
Y∗ Saturated air humidity kg ⋅ kg−1
Z Pipe length m
Greek symbols
αk k-phase volume fraction –
γLV Superficial tension N ⋅ m−1
Γk Volumic mass transfer rate kg ⋅ m−3⋅ s−1
ΔHV Vaporization enthalpy J ⋅ kg−1
θ Contact angle °
λk k-phase thermal conductivity W ⋅ m−1⋅ K−1 μk k-phase viscosity Pa ⋅ s ρk k-phase density kg ⋅ m−3 τ Pore tortuosity – χ Particle porosity – Subscripts g Gas phase h Humid l Liquid p Particle phase w Wall 0 Initial/inlet Dimensionless numbers Nu Nusselt number Nu ¼h!dp λg Pr Prandtl number Pr ¼Cpg!μg λg
Re Particle Reynolds number Re ¼ρg!Ur!dp
μg
Repipe Pipe Reynolds number Repipe¼ρg!Ug!Dpipe
μg Sc Schmidt number Sc ¼μg ρg!D Sh Sherwood number Sh ¼ky!dp D References
[1] S. Kowalski, Drying of Porous Materials, Springer, 2007.
[2] K. Rajan, B. Pitchumani, S. Srivastava, B. Mohanty, Two-dimensional simulation of gas–solid heat transfer in pneumatic conveying, Int. J. Heat Mass Transf. 50 (5) (2007) 967–976.
[3] M. Mezhericher, A. Levy, I. Borde, Theoretical models of single droplet drying kinetics: a review, Dry. Technol. 28 (2) (2010) 278–293.
[4] A. Levy, I. Borde, Steady state one dimensional flow model for a pneumatic dryer, Chem. Eng. Process. 38 (2) (1999) 121–130.
[5] M. Fortes, M. Okos, A non-equilibrium thermodynamics approach to transport phenomena in capillary porous media, Proceedings of the First International Symposium on Drying, McGill University, Montreal, Canada, August 3–5, 1978, Science Press, 1978, p. 100.
[6] J. Parry, Mathematical modelling and computer simulation of heat and mass transfer in agricultural grain drying: a review, J. Agric. Eng. Res. 32 (1) (1985) 1–29.
[7] M. Prat, Recent advances in pore-scale models for drying of porous media, Chem. Eng. J. 86 (1) (2002) 153–164.
[8] L. Segura, P. Toledo, Pore-level modeling of isothermal drying of pore networks: effects of gravity and pore shape and size distributions on saturation and transport parameters, Chem. Eng. J. 111 (2) (2005) 237–252.
[9] F. Plourde, M. Prat, Pore network simulations of drying of capillary porous media. Influence of thermal gradients, Int. J. Heat Mass Transf. 46 (7) (2003) 1293–1307.
[10] J.-S. Cho, Polymer Surface Modification: Relevance to Adhesion, 2VSP, 2000.
[11] F. Etzler, Acid–Base Interactions: Relevance to Adhesion Science and Technology, VSP, 1991.
[12] J. Szekely, J.W. Evans, H.Y. Sohn, Gas–Solid Reactions, Vol. 66, Academic Press, New York, 1976.
[13] P. Agarwal, W. Genetti, Y. Lee, Coupled drying and devolatilization of wet coal in fluidized beds, Chem. Eng. Sci. 41 (9) (1986) 2373–2383.
[14] H. Cheong, G. Jeffreys, C. Mumford, A receding interface model for the drying of slurry droplets, AICHE J. 32 (8) (1986) 1334–1346.
[15] N. Abuaf, F. Staub, Drying of liquid–solid slurry droplets, Drying '86 Volume 1, Proceedings of The Fifth International Symposium on Drying, 1986, pp. 277–284.
[16] D. Levi-Hevroni, A. Levy, I. Borde, Mathematical modeling of drying of liquid/solid slurries in steady state one-dimensional flow, Dry. Technol. 13 (5–7) (1995) 1187–1201.
[17] S. McCue, B. Wu, J. Hill, Classical two-phase Stefan problem for spheres, Trans. R. Soc. A Math. Phys. Eng. Sci. 464 (2096) (2008) 2055–2076.
[18] I. Borde, A. Zlotnitsky, Drying and combustion of solid–liquid slurry droplets, Annual Report.
[19] C. Strumillo, T. Kudra, Drying: Principles, Applications and Design, 3Routledge, 1986.
[20] S. Ouyang, Q. Mao, M. Rhodes, O. Potter, Short contact time gas–solid systems, Rev. Chem. Eng. 19 (2) (2003) 133–228.
[21] O. Molerus, Overview: pneumatic transport of solids, Powder Technol. 88 (3) (1996) 309–321.
[22] Z. Mindziul, A. Kmiec, Modelling gas–solid flow in a pneumatic-flash dryer, Drying 96 (1996) 275–282.
[23] C. Peishi, D.C. Pei, A mathematical model of drying processes, Int. J. Heat Mass Transf. 32 (2) (1989) 297–310.
[24] I. Kemp, D. Oakley, Simulation and scale-up of pneumatic conveying and cascading rotary dryers, Dry. Technol. 15 (6–8) (1997) 1699–1710.
[25] A. Pelegrina, G. Crapiste, Modelling the pneumatic drying of food particles, J. Food Eng. 48 (4) (2001) 301–310.
[26] S. Diguet, Contribution à l'étude de la déshydratation du carbonate de sodium monohydrate en lit fluidisé dense et mise en oeuvre en lit fluidisé circulant: étude expérimentale et modélisation, INP-Toulouse, 1996. (Ph.D. thesis).
[27] M. Mourad, Contribution à l'étude des cinétiques de deshydratation et d'évolution de la qualité commerciale du maïs au cours du séchage en lit fluidisé à flottation, INP Toulouse, 1992. (Ph.D. thesis).
[28] R. Perry, D. Green, Perry's Chemical Engineers' Handbook, McGraw-Hill, New York, 2008.
[29] J. Baeyens, D. Van Gauwbergen, I. Vinckier, Pneumatic drying: the use of large-scale experimental data in a design procedure, Powder Technol. 83 (2) (1995) 139–148.
[30] L. Schiller, A. Naumann, A drag coefficient correlation, Vdi Zeitung 77 (1935) 318–320.
[31] J. Bandrowski, G. Kaczmarzyk, Gas-to-particle heat transfer in vertical pneumatic conveying of granular materials, Chem. Eng. Sci. 33 (10) (1978) 1303–1310.
![Fig. 2. Internal transfer in a porous particle [23].](https://thumb-eu.123doks.com/thumbv2/123doknet/14261604.489362/4.892.483.821.114.567/fig-internal-transfer-in-a-porous-particle.webp)