THE CHARACTERISTICS OF DC ARCS AS RELATED TO- -ELECTRICAL DISCHARGE MACHINING
by
Ronald John Weetman
B.S.M.E., Lowell Technological Institute (1966)
Submitted in Partial Fulfillment of the Requirements for the
Degree of Master of Science at the Massachusetts Institute of Technology
MAY
3 19
January 1968 Signature of Author... . .. .... .Department of Mechanicai' Engineering, January 15, 1968 Certified by . .
Thesis Supervisor Accepted by . . . . . . . . . . . .. ...
Chairman, Departmental Committee on Graduate Students
THE CHARACTERISTICS OF DC ARCS AS RELATED TO ELECTRICAL DISCHARGE MACHINING
by
Ronald John Weetman
Submitted to the Department of Mechanical Engineering on January 15, 1968, in partial fulfillment of the requirements for the degree of Master of Science.
ABSTRACT
The purpose of this investigation was to determine the ero-sion mechanism of electrical discharge machining (EDM). In the EDM process, repeated electrical discharges erode small craters in the workpiece, forming a cavity of the shape of the tool. Because the electrical discharge occurs between the tool and the workpiece, detri-mental erosion of the tool also occurs. The main goal of this
investigation was to determine the mechanisms governing the relative amounts of erosion occurring at the tool and at the workpiece.
Since it was thought that the only way to understand fully the mechanism of erosion was to relate it to the characteristics of the electrical discharge occurring in EDM, a general study of elec-trical discharges was undertaken first. It was determined that the characteristics of the EDM discharge were similar to those of a high pressure (1 atmosphere) arc discharge in air. An energy balance analysis at the electrodes (tool and workpiece) was done to deter-mine what percentage of the arc energy is imparted to each electrode. It was shown that % 70% of the total arc energy goes to the anode, while only "' 7% goes to the cathode. A straightforward calculation proves that only 5% of the total arc power is needed to melt the observed amount of eroded metal. The rest of the arc power may
qualitatively be accounted for by the power associated with vaporiza-tion and incomplete removal of molten metal.
Because the steady state of a carbon cathode arc produces a very low energy density, it was determined that a carbon cathode arc could not cause significant electrode erosion for the arc dura-tions encountered in EDM. Thus it was concluded that most of the erosion was caused by the initiation of the arc, that is, the spark. This spark erosion with a carbon cathode is contrasted to the long duration arc erosion obtained with a low melting point cathode.
Under extreme conditions of large gap distances (0.005" to 0.007") used in EDM, the energy balance analysis prediction of ten times as much erosion occurring at the anode as occurring at the cathode is contradicted by observations of more cathode ero-sion than anode eroero-sion. This disagreement was reconciled by the observation that the anode is plated by cathode metal. Thus, the plating protects the anode.
It was determined that gas jets emanating from around the cathode spot can propel cathode metal, in its vapor and molten state, to the anode. These gas jets are described by Maecker as resulting from the arc's magnetic field. Thus it was proposed that gas jets are a possible means by which plating is accomplished.
All of the conclusions stated are consistent with experi-ments done with a single discharge apparatus and an Elox EDM machine; however, these conclusions cannot be said to have been experimentally proven because the number of tests that have been run is limited.
Thesis Supervisor: Robert E. Stickney
ACKNOWLEDGMENTS
The author wishes to thank Professor Robert E. Stickney for his help and guidance throughout this investigation. Also,
apprecia-tion is extended to Ernest DeNigris, a fellow student, for his dis-cussions on EDM and to Stanley Doret, Hans C. Juvkam-Wold, and T. Viswanathan, other fellow students, for sharing the results of
their experimental work in EDM. Gratitude is expressed to Professor Sanborn Brown for his help in understanding the properties of arcs. Recognition is given to Miss Lucille Blake for her expert typing of
this thesis.
Thanks areoffered to the Elox Corporation of Michigan for their financial support during the first year of this investigation and to the Mechanical Engineering Department of M.I.T. for its monetary aid in the last five months of this project.
Special appreciation is given to my wife, Joan, for her patience and encouragement.
TABLE OF CONTENTS Page ABSTRACT . . . . . ACKNOWLEDGMENTS TABLE OF CONTENTS LIST OF FIGURES 1.0 INTRODUCTION 2.0 CHARACTERISTICS OF ARCS .
2.1 Definition of Sparks and Arcs 2.2 Properties of Arcs
2.2.1 Electrode Fall Potentials
2.2.1.1 Arc Discharge Potential in EDM 2.2.1.2 Physical Significance of Electrode
Falls 2.2.2 Current Densities
2.2.2.1 Current Densities in EDM 2.2.3 Constrictions at Electrodes
2.2.3.1 Profile of EDM Arc
2.2.4 Longitudinal Electric Field in the Plasma Column
2.2.4.1 Plasma Potential in EDM 2.2.5 Temperature of the Arc
2.2.6 2.2.7
Conducting Profile in the Plasma Column Short Arcs
2.2.7.1 Short Arc in Electrical Discharge Hardening 2.3 Mechanisms of Electron Emission
2.3.1 Importance of Electron Emission Mechaaism in EDM
2.4 Multiplicity of Marks on Electrodes
2.4.1 Advantage of Multiplicity of Marks in EDM 2.5 Arcs in Air and Liquid
. . . .
. . . .
3.0 ENERGY BALANCE AT THE ELECTRODES - . . .. . . . . . .. 34 3.1 Previous Applications of the Energy Balance
at the Electrodes 35
3.1.1 Finkelnburg 35
3.1.2 Cobine and Burger 36
3.1.3 Llewellyn Jones 37
3.1.4 Somerville, Blevin and Fletcher, and Blevin 38 3.2 Energy Balance at Electrodes Applied to EDM 40 3.2.1 Cu Cathode - Cu Anode Analysis 45 3.2.1.1 Cu Cathode - Cu Anode Experiments 46 3.2.1.2 Fe - Cu Cathode-Anode Combinations 51 3.2.2 C Cathode - C Anode Analysis 53 3.2.2.1 C Cathode - C Anode Experiments 53 3.2.3 C Cathode - Cu Anode Analysis 54 3.2.3.1 C Cathode - Cu Anode Experiments 55 3.2.4 Cu Cathode - C Anode Analysis 55 3.2.4.1 Cu Cathode - C Anode Experiments 56 3.3 Conclusions From Energy Balance at the Electrodes 57 4.0 GAS AND EROSION JETS . . . . . 58
4.1 Plating of Cathode Metal on Anode by Maecker's
Gas Jets 59
4.1.1 Maecker's Gas Jet Theory 59
4.1.2 Maecker's Gas Jet Experiments 60 4.1.3 Mandel'shtam and Raiskii Gas Jet Experiments 62 4.1.4 Proposed Theory to Explain the Effect of
Maecker's Gas Jets on the Plating of the Anode 62 4.1.4.1 Influence of Gas Jets at Large
Gap Spacings 63
4.1.4.2 Agreement Between Increasing Strength of Gas Jets and Observed Increased
Anode Plating 66
4.1.4.3 Propulsion and Heating of Cathode
Liquid Metal by Maecker's Gas Jets 67 4.1.5 Improvement of EDM Realizing the Presence
of Gas Jets 73
Page 4.3 Erosion Jets Occurring in Other Discharges
4.3.1 Crystal Growing in an Arc Discharge 4.3.1.1 Crystal Growing Used in
Understanding EDM 4.3.2 Nanosecond Arcs
4.3.2.1 Nanosecond Arcs Used in Understanding EDM
4.3.3 Vacuum Arcs
4.3.3.1 Vacuum Arcs Used in Understanding EDM 4.3.4 Lasers
4.3.4.1 Lasers Used in Understanding 4.4 Conclusions from Gas and Erosion Jets
5.0 CONCLUSIONS . . . . .... 6.0 RECOMMENDATIONS FOR FUTURE WORKS. . . . . . . . . REFERENCES . . . . . . . APPENDIX A - DERIVATION OF MAECKER'S GAS JET THEORY APPENDIX B - TEMPERATURE OF A REFRACTORY CATHODE SPOT
APPENDIX C - FIGURES . . . . . . . . . . . . . . . . . EDM . . .- 81 86 88 93 108 - - - 111
LIST OF FIGURES
Page Fig. 1 Static Voltage-Current Diagram of a Discharge
at Low Pressures; Il- 1 mm Hg. (Somerville8 p. 2) 112 Fig. 2 Variation with Time of Current and Voltage
Between Two Electrodes in a Gas at '" 1 atm. Shortly after Breakdown has Taken Place.
(Somerville8 p. 4) 112
Fig. 3 Arc Characteristics. (Somerville8 p. 5 and p. 86) 113 Fig. 4 Photomicrographs (16X) of Discharges in Oil
Using Single Discharge Apparatus (Doret3) 114 Fig. 5 Arc Profile for a 50 Amp Arc with
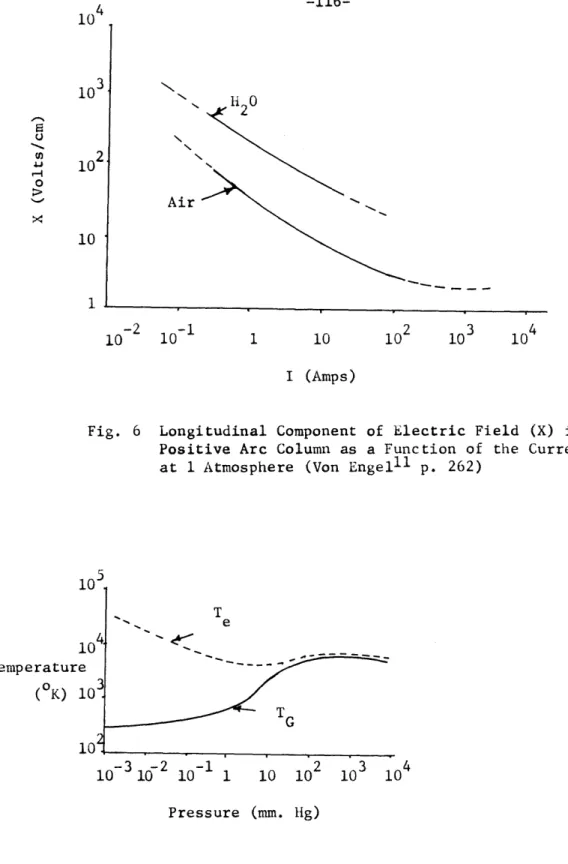
jc -1.1 x 10⁶ a/cm2 ja = 105 a/cm2 115 Fig. 6 Longitudinal Component of Electric Field (X) in a
Positive Arc Column as a Function of the Current I
at 1 Atmosphere (Von Engelli p. 262) 116 Fig. 7 Variation of Gas and Electron Temperature with
Pressure in a Mercury Arc. (Somerville8 p. 23) 116 Fig. 8 Radial Variation of Temperature T, Current Density j,
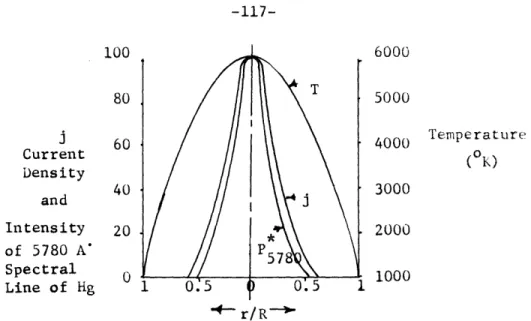
and Intensity P57 8 0 of the 5780 A' Hg Spectral Lines Across an Arc Column in Hg Vapour at a Pressure
1 atm. (Somerville8 p. 41) 117
Fig. 9 Radial Distribution of Electron and Gas Temperature
T and T at Various Pressures. (Von Engelll p. 265) 117
e g
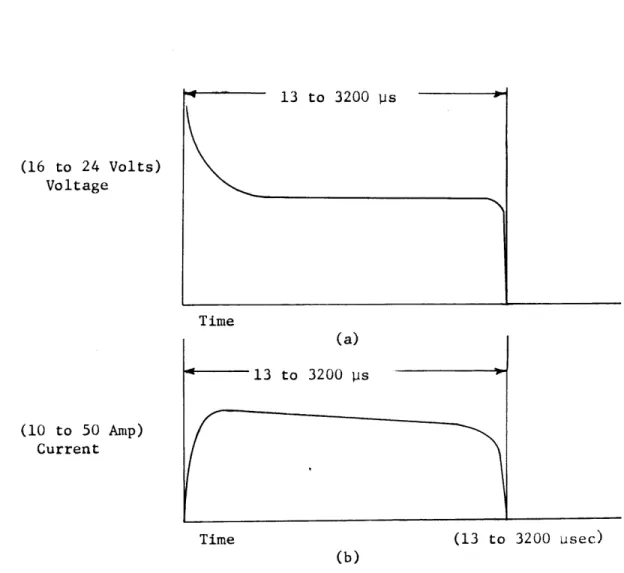
Fig. 10 Typical Voltage and Current Traces for Single
1.0 INTRODUCTION
Electrical discharge machining (EDM) is a relatively new process of machining with a pulsed DC arc. Arc discharges occurring at a fre-quency of from 0.2 KC to 250 KC are used to erode the surface of the workpiece to be machined. Since each discharge erodes a small crater in the workpiece, repeated discharges erode (or machine) the workpiece in the shape of the tool. With the arc taking place between the tool and workpiece, erosion also occurs on the tool. This means that the most important factor in improving EDM is to reduce the erosion of the tool while maximizing the erosion or machining of the workpiece.
A good description of the work that has been done in EDM has been
1 2
given by Berghausen, Brettschneider, and Davis and by Barash2. Although a considerable amount of work has been done in studying the EDM process, the actual mechanism that causes erosion of the electrodes (tool and workpiece) is not very well understood. It is easy to see why the EDM
erosion mechanism is not understood since the mechanism of an arc dis-charge has not been fully established. In fact there are many contra-dicting theories that have been put forth to explain the mechanism of the arc discharge.
Most of the work done in studying EDM has been empirical in nature. In the majority of cases, the work merely describes the bulk quantities, such as the total erosion of the electrodes after repeated discharges. Because of this lack of detailed data on the arc discharge in the EDM literature, this thesis will describe the characteristics of arcs as they are related to EDM.
The characteristics of arcs will be presented first, and then these will be compared to the properties encountered in EDM. After these arc characteristics, which are studied from the physicist's viewpoint, are related to the EDM process, they will be used to determine the energy balances at the electrodes.
In the use of EDM there seem to be certain conditions when the analysis of electrode erosion using the energy balances fails. This failure seems to occur when high energy pulses and large gap distances between the electrodes are used. Unfortunately these two conditions have not been independently established since the large gap distances are dependent upon the energy discharged per pulse in the EDM machines currently used. This dependence is accomplished by the large energy pulses eroding large particles which in turn makes the arc breakdown at large gap distances.
The apparent reduction of anode erosion is the effect that cannot be explained using the energy balance analysis. Under extreme condi-tions of very large energy pulses and gap distances, a build-up of cathode material on the anode is found. In an effort to explain this depositing or plating of cathode material on the anode, an analysis is given of gas and erosion jets that emanate from the regions around the electrodes.
2.0 CHARACTERISTIC OF ARCS
Because of the lack of satisfactory experiments and theories on the exact nature of the electrical discharge occurring under EDM condi-tions, a study of the existing literature on arcs was undertaken. The following chapter presents the characteristics of arcs found in the literature and compares these with the properties of the discharge occurring in EDM. The properties of the EDM discharge are found in
3 the literature on EDM and from experiments done by Stanley A. Doret , Hans C. Juvkam-Wold ' , and T. Viswanathan 4 here at M.I.T. The
experiments by Stanley A. Doret were done on a single-discharge appara-tus which enabled us to analyze the properties of a single discharge. Properties of continuous EDM were obtained by Hans C. Juvkam-Wold and T. Viswanathan on an Elox EDM machine.
All of the references on the characteristics of arcs (unless stated otherwise) use arcs in air, at atmospheric pressure, in their experiments. Although the arc discharge occurring in EDM is in a liquid dielectric (usually oil), we want to show that the arc discharge in air and in oil are alike by showing that their characteristics are similar. By showing this similarity we can use the characteristics and theories developed for arcs in air in analyzing the EDM process.
2.1 Definition of Sparks and Arcs
Since the terms spark and arc are sometimes used interchangeably, we shall take the generally accepted definition of each and use these
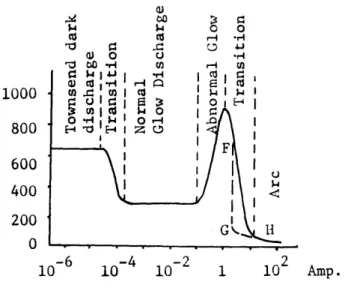
throughout the discussion. Referring to Fig. 1, a plot of the differ-ent discharges that can occur between two electrodes (see Appendix C),
the arc region is characterized by low voltages (<50 volts) and high currents (>3 amps). The plot is for varying the current across a gap of about a few centimeters. But if the voltage is suddenly applied to a gap and the circuit allows the current to be >3 amps, the curve would show a discontinuous jump from F to G instead of the smooth
transition to H. This sudden occurrence of an arc can be seen on Fig. 2 as a function of time. The non-steady region of the plot (time <10-6 sec) is called a spark discharge which leads into the quasi-steady state called the arc. Quasi-quasi-steady is used because it is not in complete thermal equilibrium with its surroundings.
Somerville, Blevin, and Fletcher indicate this quasi-steady characteristic when they analyze the apparent decrease in current density with time. They say that this decrease in current density, or actually the increase in the size of the crater left on the elec-trode, is from heat conduction in the case of the anode and from motion of the emitting areas in the case of the cathode.
The term arc, which will be of duration t (1 y sec < t < 1 m sec), will be used to describe the discharge process for electrical discharge machining in this paper. This should not be confused with the term
arcing used in electrical discharge machining literature as a failure. This arcing is from a short circuit, formed by a high density of
metal-lic vapors from the electrodes, which does not shut off when the volt-age is shut off (in one cycle). This results in a large pit in the work piece.
2.2 Properties of Arcs
The following properties of arcs are put forth to enable us to better understand arcs in general and especially the ekctrical discharge that occurs in EDM. After presenting the properties of arcs, in air at atmospheric pressure, we shall compare these with the properties that we have encountered in EDM.
2.2.1 Electrode Fall Potentials
Some of the properties of an arc can be seen in Fig. 3. Part a of Fig. 3 shows the profile of the discharge denoting its three regions. A net space charge of positive ions is built up in the cathode fall
region accelerating the ions toward the cathode. At the anode a space charge of electrons (anode fall) is set up which in turn accelerates
the electrons to the anode. The potential across the gap shown in part b of Fig. 3 illustrates the sharp rise in potential in the elec-trode fall regions. The cathode fall potential is generally about 10 volts8 for refractory (C,W) and low melting point metals (Cu, Fe), but the anode fall potential is usually different for these two classes of metals. Blevin9 gives the value of the anode fall potential for low melting point metals as ranging from 2 to 9 volts. These values agree with Somerville's10 values of 1 to 12 volts, which increase with
decreas-ing current. These are substantiated by values given by Von Engel 11,
but Somerville's values for the anode fall potential for carbon cthodes (25 to 35 volts) differ from Von Engel's values of 11-12 volts. Since Somerville states that the anode fall potential decreases from 35 volts to 25 volts for increasing current, we believe that these figures could be in agreement with Von Engel's at a high enough current.
-14-Because of the high currents used in EDM, we shall use the values of 11 to 12 volts for the anode fall potential with carbon electrodes. These low values for the anode fall potential for refractory metals
(C,W) at high currents are supported by Busz-Peuckert and Finkelnburg's
1 2,1 3
measurements for the anode fall potential for tungsten. Busz et al. also showed that the 'anode fall potential for tungsten'increased somewhat with gap distance. For gap distances between 2 and 10 mm., they found the anode fall potential increasing from 8 to 12 volts for a 20-amp arc.
2.2.1.1 Arc Discharge Potential in EDM
The arc potentials measured on the single-discharge apparatus agree quite well with the predicted values above. In comparing the arc poten-tials observed in EDM, the total arc potential will be assumed to be the sum of the cathode and anode falls. The justification for neglecting the plasma potential will be discussed in Section 2.2.4. Summing the elec-trode falls from the previous section, it is expected that the arc poten-tial using low melting point electrodes would range from 12 to 19 volts, and the arc potential using refractory electrodes would range from 20 to 21 volts. The arc potentials observed on the single-discharge apparatus were 11 to 16 volts for low melting point electrodes, and 19 volts for carbon electrodes. These observed values agree quite well with the
expected values, especially illustrating the low anode falls in low melt-ing point metals as compared to the higher value for refractory electrodes. In the limited number of tests run, the arc potential for low melting
point electrodes seems to increase somewhat with increasing gap spacing. This could be similar to the observations of Busz et al.12,13 where the anode fall increased with increasing gap distances.
-15-2.2.1.2 Physical Significance of Electrode Falls
The physical significance of the electrode falls is seen in the following chapter where they will then be used in the energy balance analysis. Because the cathode fall accelerates the ions, additional energy is given to them. When these ions impinge upon the cathode, this additional energy is imparted to the cathode. The anode fall likewise increases the energy of the electrons. This increased energy is also transformed into thermal energy as the electrons impinge upon the anode. The liberated energy at the electrodes will be accounted for in terms of the erosion of the electrodes in the following chapter.
The effect of the electrode falls on impinging particles as stated above is actually a by-product of the original purpose of the electrode falls. The purpose of the electrode falls is to supply a transition region between the metal conductors (i.e., electrodes) and the plasma column. Thus, the cathode fall accelerates the electrons emitted from the cathode until they have sufficient energy to ionize the gas between
the electrodes to form a plasma. In a similar manner, the anode fall supplies a transition region for ion current being present in the plasma
to only the electron current existing in the anode. 2.2.2 Current Densities
The current densities at the electrodes are the most important factors in determining the energy density to the electrodes. Unfortu-nately the measurement of the current density (or more correctly the area, since the total current is easily obtained) at the electrodes is a difficult measurement to make. The difficulty arises because of the
large constriction from the plasma column to the electrode surface in the distance of a few electron mean freepaths. This means that the electrode surface is obscured by the luminous plasma close to the sur-face.
Another problem that has misled many investigators in determin-ing the cathode current density is the erratic motion of the arc over
the cathode surface. If the current density were determined by photo-graphing the arc over a large time interval (time > 1 m sec), this motion of the arc over the cathode surface would give a much lower
current density than its true value. This same motion would also give an apparent low current density for the following reason. If the cur-rent density were calculated using the area of the mark or crater formed by a long duration arc on the cathode surface, a low current density would result.
These two problems mentioned above have been overcome by Froome1 4,1 5,1 6 with the use of a 1 y sec exposure Kerr cell shutter. With this fast
exposure time, Froome can arrest the arc's erratic motion over the cathode surface. Another method that gives fairly good results in measuring the current density is to measure the track left by the arc after the arc has been swept across the electrode surfaces by a magne-tic field. This method was employed by Cobine and Gallagher17 to show that the previously determined values (Druyvestyn and Penning 8) for the cathode current densities of low melting point metals were too low. Cobine and Gallagher obtained cathode current densities ranging from 104 to 106 a/cm2 for low melting point metals (Fe Cu).
Another misconception that Froome corrects is the belief by some investigators that the current density decreases with the duration of the arc. Froomel5 describes the cathode spot as follows:
"The bright, erratically moving spot which one sees upon the
cathode is actually a relatively slow-moving envelope containing several minute emitting areas each carrying a current of the order of 1 amp. When the arc current exceeds 5-30 amp, two or more such groups are formed and so on for increasing currents. These tiny areas are much faster moving than their containing envelope, and microsecond exposures through a microscope are needed to arrest their motion and reveal their minuteness. The apparent size of these areas is quite independent of the time from the start of the arc, being observed the same for trans-ient arcs of a few microseconds duration or for normal DC arcs one-two-hundredth of a second after the start."
Froome believes that the current densities of low melting point metals always exceed 106 a/cm2
The cathode current density is the sum of the ion and electron
current density as shown in Fig. 3c. It is generally assumed (Somerville 19) that the ion current to the cathode represents about 10% of the total
current. Although this value of 10% has never been verified experimentally, it does agree with the energy balance calculations at the electrodes.
For refractory metals (C,W) the cathode current density has a transi-tion from low values that could explain thermionic emission (102 to
103 a/cm 2) to high values (105 a/cm2)20 similar to low melting point metal cathodes. This transition occurs as the pressure is decreased to below a certain critical pressure, Pc'
Von Engel and Arnold21 describe this transition for an arc in air between carbon electrodes changing from a thermionic arc to what they call a vapor arc. For a 5-amp arc the critical pressure is '%100 mm Hg. Below this pressure the arc contracted, and carbon vapor was observed. There was also a decrease in arc voltage of 10 to 30
volts. Von Engel and Arnold also say that P decreases with increas-c
ing current and with increasing gap distance. Somerville20 reports on this transition for a tungsten cathode.
The low value of the current density (103 a/cm 2) will be calcu-lated from the Dushman equation for thermionic emission. This equa-tion is given by Cobine22 for carbon in the following form:
2 46,500
j
= 5.93 T exp(- T T )If Cobine's value for the boiling point of carbon is used (4473 0K), the current density equals:
j = 5.93 (4473)2 exp(- 46500 473)
= 3 x 10³ amp/cm2
This value of 3 x 10³ a/cm2 is the maximum value that would be expected at atmospheric pressure.
The current density at the anode is usually an order of magnitude less than the cathode current density. For low melting point metals, it ranges from 103 to 105 a/cm2 (Somerville 23, Cobine and Burger 24) The same transition affects the anode current density at refractory
-19-metals as stated above. Somerville25 reports that the anode current density of carbon can change from "102 a/cm2 to 103 a/cm2 for small spots within the anode termination.
2.2.2.1 Current Densities in EDM
The same problems stated in the previous section were encountered in analyzing the marks or craters formed in EDM. Some of the cathode craters formed using the single-discharge apparatus indicated low
3 2 3
current densities (10 a/cm ) for low melting point metals . But fortunately in one of the long discharges, the arc moved from
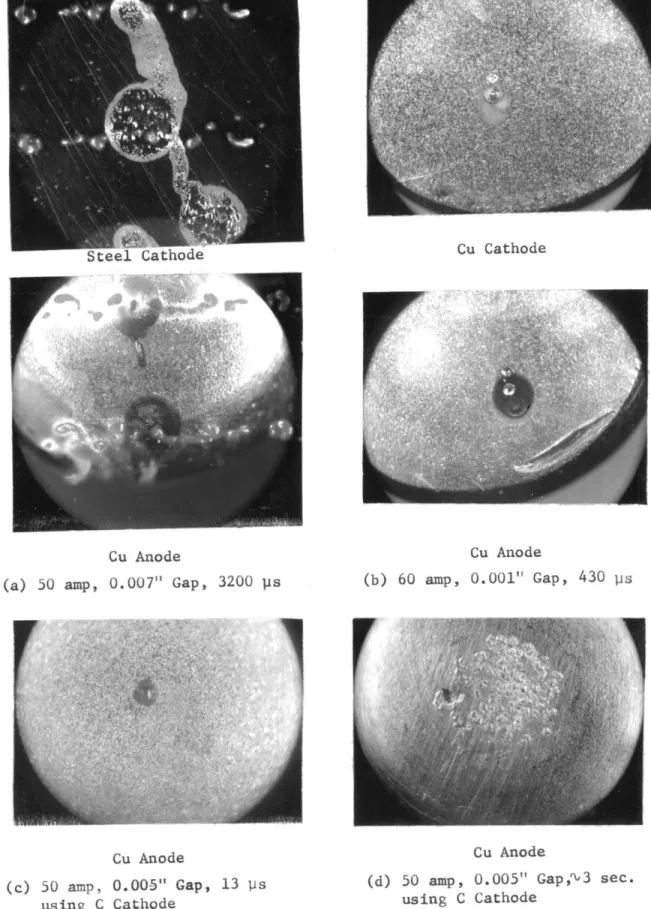
one large crater to another showing the path between them. The photo-graph in Fig. 4a shows this path which indicates a current density of greater than 105 a/cM2
Also, Fig. 4b shows a shorter discharge that represents current
5 2
densities greater than 10 a/cm
These values for the current density also agree with values of 105 a/cm2 found by Barash2 for EDM. Since the crater would represent the envelope mentioned by Froome 5, we could expect the current density
5 2
to exceed 10 a/cm
A surprising result was obtained when examining the anode current
density from a carbon cathode. Instead of 102 a/cm2 given in Section 2.2.2,
5 2
the crater on the anode indicated a current density of 10 a/cm2. Because this crater resulted from an arc at atmospheric pressure, the possibility of it being the vapor arc described by Von Engel and Arnold21 is ruled out.
The cause of this high current density was determined to be the initiation process (spark) of the arc. This was accomplished by
examining craters formed on the anode in arcs ranging in duration from 13 yp sec. to 3200 y sec. This analysis showed that the craters formed were about the same diameter and depth, indicating that they were made in times less than 13 y sec. Since our lower limit for arc duration was 13 y sec. on our single-discharge apparatus, we could not reach the expected spark duration of 1 y sec. Even though we did not reach 1 y sec., we believe that the crater formed on the anode from a carbon cathode is from the spark. It is not until after a few seconds that melting caused by the arc is noticed.
See Appendix B for more details on the refractory spark. 2.2.3 Constrictions at Electrodes
The following two theories will be used to explain the constric-tion of the arc column at the anode (see Fig. 3a). Although there is no generally accepted theory of why the arc constricts at the anode, these two theories both use the radial temperature in their hypotheses.
Somerville26 describes Bez and Hocker's27 theory of the anode constriction caused by two distinct types of ionization mechanisms in the anode fall region. Bez and Hocker state that field ionization,
which is ionization by electrons traveling through a high electric field, occurs at the periphery of the arc. The other type of ionization is thermal ionization which Bez and Hocker say will be present at the hot center of the arc. The important differences between field and thermal ionization are the following: Field ionization occurs over a distance of about one electron mean free path, whereas thermal ionization takes place over several mean free paths. Also, the potential needed for field ionization is greater than the potential in thermal ionization.
-21-The consequent distribution of potential over the arc will tend to drive electrons toward the center and therefore constrict the arc.
The second theory used to explain the anode constriction is by Von Engel . With the temperature and current density greatest at
the center of the arc, Von Engel says that intense evaporation will occur at the center. Since the metallic vapor is usually more readily
ionized than a gas, ionization will be favored nearer the axis, and as a result of this, the positive column constricts.
With the many theories proposed for the emission of electrons from the cathode (to be discussed in Section 2.3 below), it can be expected that the cause of the constriction at the cathode is not known with any degree of certainty. Two qualitative theories put
forth by Elenbaas29 also depend upon the radial temperature distribu-tion across the arc as did the previous theories for the anode con-striction. Elenbaas suggested that if thermionic emission is the electron emission mechanism, then emission might only occur at the hot center of the arc. Elenbaas used the following description for
the cause of the constriction when field emission is the emission mechanism. Since the center of the arc is the hottest, it will have
the greatest ionization; therefore, the electric field will be strongest at the center. Thus emission will tend to be greatest at the center of the arc, hence causing a constriction.
Another approach to explain the constriction at the cathode is to consider the radial diffusion of the electrons after they have been emitted from the cathode. This radial diffusion will proceed across
-22-the cathode fall until -22-the velocities of -22-the electrons become randomized to form a homogeneous plasma upon ionization in the column. Llewellyn Jones30 derives an expression for radial electron diffusion in the pres-ence of ions. Although he uses this expression to explain the electron avalanche phenomenom for the initiation of a spark, it could be used to describe the constriction at the cathode.
2.2.3.1 Profile of EDM Arc
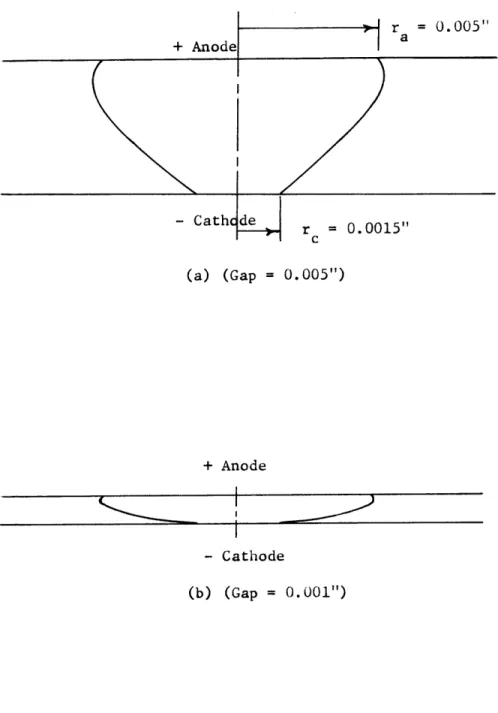
The profile of the EDM arc can be analyzed from Fig. 3a if the plasma column is essentially eliminated. The result of this elimina-tion of the column is seen in Fig. 5. Although the plasma column is actually still present, the expansion of the luminous gas gives the appearance of only the cathode fall region.
2.2.4 Longitudinal Electric Field in the Plasma Column
In order to determine if the potential along the plasma column contributes significantly to the total arc potential in the short gaps encountered in EDM, the longitudinal electric field in the plasma column is studied. Fig. 6 shows how the electric field, for arcs in air and water vapor, varies with current. Von Engel states that the electric field is larger for water vapor than air because water vapor has larger heat conductivity and dissociation losses, and this necessi-tates a larger electric field to balance the losses. The electric field also decreases with the current probably because the gas temperature increases with current.
2.2.4.1 Plasma Potential in EDM
With the maximum electric field of 300 v/cm for water vapor at 1 amp that might occur in EDM, the voltage across the plasma would be
about 9 volts for a 0.010-inch (0.025 cm) gap. But this potential across the plasma will drop to 1 volt for a current of 15 amps.
Water vapor was used above to analyze the potential across the plasma for EDM since water gives similar results to oil when used as a
liquid dielectric in EDM (Berghausen et al.1). 2.2.5 Temperature of the Arc
Fig. 7 shows that atpressures greater than 10 mm Hg the electrons have enough collisions with the atoms to make the electron and gas temperatures approximately equal. Somerville31 states that the gas temperature varies from 5000 0K to 50,000 0K prevailing at high press-ures. For air at atmospheric pressure Suits 32, using the technique of observing the velocity of sound through the arc, determined the temperature of approximately 6000 0K. Suits' temperature is in general agreement with other observers using spectroscopic techniques
(Somerville 33).
The radial distribution of temperature in a mercury arc is seen in Fig. 8. This illustrates that the temperature does not fall off to a high degree over the conducting area.
2.2.6 Conducting Profile in the Plasma Column
Elenbaas34 gives a good description of the profile of the conduct-ing channel of a high pressure arc. By assumconduct-ing thermal equilibrium, Elenbaas uses the Saha thermal ionization equation to predict the sharp
fall of the conducting profile shown in Fig. 8. The Saha equation of the form
n n (27rm k)3 2
g 3/2 ~ e i
n 3 2( -)T exp(_ kT
where
n - number density of atoms n = number density of ions n = number density of electrons m = mass of an electron
e
g ground state degeneracies V = ionization potential
can be reduced to
n
~T1/
4 - ie exp(2 kT
This proportionality uses the fact that ni = ne in the plasma column and that na ^ from Pa = n kT. Elenbaas calculates ne for mercury with V = 10.43 volts to be
1/4 60,500 ne T exp(-
T
From the temperature profile in Fig. 8, that can be determined experi-mentally, Elenbaas selects two temperatures to show the sharp drop in electron number density. he calculates that the electron number density
drops by 99.4% as the temperature goes from 6000 0K to 4000 OK. Since the current density,
j
= e nev and v I T1/2, the current density at 4000 0K is less than 0.6% of the current density at 6000 0K.The above use of the Saha equation illustrates why the plasma column constricts for high pressure arcs. Von Engel shows this con-striction occurring at high pressures in Fig. 9. This concon-striction occurs because of the increased gas temperature with pressure. At
low pressures the ionization is caused by the electrons bombarding the neutral atoms. Since the electron temperature is almost uniform across the diameter of the tube, the electron density does not fall off as rapidly as it does at high pressures. The electron density falls off at low pressures because of diffusion and recombination, whereas at high pressures the sharp drop in temperature accounts for most of the constriction of the conducting channel.
2.2.7 Short Arcs
The cathode and anode fall are usually of the order of one
elec--3 -4
tron mean free path, A . This is about 10 to 10 cm for atmospheric air (Somerville 35). If the total length of the gap between the cathode and anode is of the order of one electron mean free path, the arc is
36,30
called a short arc (Llewellyn Jones3 ). Llewellyn Jones states that for a short arc the electrons will bombard the anode causing erosion. But if the gap is made longer (>- 100 A ), the electrons will have many collisions and therefore lose their energy. The ions will then be accelerated in the cathode fall which will erode the cathode. This arc is called a cathode arc, and the former arc is called an anode arc. In the case of a high-power arc, the longer arc may have more erosion of the anode if an anode fall is established. Germer and Boyle37 give some data for short arcs although the duration of the arcs is 5 1 y sec. which presents some problems with multiple spots that will be discussed in Section 2.4 of this chapter. The anode and cathode arcs at a breakdown voltage of 300 volts give an average gap
-5 -5
distance of 3 x 10 cm and 7 x 10 cm, respectively. The breakdown voltage of 300 volts was used because it is needed for cathode arcs,
although anode arcs will occur down to 50 volts. The gap voltages after breakdown are also different being 9-12 volts for anode arcs and 13-18 volts for cathode arcs. This data supports Llewellyn Jones' ideas although Germer and Boyle's explanation of the cathode arc
differs from Llewellyn Jones'. Germer and Boyle say that the multi-ple erosion pits on the cathode are caused by melting of points from the field emission currents flowing through them.
2.2.7.1 Short Arc in Electrical Discharge Hardening
Although the short arc, specifically the anode arc, is not the case observed in EDM, it seems beneficial at this time to mention that the anode arc does correspond to the situation observed in
elec-38
trical discharge hardening (see Barash and Kahlon ). This hardening process is accomplished by using repeated electrical discharges between an anode of hard metal and a cathode of soft metal. A plating of hard anode material is deposited on the cathode during the discharges in an air atmosphere.
We believe that the arcs occurring in the process of hardening are anode arcs because of the following reasons: First, the breakdown voltages employed in the hardening process range from 60 to 110 volts
(see Barash and Kahlon 38), which is the lower range for anode arcs. Another reason to believe that these are anode arcs is that one of the electrodes has to be vibrated in order to prevent welding of the two electrodes together. This welding of the two electrodes is exactly what Germer and Boyle37 observed for the majority of anode arcs.
One interesting observation which was made by Barash and Kahlon that may apply to EDM is the following: Plating took place at a much
higher rate from metals with a higher melting point on to metals with a lower melting point than vice versa. A possible explanation offered by Barash and Kahlon for this higher rate was that the vapor from the high melting anode could condense on the cathode, and in doing so pro-duce sufficient heat to melt the cathode surface and propro-duce a strong bond.
2.3 Mechanisms of Electron Emission
The mechanism explaining how electrons are emitted from the cathode surface is fundamental to the understanding of the arc discharge. Although many mechanisms for this emission of electrons have been proposed, no
theory has been specified in enough detail to be generally accepted. The difficulty that arises in supporting the many proposed theories is the problems encountered in measuring properties in the cathode fall region. Properties (i.e., electron current density, ion current density, etc.) cannot be measured because of the small size of the cathode fall region. The cathode fall region extends over a distance of a few electron mean free paths (Somerville 35), which is less than 10 y at atmospheric pressure. Many of the theories that have been proposed will be stated below.
The one theory that explains a limited range of conditions is thermionic emission. This accounts for the low current densities
(102 a/cm 2) of refractory metals because of their ability to achieve a high enough temperature without evaporating. But it does not explain
5 2
the high current densities (10 a/cm ) that are encountered in the transi-tion of refractory metals to a vapor arc (Von Engel and Arnold 21
Thermionic emission also cannot explain the high current density (106 a/cm 2 of low melting point metals.
Field emission was formerly thought to be the mechanism for low melting point metals. It could explain 10 to 104 a/cm 2, thought to be the current density (Druyvestynand Penning18, Mackeown 39). But with the current density now realized to be 105 to 106 a/cm 2, the
field emission mechanism first developed by Langmuir cannot sub-stantially account for these high-current densities (Cobine and
17 40
Gallagher , Somerville ).
Another mechanism suggested by Druyvestynl8 is that of elec-tron emission through insulating layers on the surface resulting from positive ions building up on the insulator. This is also suggested as the mechanism by Cobine and Gallagher as a result of the need to oxidize copper and tungsten before any noticeable erosion was observed. Somerville, Blevin, and Fletcher also had to oxidize Cu and W before any appreciable signs of melting occurred.
Slepian suggested a thermal ionization theory that was later extended by Weizel, Rompe, and Schon and Ecker (Somerville 41). The theory is that in some high pressure arcs a highly ionized layer of gas or vapor close to the cathode may supply a large fraction of the cathode current in the form of positive ions.
442
A quite involved theory is developed by Von Engel and Robson4 2 which explains that a dense layer of metal atoms vaporized from the electrodes exists in front of the cathode. This layer is caused by momentum transfer from the cathode fall potential. These atoms are put into an excited state and then hit the cathode giving up their excitation potential in removing an electron. These excited atoms can be quenched by the gas molecules by transferring their excitation
potential to the gas molecules. Since molecules have a smaller proba-bility of removing an electron from the cathode, this quenching is used
to explain the transition of refractory metals from a high-current density vapor arc to a thermionic arc (Von Engel and Arnold 21
Von Engel and Robson's theory proposes a vapor pressure of 10 atm. at the cathode, but as yet there is no experimental proof to support these high pressures for a sustained arc (Somerville4 3
Other attempts have been made to try to explain the high-current densities of low melting point metals and in the vapor arc mode of
refractory metals by combining different emission processes. Somerville tells of Bauer's attempt to explain these high zurrent densities by com-bining thermionic and field emission.
A later paper by Eather45 explains the high current densities by combining three ideas. Essentially Eather only uses one theory but modifies and supports this with two others. He uses J. Rothstein's theory46 which states the existence of a dense vapor layer having con-tinuous (including conduction) energy bands next to the cathode. This would allow metallic conduction from the cathode to this vapor, which in turn, being at a very high temperature, would emit electrons by thermionic emission. Eather supported the existence of the dense vapor layer by Von Engel and Robson's42 theory. In order that Rothstein's theory of thermionic emission account for 10 to 10 a/cm , Eather used A. M. Cassie's theory of lowering the work function of the cathode by
the pinch effect. This effect is the inward radial force caused by the self-magnetic field of the arcs.
2.3.1 Importance of Electron Emission Mechanism in
EDM
Since the exact mechanism of electron emission has not been resolved yet, we could not hope to determine the electron emission mechanism occurring in EDM. But in the physicist's search for the emission mechanism, he has found that the current density of carbon
(or graphite) is only 102 to 103 a/cm2 (see Section 2.2.2) for high currents and high pressures. This means that when graphite is used as the cathode in EDM, it will produce very low-current densities as compared to a low melting point metal being used as the cathode. 2.4 Multiplicity of Marks on Electrodes
The multiplicity of electrode marks left on the cathode and 48949
anode have been studied by Somerville and Grainger . They observed that the anode mark may consist of up to 100 separate pits, but the cathode usually had only one or two pits. Their study showed that the factors which caused multiplicity on the anode was a thin contaminating layer, thickness of 10-6 cm being sufficient, and a high initial rate of increase of current (> 10 a/sec.). If the arc (or probably more correctly, spark) lasted more than 8 - sec., the pits started to enlarge and combined to form a single mark.
2.4.1 Advantage of Multiplicity of Marks in EDM
The multiplicity of anode marks may be able to be used to an advantage in electrical discharge machining. If the surface in elec-trical discharge machining is contaminated, and if it is possible to achieve such high rates of current, it might be able to achieve a better surface finish (by having more pits per discharge) at a higher machining rate.
2.5 Arcs in Air and Liquid
Because the mechanism of electron emission has not been established, the only comparison that can be made between arcs in air and in a liquid is their characteristics.
The first characteristic that was shown to be similar for arcs in air and in a liquid was the arc potential. The low values for the discharge potential indicate an arc discharge rather than some other
type of electrical discharge. Also, from the steadiness of the dis-charge potential (see Fig. 10), a steady arc disdis-charge is indicated as compared to a spark discharge, although Fig. 10 shows us that the arc discharge was probably initiated by a spark discharge.
Another important property that was found to be the same in arcs in air and our EDI arc was the high c-urrent densities. A few tests were run in air on the single-discharge apparatus to determine if there were any differences between the arc in air and in a liquid. The volt-age potential and current density observed were approximately the same values. The only apparent difference was that the craters formed on the electrodes in a liquid were a little deeper and more well defined than the craters on the electrodes in air. This result,which indicates that the liquid seems to enhance the metal removal rate in EDM, was also
2 observed by Barash
Another indication that the arc in a liquid is similar to an arc in air is the high temperatures observed in arc discharges. In fact, an arc in air with its gas temperature of 6000 0K will certainly not allow liquid to remain in the arc column. An example of water surround-ing an arc is the Gerdien arc (see Somerville 50). A Gerdien arc has
water flowing around its periphery, and Somerville reports that axial gas temperatures of over 50,000 0K have been observed in Gerdien arcs.
In Appendix B it is reported that electrode vapor is observed even in nanoseconds arcs. Since some evaporation of the electrodes occurs in high pressure arcs, the arc burns in this vapor given off, as well as the gas initially present between the electrodes. Thus it
is proposed that an arc in a liquid will burn in the vapor of the elec-trodes, as well as the vaporized liquid. This means that an arc in air and in a liquid should be similar if significant electrode evapora-tion occurs. This importance of electrode vapor is exemplified in vacuum arcs. Since there is no gas present, the vacuum arc burns
totally in the vapor from the electrodes. The dependence of electrode vapor in an arc in air can be shown by comparing the cathode fall poten-tials of arcs in air and arcs in a vacuum. In observations made by Kesaev 51, the cathode fall potentialsfor an arc in air and in a vacuum were usually wiLhinlO% of each other for fourteen different metals. The similarity of these cathode fall potentials indicates that the arc in air is probably burning in vapor from the cathode.
Since it seems that the arc characteristics are the same for arcs in air and in the discharge occurring in a liquid dielectric, these properties will be used in the following chapter in the energy balance
analysis. We believe that it has been advantageous to first show that the EDM discharge is similar to a high pressure (1 atmosphere) arc in air for the following reasons: By showing that all of the properties that we have measured are the same, we hope to say that the properties
we cannot measure are the same. Also, if the arcs are similar we may use the proposed theories and descriptions of arcs in air to describe our EDM discharge.
3.0 ENERGY BALANCE AT THE ELECTRODES
In an effort to determine the erosion mechanism in EDM, the follow-ing approach to determine the energy flux to the electrodes will be used. This approach is to calculate the energy balance at each electrode
and to find out what percentage of the energy dissipated in the arc goes to each electrode. Along with determining these percentages, it is also very important to find out the value of the energy fluxes to the elec-trodes, since the magnitude of this energy flux will determine if melting
and vaporization are possible.
The following formulations of the energy balances at the electrodes
52 53
are derived from work done by Somerville5, Finkelnburg5, and Cobine 24
and Burger
The energy balance at the cathode can be put in the following form:
C
(Vc +
V
+V
-
)+RG=j
+ M
+
E
+ Rc
+
Cc
watts/cm2
where
j
- ion current density to the cathode amp/cm2 cV = cathode fall volts
C
V. = ionization potential V thermal energy of ion
c = energy used from extracted electrons to neutralize ions RG -radiation from gas
* work function of cathode
jc
= electron current from cathode M - melting of cathodec
E = evaporation from cathode R
c
= radiation from cathode C = conduction from cathodeAlthough the above neglects conduction and convection from the gas, they can usually be considered negligible 52. The equation does include some terms that may also be neglected under certain conditions.
The energy balance at the anode is simpler than that at the cathode. This is because electron emission can be neglected at the anode. The energy balance at the anode is given as follows:
ja
(V + + V) + R =M + E + R + C watts/cm2a a G a a a a
where
ja
= electron current density to the anode amp/cm2V =
anode fall
V -thermal energy of electrons R G =radiation from gas
M a =melting of anode
E a =evaporation from anode Ra radiation from anode C = conduction from anode
The energy balance from the anode also neglects conduction and convec-tion from the gas as did the energy balance for the cathode.
3.1 Previous Applications of the Energy Balance at the Electrodes
Before applying the above equations to EDM, several previous
applica-tions of the energy balance equaapplica-tions will be shown below.
3.1.1 Finkelnburg
Finkelnburg53 uses the equation
j
Vc c$_ + Ecfor the energy balance at the cathode, therefore neglecting some of the above terms. For the anode he uses j (V + *) = E for his sim-plified energy balance. Finkelnburg uses the previous two equations
to explain the appearance of vapor from mercury cathodes and generally the absence of vapor from carbon cathodes. He states that since car-bon can achieve a high enough temperature for thermionic emission, the energy input to the cathode,
j
V -j
$, will be used to emit electrons,c c c
jc.
This would mean that there would not be enough energy remaining for evaporation. Finkelnburg contrasted this with the probableinability of the mercury cathode to have thermionic emission as its mechanism of emission of electrons. Thus the jc term in the cathodeC energy balance for mercury vanishes, and the energy input can be used
for evaporation.
3.1.2 Cobine and Burger
Another paper on the erosion of electrodes is by Cobine and Burger2 4 who use theanode energy balance equation as follows:
ja(V a + 0 + v) Ea
With this first-order approximation, all the power is carried off by evaporation. Cobine and Burger compared the evaporation power (watt/cm 2 which is equal to the rate of evaporation (2 gc times the latent
cm sec.
heat of evaporation (watt/gm), with the range of input powers
[ja(V + $ + V~)] versus temperature. In this comparison they find that a a
the surface temperature of the anode would be greater than its boiling point. The theory is substantiated by data of eroding anodes using very
high currents (11,000 - 26,000 amps peak for a single half cycle, A. C.) assuming that all the erosion was from evaporation.
Cobine and Burger also analyze the energy balance at the cathode by the simplified energy balance
j+
V-
+ E.
C C CCUsing the evaporation power they show that the evaporation (E ) can +c
account for most of the input energy (jc V) at a temperature that would c c
give a negligible thermionic energy contribution (j c$) for low melting point cathodes. Thus they conclude that thermionic emission does not seem to be important for low melting point cathodes.
3.1.3 Llewellyn Jones
The energy dissipation at both electrodes is analyzed by Llewellyn 30
Jones . He assumes tis energy is composed of evaporation energy (includ-ing melt(includ-ing before evaporation), radiation and conduction (M + E + R + C = energy dissipated). After simplifications, this equation reduces to the volume of metal evaporated in terms of three unknowns, one being the effective capacity of the energy dissipated (M + E + R + C). Using data from erosion of spark plugs from three metals of known, preferably
widely differing, physical properties--and assuming that this erosion is from evaporation--, the effective capacity of the energy dissipated was determined. This capacity was found to be about 11% of the total
capacity of the gap. The other 89% of the energy in the gap, therefore, must go to gaseous processes and energy required to emit electrons.
Llewellyn Jones also gives an upper estimate of the time required to raise the hot-spot temperature to the boiling point. This is done
by considering the rise in temperature of the surface of an infinite metal plane due to a constant heat input. This estimate is to ensure that enough time is available in a normal arc discharge. Arcs usually range from times of 1 y sec. to 1 m sec. The temperature rise 90 after a time t is given by the equation
][1/2
2 1/290 = 2Q [k p 2with r1
where k = thermal conductivity c = specific heat
p - density
Q energy supplied per unit area r - radius of spot
For nickel with 9
=
30000, kcp=
1, and an arc with current density of=
106 a/cm 2, the ion current density may be taken as 105 a/cm2 and the cathode fall=
20 volts. This gives a Q=
2 x 10⁶ watts/cm2 at the7 2
cathode and 2 x 10 watts/cm at the anode. The values of t calcu-lated are 3 x 10⁻⁵ sec. for the cathode and 3 x 10~ sec. for the anode. These times therefore can be neglected as compared to the majority of
the times of an arc.
3.1.4 Somerville, Blevin and Fletcher, and Blevin
Two other papers that seemingly contradict those of Cobine and Burger24 and Llewellyn Jones30 are papers by Somerville, Blevin and
7 9
Fletcher, and Blevin . Cobine and Burger determined that the tempera-ture of the anode is above its boiling point and Llewellyn Jones assumed the temperature of both the electrodes were at their boiling points.
But the latter two papers determined that the temperatures of the electrodes are considerably above the melting point, although they are much less than the boiling point of the electrodes. Somerville, Blevin and Fletcher,and Blevin all use the same approach in analyzing
the erosion of electrodes. They assumed that linear heat flow existed with melting of the electrodes. By using layers of thin foil as the electrodes, they observed the depth of melting. Then by assuming this depth has obtained the melting point temperature andusing an appro-priate heat transfer solution, they determined the surface temperature. Blevin calculated the anode temperature of tin to be about 1500 0 C
compared to Somerville, Blevin, and Fletcher's value of about 900 "C for the cathode temperature. An indication of the anode temperature being approximately 70% higher than the cathode temperature was that the crater on the anode was about twice as deep as the crater on the cathode.
From the temperature profile Blevin determined the heat flux to the anode. Blevin says that this energy flux would represent an anode fall of 2 to 9 volts. These values are in agreement with observed values, although Blevin does not give the details of his calculation.
23
Somerville tries to reconcile the apparent contradiction of the previous four papers. He says that vaporization need not take place if an arc duration is very short, or if the anode is efficiently cooled, or if the current is small. These restrictions may apply because Cobine
24
and Burger do use much greater currents and somewhat longer arcs than 9
does Blevin , 11,000 amps and 1/120 sec. compared to 50 amps and 1 y sec. to 1 m sec.
3.2 Energy Balance at Electrodes Applied to EDM
The two distinct methods that are employed in EDM will be described below, in order to describe the energy balances directly in terms of the observations made of EDM. The first method used in EDM is one in which the tool is the cathode (called standard polarity EDM), and in the second method the tool is the anode (called reverse polarity EDM). Standard polarity is used for high frequency machining (frequency > 2 Kc or arc durations < 500 y sec.) and results in greater anode erosion than cathode
erosion.
When reverse polarity is used with arc discharge durations
greater than 500 y sec., a higher energy pulse is produced than when using standard polarity at the same current. In reverse polarity, when using high energy pulses (long duration and/or high currents) and large gap distances, the erosion of the anode decreases, and in extreme condi-tions cathode material is deposited on the anode.
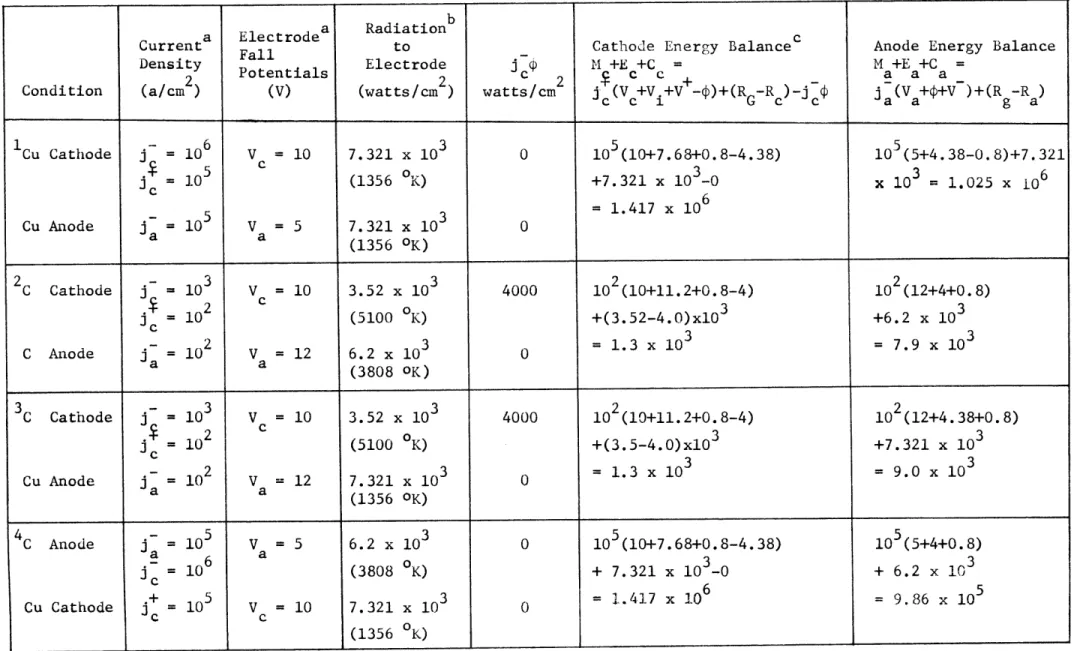
In order to examine the extreme conditions between standard and reverse polarity EDM, the following anode-cathode combinations will be analyzed:
1 2 3 4
Cathode: Cu C C Cu
Anode: Cu C Cu C
Conditions 1 and 2 will be studied to determine the distribution of arc energy to each electrode using the same material for each electrode. The difference between conditions 1 and 2 is that carbon (C) is a
refrac-tory metal and therefore has a much lower current density than copper (Cu) (see Section 2.2.2). Condition 3 is similar to what is used for
standard polarity EDM, although steel is usually the anode instead of copper. Copper is used instead of steel or iron because it is easily accessible in pure (99.99%) form. Also, copper, as well as iron, gives the same characteristic of a high current density. The main difference between iron and copper is that copper has a much higher thermal
con-ductivity; however,this will not hinder the comparison between copper and carbon when discussing the arc characteristics. In reverse polarity
EDM, carbon (graphite) is usually employed as the anode (tool), as in
condition 4 above.
The energy balances for condition 1, Cu cathode - Cu anode, will be done in detail, whereas the remaining calculations for conditions 2 to 4 will just be tabulated.
The energy balance at the cathode from above is
j
(Vc + V + V+ )+ R =j + M + Ec + Rc + CcCombining RG and Rc and solving for Mc + Ec + C c, we get the energy available for conduction, melting, and evaporation.
Mc + E + C c (V + V + V - $) +(R - R - j '
c c c c c i G c c
Using the values given in Chapter 3 for copper,
5 2 2
M + Ec + C = 10 amp/cm (10 + 7.68 + 0.8 - 4.38) volts + 7321 watts/cm - 0
= 1.41 x 10⁶ + 7.321 x 10³
6 2
where (RG - Rc) - a[(6000 oK) - (1356
0K)
4] watts/cm2(a = 5.67 x 10⁻¹² watts/cm2deg4K) - 7.321 x 10³ watts/cm2
and V+ 3 3 1.38 x 10⁻² 3 j/K) 6000 0K 0.8 volts 1.6 x 10 j/ev
which is just the kinetic energy of anatom at 6000 0K.
The omission of the
jc$
term should be noticed in the previous calculation. This term represents the electron cooling term caused by the electrons surmounting the work function barrier in thermionic emission. But since the probable mechanism for electron emission using low melting cathodes is field emission, and not thermionic emission, this term can be neglected. It can be neglected because electrons emitted by field emission do not have to surmount the work function barrier.The values used in the above calculations as well as those which will be used in Tables 1 and 2 were the averaged values reported in
Chapter 3. Examples of these average values are given as follows: Since the anode fall potential for low melting point metals was given to range from 2 to 9 volts in Section 2.2.1, the average anode fall potential is 5.5 volts. This value of 5.5 volts was rounded off to 5 volts for the previous calculation because lower than average anode fall potentials are expected for the small gap spacing encountered in EDM. Other average values used in the previous calculations were 106 a/cm2 for the electron current density at the cathode and 105 a/cm
for the electron current density at the anode. These values for the current densities were reported in Section 2.2.2. It should be noticed that the anode current density used is the highest value of the range reported in Section 2.2.2. This high value was used because it is believed that the anode current densities experimentally determined will give low values. Low values for the anode current density are
expected because of the problems encountered in measuring the area of
the arc channel or in measuring the eroded crater made by the arc. These are the same problems discussed in Section 2.2.2 for measuring cathode current densities.
Care must be taken here to notice that the energy balance equations are actually equating energy per time per area or power per area, which by convention is called energy density. Since the total power equals the total voltage (V) times the current (I), we can determine what per-centage of this energy goes into the cathode for conduction, melting, and evaporation.
Because the gap distances are very small, the voltage potential across the plasma column is negligible (see Section 2.2.4.1), which means that the total voltage approximately equals V + Va;
c a therefore, arc power - IV - (j +j~) A (V +V) - (++10