Publisher’s version / Version de l'éditeur:
Geotechnical Testing Journal, 11, 2, pp. 92-99, 1988-06
READ THESE TERMS AND CONDITIONS CAREFULLY BEFORE USING THIS WEBSITE. https://nrc-publications.canada.ca/eng/copyright
Vous avez des questions? Nous pouvons vous aider. Pour communiquer directement avec un auteur, consultez la première page de la revue dans laquelle son article a été publié afin de trouver ses coordonnées. Si vous n’arrivez pas à les repérer, communiquez avec nous à PublicationsArchive-ArchivesPublications@nrc-cnrc.gc.ca.
Questions? Contact the NRC Publications Archive team at
PublicationsArchive-ArchivesPublications@nrc-cnrc.gc.ca. If you wish to email the authors directly, please see the first page of the publication for their contact information.
NRC Publications Archive
Archives des publications du CNRC
This publication could be one of several versions: author’s original, accepted manuscript or the publisher’s version. / La version de cette publication peut être l’une des suivantes : la version prépublication de l’auteur, la version acceptée du manuscrit ou la version de l’éditeur.
Access and use of this website and the material on it are subject to the Terms and Conditions set forth at
Heat and moisture transfer characteristics of compacted Mackenzie silt
Evgin, E.; Svec, O. J.
https://publications-cnrc.canada.ca/fra/droits
L’accès à ce site Web et l’utilisation de son contenu sont assujettis aux conditions présentées dans le site LISEZ CES CONDITIONS ATTENTIVEMENT AVANT D’UTILISER CE SITE WEB.
NRC Publications Record / Notice d'Archives des publications de CNRC:
https://nrc-publications.canada.ca/eng/view/object/?id=b2a1109e-7bc9-4d45-bc2a-4489c9f737b4
https://publications-cnrc.canada.ca/fra/voir/objet/?id=b2a1109e-7bc9-4d45-bc2a-4489c9f737b4
S e r
TH1
N21d
National Research
Conseil national
1558
I
*
I
Council Canada
da rechercher Canada
c .
2
BLDG
Institute for
lnstitut de
Research in
recherche en
Construction
construction
Heat and Moisture Transfer Characteristics
of Compacted MacKenzie Silt
by E. Evgin and O.J. Svec
Reprinted from
Geotechnical Testing Journal
Vol. 11, No. 2, June 1988
p. 92
-
99
(IRC Paper No. 1558)
NRCC 2941 1
iB
N R C-
CISRI R C
iL I B R A R Y
I V 'I IB I B L I O T M ~ Q U E
1
I R C
di
CNRC - 16187 a*---Les caractkristiques de transfert de chaleur et d'humidit6 dans un silt provenant de la vallte du fleuve Mackenzie ont 6tC d6terminCes en laboratoire. Avec un appareil de bdayage ti
rayons gamma double, on a mesure? les changements de densit6 et de teneur en humidit6 volum6mque dans des &hantillons de sol. Les coefficients de diffusivid sol-eau dans des conditions isothermiques et dans certains gradients de tempbratwe ont tt6 Ctablis. La mise au point d'une courbe d'ktalonnage pour l'analyse des emegistrements des rayons gamma est dkrite. Les points faibles des proc6dC.s utilists pour dttenniner les coefficients de transport sont traitts.
Erman Evginl and
Otto
J.
Svec2
Heat and Moisture Transfer Characteristics of Compacted
Mackenzie Silt
Authorized Reprint 1988 from Geotechnical Testing Journal. June 1988
Copyright American Society for Testing and Materials, 191 6 Race Street, Philadelphia, PA 191 03
REFERENCE: Evgin, E. and Svec, 0 . J., "Heat and Moisture Transfer the Philip and de Vries model. Experiments show that the model is
C ~ . ~ ~ c f e ~ ~ of Com~.fted hhckenzk Sm? Geotechnical Testing capable of qualitatively representing the heat and moisture trans- Journal. GTJODJ, Vol. 11, No. 2, June 1988, pp. 92-99. fer phenomena; but, it is not accurate quantitatively [ I l l if the ABSTRACT: The heat and moisture transfer characteristics of a silt transport coefficients are calculated using the physical arguments fmm the Mackenzie River Valley have been determined in a laboratory given by Philip and de Vries 141. The limitations of the model in
investigation. A dual gamma-ray scanner was used to measure the geotechnical engineering practice are given in Ref
9.
changes in density and volumetric moisture content along the soil Sam- The evaluation of the procedures was as important a part of this
ples. The coefficients of soil-water diffusivity under isothermal cor~di- investigation as obtaining the transport coefficients for a specific tions and under temperature gradients have been obtained. The devel-
opment of a calibration curve for the analysis of gamma-ray readings soil. A silty soil from the Norman Wells area along the Mackenzie has been described.
ne
shortcominas of the used for the River Valley was used in the experiments. The grain size distribu- measurement of transport coefficients have b&n discussed. tion is given in Fig. 1.KEYWORDS: moisture transfer, heat, silts, gamma-rays, evaporation, thermal conductivity
Consideration of heat and mass transfer in geological materials is an important element in the design of many engineering struc- tures such as pipelines, buried transmission lines, and under- ground radioactive waste disposal facilities. All heat generating structures (for example, boiler houses, furnace buildings, storage tanks for hot fluids, and some oil refining facilities) transfer heat to the underlying soils for a long period of time. As a result of temper- ature rise, thermal expansion takes place and the ground heaves. On the other hand, the temperature increase in the ground may result in settlement if a significant amount of moisture is lost under the influence of the temperature gradient. The heat stored in the ground causes moisture migration from high- to low-temperature regions. Subsequently, a gradient of moisture content develops, and this causes moisture movement in the opposite direction from that caused by the thermal gradient. The effects of the two simulta- neous driving forces are combined to produce the net effect. There- fore, reliable predictions of the performance of structures generat- ing heat require information on the heat and moisture transfer characteristics of soils.
The subject of soil moisture movement caused by hydraulic and temperature gradients has been investigated experimentally and theoretically by many researchers in soil sciences and engineering. Studies reported in Refs I through 3 are a few among many other contributions. The soil characteristics measured in the present study are based on the constitutive relation developed by Philip and de Vries [ 4 ] . Research
[5-81
confirms in general the validity of'Assistant professor, Department of Civil Engineering, University of Ottawa, Ottawa, Canada KIN 6N5.
2Research officer, IRC, National Research Council of Canada, Ottawa, Canada K 1 0 0R6.
Constitutive Relation
Philip and de Vries proposed Eq 1 for total moisture flux q in unsaturated soils under the combined effects of volumetric mois- ture content and temperature gradients, D9 and V
T,
respectivelywhere
De = isothermal moisture diffusivity,
DT = moisture diffusivity under temperature gradient, and
pl = density of liquid water.
GRAIN SIZE (mm) FIG. 1-Grain size distribution.
-
EVGIN AND SVEC ON COMPACTED MACKENZIE SILT
93
A term related to the gravity is omitted from Eq 1 because its CLOSED SPLIT ALUMINUM OPEN
effect is not considered in the present study. The moisture flow EN
takes place in vapor and liquid phases as a function of the gradi- --.7
ents of temperature and moisture content. The following equations
!:
n
-
give separately the vapor flux q , and liquid flux ql
2
'
J
4v-
1
- - - DTVV T - De,V 8 (2) 3 0 c m PIj
f
)
(
'I 91 0 0 0 0 0 O 0 0-
= - D T I V T L D e l V 8 (3) m6
PI ALUMINUM BOX where DT,., DTI. Dw, and De, are components of .transport coeffi-4
6mJL
cients. k 30 a m 3
The total moisture flux is obtained by adding Eqs 2 and 3. Ac-
FIG. 2-Split tube and aluminum box usedjor isothermal evaporation
cordingly, the coefficients can be written as tests.
De = Dev
+
Del (4)where E is the evaporation rate, A is the cross-sectional area of the DT = D T ~
+
DTI (" soil sample, and ( d e / d ~ ) , ~ is the volumetric moisture content gra- dient in the soil at the open end of the split tube or aluminum box. which are nonlinear functions of the volumetric moisture content This test was conducted ina
moisture and temperature regulatedand vary Over orders of magnitude for and saturated
room because the rate of drying is controlled by both the boundary
soils. conditions and physical characteristics of soil. De, and Del, which
are two components of De, were determined using the procedure described by Philip and de Vries. When the experimental results
Test P r d u r e e representing the De versus 8 relation are plotted, the curve ex-
Two types of tests were carried out to determine the transport hibits a distinct local minimum value for De at 8 = as shown coefficients. The first one was an isothermal, one-dimensional in Fig. 3. Above the critlcal value of volumetric Water Content, the evaporation experiment to obtain D ~ . In the second type of test a contribution of vapor diffusiv,ity is assumed negligible. For mois- temperature gradient was generated between the ends of the soil ture less than the contribution of liquid flow is considered
specimen to determine DT. Thermocouples were used to measure negligible.
temperatures. Moisture content measurements were taken either
by the gravimetric method or the dual gamma-ray attenuation ~ ~o f ~ T ~ l ~ ~ ~ i ~ ~
technique.
The second set of experiments was designed to evaluate DT from the steady state profile of moisture content in'a confined soil speci-
Evaluation of De men under a temperature gradient. Figure 4 shows the test setup
The test procedure followed in the present study to determine De was proposed by Gardner and Miklich [ l o ] and Shapiro and Hsi
[ I l l . Soil with uniform moisture content was compacted in the con- tainers shown in Fig. 2. The specimen was kept horizontal during evaporation from the open end'to eliminate the effect of gravity in moisture flow. The weight of moisture loss was recorded as a func-
I
tion of time. At the end of the test, the moisture profile was deter- mined either gravimetrically for the soil column in the split tube or using the dual gamma-ray scanner for the soil in the aluminum
box. For a horizontal, one-dimensional soil specimen under iso- t
0 (0
-
thermal conditions. Eq 1 reduces to d 8 4 - - D e -
- -
(6)PI dx
where d o / & is the volumetric moisture content gradient at any point x along the specimen. The diffusivity coefficient De can be
obtained from 0 01
0 2 0 3 0 4 0 5 0 6
MOISTURE CONTENT, 8
,
cm3 /em3E - 1
De =
-
(7)API (de/dx)end FIG. 3-Transport coej)cclents as o function of moisture content [7].
i
94
GEOTECHNICAL TESTING JOURNALFIG. 4-Variable temperature test apparatus with rectangular cross sec- tion.
for this type of experiment. When the temperature and moisture content distributions reach a steady-state, the following equation can be written
The determination of DT requires, therefore, the results of both types of tests. Once the results for the Do versus 8 relation and
d W d x are obtained from the isothermal evaporation test, they are
substituted in Eq 8 along with the results of the temperature gradi- ent tests. The DT values evaluated a t different locations along the specimen can be plotted against 8 to establish the functional rela- tion between DT and 8. The division of DT into its components,
DTv and D T l , is based on the assumption that the curve represent-
ing the DT versus 8 relation has a considerable change in its slope at some moisture content value below which the moisture flow caused by temperature gradient takes place in vapor phase and above that value of moisture content the liquid flow is the main component of the moisture flow.
Dual Gamma-ray Scanner
The gamma-ray scanner used in this study is shown schemati- cally in Fig. 5. Cesium-137 (Cs) and Americium-241 (Am) isotopes are used in this equipment as in most dual gamma-ray scanners. When these radioactive sources are used simultaneously, the strong source, Cs, affects the count rates of the weaker source, Am. The analysis of experimental data requires the removal of the Cs effects from the Am reading.
Several methods have been described in the literature for the analysis of complex gamma spectra; they are summarized in Ref
12. A direct method which is called the "Total Peak Area" (TPA) has been employed in the present work.
Figure 6 shows, in general, a complex gamma spectrum for the Am and Cs isotopes, in which the number of counts recorded by the detector is plotted against the energy level of each channel in the recorder. According to the TPA method, a "baseline" is drawn, as indicated in the figure, to divide the area under a peak into two sections. It is assumed that the counts above the baseline
PLATFORM-I
SPECIMEN
A
SI
-
EXTERNAL S W E R D-
DETECTOR S2- INTERNAL SHUTTER P-
PHOTOMULTIPLIER CI-
C 4 - COLLIMATION BLOCKSFIG. 5-Schematic diagram of gamma-ray scanner.
PEAK AREA
ENERQY LEVEL OF EACH CHANNEL
FIG. 6-Determination of the area under a peak in TPA method.
are due to the isotope associated with the energy level of the peak and that the area below the baseline corresponds t o the back- ground radiation plus the scatter from the other isotope. For each peak, the counts from all the channels between the left and right limits of the area are added first. The number of counts corre- sponding to the area under the baseline is then subtracted from the total. Equation 9 is used to calculate the area above a linear base- line
R
AREA =
C
ai-
( a ~-
a ~ ) ( R - L + 1 )i=L 2
where
ai = number of counts in channel i,
L = channel number at left limit of peak, and R = channel number a t right limit of peak.
In the present study, the accumulated information during the use of TPA method has resulted in the development of a calibra- tion curve shown in Fig. 7. The Cs influence on the Am count rates was not random, but it was correlated to the cesium counts through a well defined relationship.
In order to find the count rates, IAm and Ic,, the number of counts obtained from Eq 9 was divided by the length of time the shutter was open. I A m and Ic, were used in Eqs 10 and 11 to calcu- late the moisture content and density of soil
were needed to obtain De for a large range of moisture content. 24,
n I I 1 I I I 1 The amount of moisture loss from the open end during the evapo-
I
4
ration is shown in Figs. 8 and 9 as a function of time. At the end of1
the evaporation period, the moisture content distribution along the soil sample was determined. Figure 10 shows the measured values1
/.
/ of the volumetric moisture content.
1
-
The experimental values of the isothermal soil-water diffusivity-
De are plotted in Fig. 11 as a function of volumetric moisture con-!
-
/'
tent. Within the range of moisture content used in these experi-
-
ments, the diffusivity De reached a local minimum around 0&, =
-
7 cm3/cm3. Dry densities of the soil specimens a t the beginning of
-
@I- the isothermal evaporation tests are given in Table 1. In addition t o
,/-
-
I I I I I t the initial differences among the specimens, the dry density pd,
20 40 60 100 120 140 160 180 along each soil sample changed further during drying as a function
CI-ST COUNTS. m3cpm (ENERGY wn- 575- TSO K.V of changes in volumetric moisture content. Therefore, the pd, a t the data points shown in Fig. 11 are not exactly the same; their FIG. 7-Cs-I37 influence on Am-241 readings in present study. values are given in Table 1.
where
I:,, I:, = intensities of gamma-rays through air.
PA,.
pi,,, = mass attenuation coefficients of water and silt for Am source,p;,, p;, = mass attenuation coefficients of water and silt for Cs source,
p ' , p * = densities of water and soil solids, and
x ' . x " = thickness of water and soil solids.
In these two equations, x ' and x " are the unknowns. Once x ' and
x " are determined, they are used t o find the density and moisture
changes in the soil.
Measurement of Coefficient of Therrnal Conductivity
The thermal conductivity of the soil has been determined by us- ing a standard conductivity probe, which had high precision ther- mistors with accuracy +O.OOS°C. The details of this test can be found, for example, in Ref 13.
Experimental Results
The transport coefficients measured in the present experimental study on the Mackenzie silt are presented in the following.
Transport Coejficient De
The silty soil with a uniform initial moisture content was com- pacted. approximately in 1 -cm layers, into one of the molds shown in Fig. 2. In the cylindrical mold, each layer received 5 blows from a 676-g tamping rod dropped from 7-cm height. A different tamp- ing rod was used for the compaction of soil into the rectangular mold. The conlpaction energy used per unit mass of soil, however. was kept constant for soils in both types of molds. All specimens, were kept closed for about 24 h to reduce any moisture content variation caused by the compaction. Subsequently, evaporation from one end was allowed for about 6 h in most cases. The evapora- tion time was around 24 h for the remaining samples. Variations in both the initial moisture content and the total evaporation time
EVAPORATION TIME, hours
FIG. 8-Isothermal evaporation curves.
EST- 6
4
V) W a TEST- 72
2 0 EVAPORATION TI ME,
hour* FIG. 9-Isothermal evaporarion curves.96
GEOTECHNICAL TESTING JOURNALTABLE 1-Dry densities of soil specimens. Specimen Number
Parameters 1 2 3 4 5 6 7
Initial p,,, kg/m3 1446 1440 1570 1458 '507 1690 1581
Final p,,, kg/m3 1630 1629 1735 1555 1655 1702 1550
" - - o ~ n - - - - { TEST- 3
placed at both ends of the cell to impose a thermal gradient on the soil specimen. In order to reduce any moisture content variation that might be caused by the compaction, the sample was kept at room temperature overnight. The next day, the test started with the application of a temperature gradient. The heat flux at both ends of the specimen was measured by the heat flow metres. Some of the details of the heat flow meter are given in Ref 14. The tem- perature distribution in the soil specimen was measured by a set of thermocouples located at the interface of the cell wall and the soil. Two tests were carried out with different temperatures applied at the ends of the soil specimen. For both tests, the initial tempera- ture of the soil was 23OC, and the initial volumetric moisture con- tent was 0.172 cm3/cm3. The dry density was 1629 kg/m3 for both specimens. The tests were initiated by circulating a liquid through
DISTANCE FROM OPEN P I D , cm
FIG. 10-Moisture content distribution along soil specimens.
0 I
g
loo 0 \ N!
* C 10.
0 a 0 w \ N 0 . 1 3 HOURS AFTER A 0 . 4 0 HOURS AFTER INITIAL TEMPI
0 0.05 0.1 0.15 0.2 0.25 MOISTURE CONTENT, 0 , c a 5 / c m ~FIG. 11-Transport coefficients as a function of volumetric moisture content.
0
0 1 2 3 4 5 6 7 8 9 1 0 1 1
LENGTH. cm
Transport Coefficient
DT
To obtain the coefficient
DT,
the soil specimen with a uniform moisture content was compacted in a specially designed plexiglas cell shown in Fig. 4. Liquid cooled/heated heat exchangers wereFIG. 12-Temperature and moisture content distribution along the specimen.
EVGlN AND SVEC ON COMPACTED MACKENZIE SILT
97
each end plate. Two temperature baths were used to keep the tem-peratures of the end plates at the specified values. The change in temperature of the end plates from the initial room temperature to the specified values took only a few seconds. During the tests, the temperatures at the surface of the ends of the soil specimen were
kept constant with a variation less than
O.l°C.
The temperatureand moisture content along the specimen between the two ends, however, changed with time until a steady state was reached. In the
first test, the temperatures at each end of the specimen were
8.2
and
41.2OC.
In the second test, the temperatures were26.5
and43.0°C.
The measured steady state profiles of temperature and volumet-
ric moisture content are. shown in Figs.
12
and13.
The tempera-ture distribution along the specimen was linear except at the ends. The steady state moisture content was reached in about two weeks. However, the temperature profile was almost at its steady state
level about
1
or2
h after the beginning of the test. This is demon-strated in Fig.
14,
where the measured heat flux at the ends of thesoil specimen is shown as a function of time. The temperature pro- file in the experiment where the temperature boundary conditions
were
8.2
and41.2OC
reached the steady state in approximately 1 h,but the heat flux at the warm end was still decreasing for a number of days. This process coincided with a slow moisture transfer and further drying of a thin layer of soil next to the warm plate.
-
0. I 3 nouus AFTERA 0.53 HOURS AFTER
I
0 2.00 HOURS AFTER1
(SAME A S END OF TEST)
1
u C
5
20r---
lNlTl4L TEMP - 0 0 1 2 3 4 5 6 7 8 9 1 0 1 1 LENGTH.
cmFIG. 13-Temperature and moisture content distribution along the specimen.
10 ---- COLD END
(Y
E 9 -
TtlEomIcaL STEADY STATE
3
-
2 - I - 0 1 0 0. S 1.0 L S 2 0 I 2 3 4 5 6 7 0 9 10 11 I2 HOURS MYS TIMEFIG. 14-Heatflw as a function of time.
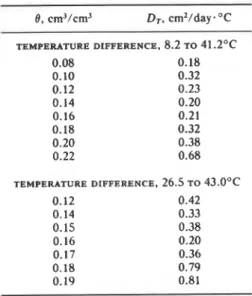
The diffusivity coefficient
DT
was determined from Eq8.
Table2
shows the values of
DT.
These results are also plotted in Fig. 11 forthe test with the end temperatures
8.2
and41.2OC.
The curve rep-resenting the
DT
versus 8 relation showed a significant change inslope around 8 =
0.15
cm3/cm3. It can be assumed that for 8 lessthan
0.15
cm3/em3, the moisture flow is mainly in vapor form. Tothe right of the local minimum the liquid flow is the main compo- nent of the moisture flow under the temperature gradient. The
data provided in Table
2
show that theD T
values obtained fromtests with two different temperature ranges differ significantly.
This suggests that the transport coefficient
DT
is also a function ofthe temperature gradient across the soil specimen. Additional tests, however, would be necessary to confirm this possibility.
Coefficient of Thermal Conductivity
The thermal conductivity measurements for the silty soil are
given in Table
3.
In general, the coefficientK
is a function of thesoil type, mineral composition, dry density, temperature range,
and most importantly the moisture content. Table
3
shows, toTABLE 2-Coefficient of soil-water diffusivity under temperature gradients.
98
GEOTECHNICAL TESTING JOURNALTABLE 3-Thermal conductivity of Mackenzie silt usinfi various compositions.
- Sample Unit Parameters F 2 3 4
I
w,"% pdyr kg/m3 1456 6.0 1466 9.7 1670 15.4 1674 19.9 PW,, kg/m3 1544 1713 1927 2005 K. W/m°K 0.72 f 0.28% 1.20 f 0.33% 1.58 f 0.49% 1.60 f 0.58%"w = water content by weight.
some extent, the influence of moisture content on K. Additional
experiments would be necessary if the influence of each variable on the coefficient of conductivity is required.
Discussion
The measurement of the transport coefficients presented here required a considerable time because of the difficulties encoun- tered in the calibration of the dual gamma-ray scanner. Different methods used previously [15] in the geotechnical field to calibrate a dual gamma-ray scanner were not applicable in this case for the
reasons explained in Ref 16. The calibration curve shown in Fig. 7
is unique for a given scanner with a constant collimation size and a fixed distance between the source and the detector. The determina- tion of a calibration curve takes only a few hours once the method
3. The use of a calibration curve accelerates the analysis of the
results of a dual gamma-ray scanner, and it yields satisfactory results for the measurement of density and volumetric moisture content.
4. Future research is needed to accurately measure the volumet-
ric moisture content gradient in soils a t very low moisture content. This will in turn be used to calculate more reliable transport coeffi- cients.
Acknowledgment
The authors gratefully acknowledge the assistance provided by the Institute for Research in Construction, National Research Council of Canada.
is established.
References
The transport coefficients obtained a t very low moisture content
values may not be very accurate because of possible errors involved [I] Gum, C. G., Marshall, T. J., and Hutton, J. T., "Movement of Water
in the measurement of the gradient of moisture content in a nar- in Soil Due to Temperature Gradients," Soil Science. Vol. 74, 1952,
u
row, very dry zone. This problem exists both in isothermal tests pp. 333-345.
[2] de Vries, D. A., "Simultaneous Transfer of Heat and Moisture in Po-
and thermal gradient tests. More reliable measurements of d e / & rous Media." Transactions of the American Geophysical Union. Vol.
can be obtained by using a narrower collimation. I11 the present 39. 1958, DR. 909-916.
study the collimation height was
-
2 mm. In all the tests. it was as- 131 Taylor, S.A. andCary, J. W., "Linear Equation for the Simultaneoussumed that the moisture flow was one dimensional. During the Flow of Matter and Energy in a continuo& Soil System," Soil Science
Society of America Journal. Vol. 28, 1964, pp. 167-172.
evaporation period in an isothermal test, the soil shrinks continu-
Iql J . R. and de Vries, D. A., '.Moisture Movement in Porous Ma-
ously. In the present investigation, it was assumed that the soil did terials Under Temoerature Gradients." Transactions of the American
not shrink sufficiently t o reduce its cross section and result in a gap Geophysical ~ n i o i . Vol. 38, 1957, 222-232.
between the soil and the container. This would invalidate the as- [51 Cassel, D. K., Nielsen, D. R., and Biggar. J. W., "Soil-Water Move-
sumption of one-dimensional moisture flow. Experiments with ini- ment in Response to Imposed Temperature Gradients," Soil Science
Society of America Journal, Vol. 23, 1969, pp. 493-500.
tially saturated silts and clays would require a different test ar- 161 D ~B. -A ~~ ~ ~~~ ~for ~predicting ~~~~~~d d~ ~~ l h , H~~~ ~ ~ ~ ~ i ~ ~ ~
rangement because the shrinkage would be excessive, and the soil and Water Movement in Unsaturated Soil." International Journal of
would separate from the rigid container. A flexible membrane with Numerical Analysis Methods in Geomechanics. Vol. 2, 1978, pp. 19-
negligible permeability would be more suitable, if it could follow 36.
[q
Gee, G. W., "Water Movement in Soils as Influenced by Tempera-the shrinkage of soil, to justify the assumption of one-dimensional ture Gradients," Ph.D. dissertation, Washington State University,
moisture flow. Pullman. WA. 1966.
181 ~ o ~ h o c l ~ o u s , M. A., "Analysis of Heat and Water Transport in Un-
saturated-saturated Porous Media." Ph.D. dissertation, University of
Alberta, Edmonton. Alberta. Canada. 1978.
I 191 Dakshanamurthy V. and Fredlund, D. G., "A Mathematical Model
The main conclusions of the experimental work may be summa- for Predicting Moisture Flow in an Unsaturated Soil Under Hydraulic
1
rized as follows: and Temperature Gradients,'' Water Resources Research. Vol. 17.1981, pp.-714-722.
1. The relation between the transport coefficients and volumet- 1101 c a r d n e r , W , R, and ~ i k l i ~ h , F. J . , -unsaturated
~~~~~~-i~it~
andric moisture content of a compacted Mackenzie Valley silt was sim- Diffusivitv Measured bv a Constant Flux Method." Soil Science. Vol.
ilar to that of other soils tested by Refs 4.7.8, and 1
i.
93, 1 9 6 2 , ~ ~ ~ . 271 -274.-2. The measurement of the transport coefficient DT requires [ I l l Shapiro, H. N. and Hsi, M. Y.. "Experimental Determination of
Transport Coefficients for Soil." Engineering Research Report ENG
considerable time, about 2 to 3 weeks, because the steady state of 77-06201. Department of Mechanical Engineering. Iowa State Uni-
i moisture content must be attained for a given temperature gradi- versitv. Ames. 1A. 1979.
-
EVGJN AND SVEC ON COMPACTED MACKENZIE SILT
99
vation Analysis," Analytical Chemistry. Vol. 43, No. 3, 1971, pp. 1151 Goit, J . B., Groenevelt, P. H., Kay, B. D., and Lock, J. G. P., "The
405-410. Applicability of Dual Gamma Scanning to Freezing Soils and the
1131 Farouki, 0. T., "Thermal Properties of Soils," Monograph 81-1, Problems of Stratification," Journal of Soil Science Society of Amer- U.S. Army Corps of Engineers, Cold Region Research and Engineer- iia. Vol. 42. 1978, pp. 858-863.
ing Laboratory, Hanover. NH. 1981. [16] Evgin, E., "Analysis of Complex Gamma Spectra," BRN 238, Divi-
(141 Bomberg. M. and Solvason. K. R., "Comments on Calibration and sion of Building Research, National Research Council of Canada, Design of a Heat Flow Meter," Thermal Insulation. Materials, and 1985.
Systemsfor Energy Conservation in the '80s. STP 789. American Soci-