ESD-WP-2013-10
June 2013
Carbon Efficiency of Humanitarian Supply Chains:
Evidence from French Red Cross operations
Peter Oberhofer
Institute for Transport and Logistics
Management
WU Vienna
Nordbergstr. 15, 1090 Vienna
Edgar Blanco
Center for Transportation & Logistics
Massachusetts Institute of Technology
77 Massachusetts Avenue, E40-276
Cambridge, MA, U.S.
Anthony J. Craig
Center for Transportation & Logistics
Massachusetts Institute of Technology
77 Massachusetts Avenue, E40-276
Cambridge, MA, U.S.
esd.mit.edu/wps
This paper will be presented at the following conference:
Chains: Evidence from French Red Cross
operations
Peter Oberhofera / Edgar Blancob / Anthony J. Craigb
a Institute for Transport and Logistics Management, WU Vienna, Nordbergstr. 15, 1090 Vienna,
Austria
b Center for Transportation & Logistics, MIT, 77 Massachusetts Avenue, E40-276, Cambridge,
MA, U.S.
Abstract: Natural catastrophes are often amplified by man-made impact on the
environment. Sustainability is identified as a major gap in humanitarian logistics research literature. Although humanitarian supply chains are designed for speed and sustainability is of minor concern, environmentally-friendly behavior (e.g. through reduction of transportation emissions and avoidance of non-degradable materials) should be a long-term concern as it may ultimately affect more vulner-able regions. The purpose of this paper is to illustrate how green house gas emis-sions can be measured using the supply chain of common relief items in humani-tarian logistics. We analyze the CO2 emissions of selected supply chains by performing Life Cycle Assessments based on data provided by the French Red Cross. We calculate the CO2 emissions of the items from ‘cradle to grave’ includ-ing production, transportation, warehousinclud-ing and disposal. Usinclud-ing these calcula-tions, we show that transporting relief items causes the majority of emissions; however, transportation modes may not always be changed as the main purpose of humanitarian supply chains is speed. Nevertheless, strategic and efficient pre-positioning of main items will translate into less transportation and thus reducing the environmental impact. The study also shows that initiatives for “greening” item production and disposal can improve the overall carbon efficiency of hu-manitarian supply chains.
Keywords: Humanitarian Logistics, Sustainability, Environment, Carbon
1 Introduction
Over the past few decades, sustainability has become a global issue. In humanitar-ian research, and particularly, in humanitarhumanitar-ian logistics research, it is gaining in importance as natural catastrophes are often amplified by human impact on the environment. Although humanitarian supply chains are designed for speed and sustainability is of minor concern, environmentally-friendly behavior should be a long-term concern as it may ultimately affect more vulnerable regions.
The purpose of this paper is to evaluate the ecological efficiency of supply chains of main relief items, taking into account the specific characteristics and difficulties of humanitarian logistics. Thereby, we compare major and minor operations as well as proactive and reactive supply chains and aim at recommending areas for improvement. The analysis includes the evaluation of the environmental impact of various disposal scenarios of the relief items. Calculations of carbon efficiency are based on the Life Cycle Assessment (LCA) using data of the French Red Cross from their response operations in the 2010 Haiti earthquake and floods in Mozam-bique and Reunion Island in 2011. We considered the environmental impact of the relief items from ‘cradle to grave’, including production, warehousing, transporta-tion and disposal.
The remainder of this paper is structured as follows: Section 2 is a literature analy-sis of the research topic. Sections 3 and 4 presents the methodological approach and the Case Study. In Section 5 we analyze the data and show findings. Finally, Section 6 discusses the findings and closes with concluding remarks.
2 Literature
Humanitarian aid comprises a mixed array of operations and covers both disaster relief and continuous support for developing regions (Kovács and Spens 2007). The term “disaster relief” is generally connected to foreign interventions following sudden catastrophes, such as natural disasters (floods, earthquakes, etc.) or man-made disasters (terrorist attacks or nuclear accidents) with the intention of sup-porting affected locals (Long and Wood 1995). In general, actions have to fulfill the principles of humanity, neutrality and impartiality to constitute a humanitarian operation (Tomasini and Van Wassenhove 2009).
A variety of institutions are involved in relief operations. The main actors are non-governmental organizations (NGOs), such as the Red Cross, which coordinate and ‘operate’ relief operations. Governmental organizations are mainly responsible for providing financial funds, while business organizations produce and sell relief items. Additionally, private donors, media and military are important players in re-lief operations (Kovács and Spens 2007).
Various authors define different numbers of (time) phases of relief management (Cottrill 2002; Lee and Zbinden 2003); in general, they can be summarized as a
phase of preparation, an immediate response phase and reconstruction (Kovács and Spens 2007). A high degree of preparation is usually performed in areas with a high risk of catastrophes (e.g. Caribbean Sea). Here, evacuation plans are devel-oped beforehand and items are often pre-positioned. In less develdevel-oped countries, however, the magnitude of disaster consequences is amplified due to poor living conditions, infrastructure and construction (Kovács and Spens 2007; Thomas 2003). Where possible, many relief agencies have pre-purchasing agreements with suppliers for the most commonly needed items, such as drugs, sheetings or blan-kets. As speed is essential for humanitarian aid operations, lead time reduction needs to be further considered in contracts with these producers (Tomasini and Van Wassenhove 2009).
The ‘success’ of humanitarian aid operations is often dependent on the efficiency and effectiveness of logistic flows. Logistic activities comprise procurement, transportation, tracking and tracing, customs clearance, warehousing. Particularly procurement and transportation are among the most expensive parts of relief op-eration, making logistics a critical and important factor, also from a financial point of view. Nevertheless, there is still a lot of room for cutting costs through opera-tional efficiency and effectiveness (Thomas and Kopczak 2005).
Being confronted with very specific conditions, humanitarian supply chains sig-nificantly differ from ‘normal’ business supply chains (Kovács and Spens 2007). Main characteristics of humanitarian supply chains can be summarized as follows: ambiguous objectives of different actors, limited resources (human, capital, infra-structure), high uncertainty, urgency and politicized environment (Tomasini and Van Wassenhove 2009). By contrast, most business supply chains usually deal with a determined set of partners and a more or less predictable demand (Kovács and Spens 2007; Tomasini and Van Wassenhove 2009). As most logistics depart-ments track their goods, there is important data, covering various aspects from supplier-effectiveness, costs and speed of response to information management that can be analyzed for post-event learning (Thomas and Kopczak 2005).
Despite the fact that humanitarian supply chains are designed for speed and flexi-bility, and that ecological sustainability is of minor concern, environmentally-friendly behavior has to secure a certain standard of living in general, and in af-fected regions in particular, in the long run. Kovács and Spens (2011) identify sustainability – both in practice and in research – as a major gap in humanitarian logistics. Besides economic and social aspects, environmentally-friendly behavior is important as climate change remains one of the utmost challenges. Moreover, sustainable ‘exit strategies’ need to focus, among others, on reducing transporta-tion emissions and avoiding of degradable materials for humanitarian products. Particularly, reverse logistics is identified as an important topic that is yet to be re-searched (Kovács and Spens 2007).
A literature analysis revealed that humanitarian logistics has gained in importance as a subject of academic research over the past few years. Various topics are ad-dressed, such as inventory management, vehicle fleet optimization, the identifica-tion of learning areas for business supply chains or analyses of trends and gaps (Kovács and Spens 2007, 2011; Pedraza-Martinez and Van Wassenhove 2012). Although authors have repeatedly called for more academic research on ecological sustainability in humanitarian logistics (Kovács and Spens 2011; Pedraza-Martinez and Van Wassenhove 2012), there is still very little research. Carbon ef-ficiency of humanitarian supply chains, in particular, can be identified as a main research area lacking detailed empirical work.
3 Research Design and Methodological Approach
A case-based approach using multiple field studies to analyze the carbon effi-ciency of humanitarian supply chains was chosen. As there is little evidence of carbon footprinting calculation aiming at evaluating the product life cycle of relief items, this study is both exploratory and explanatory in its nature. The case study approach is common in purchasing and supply management research (Dubois and Araujo 2007).
‘Carbon Footprinting’ is one of the most widely applied methods of measuring environmental sustainability. It is useful regarding emission management and the evaluation of mitigation measures (Carbon Trust 2012). Through quantifying emissions of certain measures, business units and other areas of reduction goals can be identified, and processes can be measured. A widespread definition was of-fered by Wiedman and Minx (2008) stating: “The Carbon footprint is a measure of the exclusive total amount of carbon dioxide emissions that is directly and indi-rectly caused by an activity or is accumulated over the life stages of a product.” (Wiedmann and Minx 2008).
In order to measure the carbon footprint of a product from ‘cradle-to-grave’, tak-ing into account all the various stages within a supply chain from the production to the disposal of a product, Life Cycle Assessment (LCA) was performed. “The as-sessment includes the entire life cycle of the product, process or activity economic passing extractions and processing of raw materials, manufacturing, transportation and distribution, use/re-use/maintenance, recycling and final disposal” (Society of Environmental Toxicology and Chemistry (SETAC) 1990). LCAs are very data-intensive, and the data often defines the success of the Assessment (Curran 1996). Following the guideline of the European Environmental Agency (European Environmental Agency 1997), we conducted the LCA study in four major steps: (1) Goal and scope definition, (2) Detailed life cycle inventory (LCI), (3) An as-sessment of the potential impacts (4) Result Interpretation.
Based on data from the French Red Cross on three disaster relief operations, our goal was to calculate the CO2 emissions of three commonly used relief items from
‘cradle to grave’ including production, transportation, warehousing and end-of-life waste disposal.
4 Case Study: Carbon efficiency of humanitarian supply
chains (French Red Cross)
The Red Cross subdivides items according to the Emergency Response Units (ERU), differentiating between Logistics, IT & Telecommunication, Water & Sanitation, Medical Help, Relief and Base Camp IFRC (IFRC 2013a). The focus of our analysis is on relief items for personal use or housing (cotton blankets, jer-rycans, plastic sheeting). In the following, the four analyzed items and the logistic flows will be described:
Item No.1 is a woven blanket (100% cotton, 1.2x1.8m, light, weight: 250g/m2) that is packed in triple corrugation cardboard boxes (H: 0.5 x W: 0.4 x L: 0.6 m) for shipping. Item No. 2 is a woven plastic sheeting (4x60m, weight: 198 g/m2) consisting of high-density polyethylene (HDPE) with low density polyethylene (LDPE) coating on both sides. The tarpaulins are wrapped as cubic bales (dimen-sions: ca. 800mm x 600mm x 150mm) for shipping. The jerrycan (item No.3, foldable, 10L, weight: 0.14 kg) is blow-molded and made of low density polyeth-ylene plastic (LDPE) including an injection molded screw cap. It is packed in a plastic bag (polyethylene, 5g) for shipping (IFRC 2013b).
Emissions from warehousing are caused by consumption of fuel oil, natural gas and electricity. Based on information from the U.S. Energy Information Admini-stration (U.S. Energy Information AdminiAdmini-stration (EIA) 2003), which provides average values based on used space (m3), we calculated the emissions according to
the metrics of the shipped item units and the duration of storage. Depending on the location of the warehouse, the emission factors from energy consumption were adopted according to information from Greenhouse Gas Protocol (WRI 2012), and the French Environment and Energy Management Agency (ADEME), as energy mixes can vary significantly from country to country. Emission calculation for transportation was based on the weight of the shipments, the distance from origin to destination and the main transportation modes used. For disposal, we differenti-ated between recycling, landfill and incineration. Emissions were calculdifferenti-ated using information from SimaPro and the U.K. Department for Environmental, Food and Rural Affairs (U.K. Department for Environment 2012). In consultation with the French Red Cross, we defined the option ‘no action’ to be equivalent to ‘landfill’ as the disposal of items is often not considered.
The carbon footprints (measured in CO2-equivalents) were calculated by using the SimaPro software tool (PRé 2013) based on information about sizes and weight of item materials, packaging, involved production processes, transportation mode and warehouse location. To calculate emissions SimaPro uses default data of emissions from raw material extraction, manufacturing, transportation, energy and
disposal default data from Ecoinvent, a leading supplier of life cycle inventory data of renowned quality offering science-based, industrial, international LCA data and services (Ecoinvent 2013). For each emission generating activity data was collected regarding the amount of emissions generated and the quantity of re-lief items involved in the activity. In this manner the emissions can be allocated to the items and processes in order to determine the carbon footprint of the respective items produced, stored, transported and disposed. For data that was not directly available from the French Red Cross, estimates were made from secondary data sources. According to the French Red Cross, the selected three cases provide a good insight into their relief operations. The final emission factors were calcu-lated on the basis of one individual item including packaging proportionally. The data includes detailed information about relief operations of a ‘major’ crisis caused by the earthquake in Haiti (HT) in 2010, and two ‘minor’ crises, caused by floods in Mozambique (MZ) and Reunion Island (RE) in 2011. For selected sup-ply chains, it specifies the quantity of sent items, the location (city) of production and warehouses for temporary storage, main transportation modes used, last mile distances as well as disposal options used. A total of 25,083 items (6,630 blankets, 3,993 pieces of plastic sheeting and 14,460 jerrycans) are included in the analyses of the Haitian operation, and 10,250 (2,010 blankets, 2,100 pieces of plastic sheet-ing and 6,140 jerrycans) in the analysis for the minor operations in Mozambique and Reunion Island. The selected items are mainly produced in Turkey, Pakistan or China on a ‘make-to-order’ scheme. Depending on time pressure and the avail-ability of pre-positioned relief items, the goods are transported either by ship or plane from various distribution warehouses. Last miles are covered by trucking. For the Haitian case, the operation can be divided into three phases (similar for all major crises!). In the first phase (from outbreak of crisis up to two months) the ini-tial shipments are sent from the different pre-positioned stocks nearby the inter-vention zone owned by the French Red Cross (e.g. Guadeloupe). The pre-positioning strategy allows cutting intervention timelines, costs (transport via sea vs. air) and emissions (as a side effect). The supply chain can be considered as proactive in this phase. Besides, air shipments from Paris quicken the French Red Cross support, as its main concern is that of minimizing response time whereas costs or emissions are not considered. Planes (mostly Iliouchines, capacity: 100t) are chartered and loaded at full capacity; however, back hauls are mainly empty. In the second phase (from 2 months to 4 months) the supply chain evolves from proactive to reactive due to stock shortage at different levels (manufacturers, dis-tributors). To cut response time, items at different stages in the supply chain need to be transported mainly by plane. Additionally, different sourcing solutions need to be introduced. Due to the stock-out situation of preferred suppliers in Turkey and Pakistan, items are mainly obtained from China. In a third phase, a parallel supply chain with larger volume and longer lead times is introduced, thus allowing
sea transport. It is still reactive but optimized in terms of costs (and emissions). Besides, (continuous) air transportation is used to balance out missing items. Operations for minor crises can mainly be covered by pre-positioned stocks on sea transport. If necessary, air transportation supports the operation. In general, sup-pliers are able to provide products on a normal scheme.
5 Results
The totality of all items included resulted in emissions of about 2,380 t CO2-equiv. which is equivalent to annual emissions of 469 passenger cars (U.S.) or 61,370 trees to sequester the emissions (U.s. Environmental Protection Agency 2013). Accounting for 56% of all emissions, transportation has the by far strongest impact, followed by item production (39%). In all analyzed operations, ‘no ac-tion’ to dispose of the used relief items was performed, resulting in emissions of 41,100 kg equiv. (2%), while warehousing accounted for 59,600 kg CO2-equiv. (3%).
5.1 Analysis “major vs. minor operations”
25,083 items were included in the analysis of the relief operation in Haiti (major crisis), out of which a total of 1,974 t CO2-equiv. was emitted (equivalent for an-nual emissions of 389 passenger cars (U.S.) or 50,900 trees to sequester the emis-sions). Of those, 65% can be assigned to transportation, 32% to item production, 2% to warehousing and 1% to disposal. On average, one item resulted in 79 kg CO2-equiv. and the share of emergency shipments in our case study was 54%. 10,250 items were included in the analysis of the minor operations (Mozambique and Reunion Island), which resulted in a total of 388,500 kg CO2-equiv. (equiva-lent for annual emissions of 77 passenger cars (U.S.) or 10,000 trees to sequester the emissions). Here, item production (310,500 kg CO2-equiv.) accounted for 80% of the emissions, while 16% of the emissions were due to transportation, 1% to warehousing and 4% to disposal. On average, one item resulted in 38 kg CO2-equiv. The share of emergency shipments was 38%.
Table 5.1 summarizes average emissions from different steps in the supply chain of the analyzed items. Plastic sheeting causes the highest emissions. Compared to jerrycans, blankets and plastic sheeting are “production-intensive”, and emissions from disposal are relatively high. Jerrycans, on the other hand, cause relatively high emissions from warehousing.
Table 5.1: average emissions of relief items from all operations
5.2 Analysis by item, strategy and type of crisis
By focusing on selected supply chains of the three items separately, we aim at analyzing emissions within the logistics operation in detail. We differentiate be-tween major (Haiti, HT) and minor operations (Mozambique, MZ/Reunion Island, RE) as well as pre-positioned stock and emergency shipment.
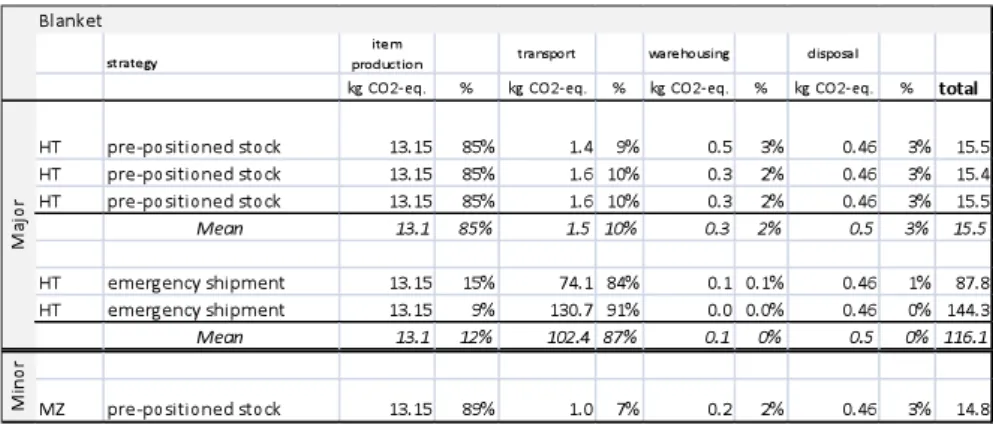
Looking at the example of a blanket within the Haiti operation, significant results can be observed (table 5.2). While item production causes 85% of the emissions in the pre-positioning strategy, it accounts for only 12% in the reactive supply chains. This is due to the enormous emissions from transportation in reactive sup-ply chains (87%) which rise up to 102 kg CO2-equiv. for a blanket on average. Emissions from warehousing, however, are higher in the pre-positioning strategy, its share generally being very low.
Table 5.2: emissions caused by a blanket
Compared to blankets and jerrycans, the high emissions caused by plastic sheeting stem from production and disposal (Table 5.3) resulting in the highest average of total emissions per item among the three analyzed items (134 kg CO2-equiv.). This is mainly due to its composites (HDPE and LDPE), which are relatively emission-intensive in production and disposal (6 kg CO2-equiv.). As could be ob-served for a blanket, production accounts for the majority of emissions in
pre-positioning strategies (88-90%), while emissions from transportation makes up 77% in reactive supply chains.
Table 5.3: emissions caused by a piece of plastic sheeting
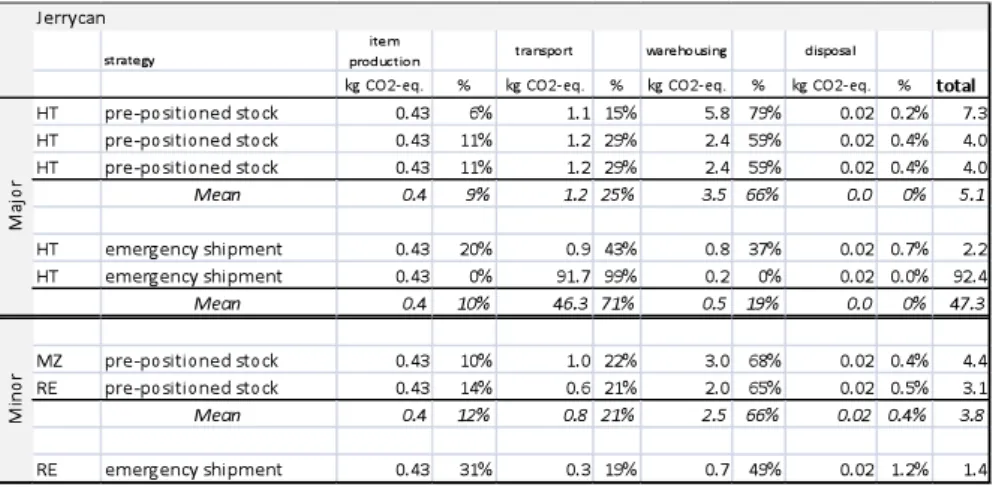
Jerrycans cause relatively high emissions from warehousing in prepostioning strategies (66% of emissions) (Table 5.4). Emissions from production, transporta-tion and disposal are rather low. Again, an increase in transportatransporta-tion emissions can be observed in reactive supply chains.
Table 5.4: emissions caused by a jerrycan
In order to highlight the impact of the strategy applied, the following figure should illustrate differences in emissions between pre-positioned stock and emergency shipment, taking the example of a piece of plastic sheeting in the Haitian case:
Figure 5.1: emissions from emergency shipment and pre-positioned stock of a piece of plastic sheeting in the Haitian operation
Emissions per item from emergency shipment rise up to 624 kg CO2-equiv. while pre-positioning an item causes only 152 CO2-equiv.. Particularly emissions from transportation increase significantly in emergency shipments compared to the use of pre-positioned stock (mainly due to air transportation). Main findings are simi-lar for major and minor operations. In general, minor operation can mainly be covered by pre-positioned stock, explaining lower average emissions when com-paring “major vs. minor operations”.
5.3 Analysis of emissions from disposal and evaluation of scenarios
Generally, items are left with the locals beyond the time of the agencies’ active re-lief operations. However, serious environmental impacts are connected to the end-of-life cycle of the items as many affected countries lack facilities to handle used items. For all analyzed operations ‘no action’ (e.g. landfilling) for item disposal was selected resulting in total emissions of 41,100 kg CO2-equiv. Disposing of plastic sheeting (with `no action`) are most harmful with 6 kg CO2-equiv. per item, while a blanket causes disposal emissions of 0.5 CO2-equiv. and a jerrycan 0.02 CO2-equiv.. In the following we evaluate the following scenarios: (1) recy-cling in response area (provision of facilities necessary), (2) transportation of items to Europe (Paris) and recycling ‘at home’, (3) incineration in response area. Recycling all items properly would cause emissions of 7,000 CO2-equiv., equal-ing a reduction of 83%. However, this would require proper facilities in the re-sponse areas which, are rarely existent. Building these facilities would result in high costs for donors and expenses for educating locals. Back hauls of used items to countries which provide adequate recycling facilities would be a second option. A fictitious scenario in which all items would be transported back to Paris via ocean transport as main transportation mode and by recycled there would result in
total emissions of 42,500 kg CO2-equiv. Although this scenario almost equals the amount of emissions from ‘no action’ (41,100 kg CO2-equiv.) it could improve the overall situation when using free ocean transportation capacity from non-balanced trade flows. If capacities allow only a part of the items to be hauled back, carbon-intensive items, such as plastic sheeting, should be prioritized. Neverthe-less, costs and organizational expenses would increase in such a scenario. Eventu-ally, incineration would result in emissions of 996,100 kg CO2-equiv. (increase of 2,400% compared to status quo). This option should strictly be avoided and it is therefore necessary to communicate proper handling of used items to both locals and NGO staff.
6 Conclusions
In this paper, we analyzed the carbon efficiency of selected humanitarian supply chains of main relief items by performing life cycle assessment and calculating the carbon footprint of three main relief items based on data from French Red Cross relief operations of 2010 and 2011. As could be shown in the analysis, transporta-tion is responsible for a majority of the emissions in the analyzed humanitarian supply chains. However, due to its central significance and high importance, it is unreasonable and impossible to “cut” transportation as speed within the supply chain is most vital to save lives. Nevertheless, we found that a well-organized network is capable of reducing the impact on the environment as well as the risk of man-made amplification of future catastrophes. Particularly, pre-positioning items at strategic locations proofed to be a key element in saving CO2 emissions in our analysis as these pro-active supply chains reduce the enormous emissions from air transportation. Consequently, from both an environmental and a strategic perspective a focus should be on efficient distribution of pre-positioned stock of relief items as this will save both time and emissions.
Besides, item production accounted for a large amount of emissions in our analy-sis. Here, innovative methods and new technology to improve environmental per-formance of manufacturers and suppliers can improve the carbon efficiency of supply chains. Humanitarian aid operations should use their “buyer power” to en-courage better environmental management on manufacturers or include environ-mental requirements in tender offers. Another option could lie in the acquisition of certain international certification (e.g. ISO/EMAS) as a prerequisite for being able to participate in Red Cross tender offers.
Finally, we demonstrated how alternative disposal scenarios reduce carbon emis-sions and support the sustainable redevelopment of the affected regions in the long run. Although having relatively little impact – compared to transportation and warehousing – improving waste management needs to be an area of focus by relief organizations. Firstly, there is a general lack of action in terms of waste manage-ment, and therefore there is high potential for improvement. Moreover, improving
item disposal influences affected areas positively and directly without negatively influencing speed or effectiveness of supply chains and can directly be performed by relief organizations. The following strategies need to be evaluated: Investment in (portable) facilities as well as the construction of recycling facilities at the re-spective locations should be considered from an economic perre-spective as it cer-tainly pays off in the long run. Besides, a focus should be on the coordination of logistic flows to enable back-hauling used items to countries with adequate recy-cling facilities for. Here, empty miles from unbalanced transportation routes could be used. Incineration should be avoided from a GHG perspective.
However, financing any environmental initiative will remain a main challenge for improving the carbon efficiency of humanitarian supply chains. Donors (mostly governments) demand direct results of operations (e.g. number of people reached by healthcare programs or hygiene promotion activities, number of households provided with shelter, number of established water and sanitation facilities). Initia-tives to reduce emissions, however, have (only) indirect impacts which are hard to calculate. Nevertheless, they are capable of reducing the carbon footprint of sup-ply chains both globally and locally in affected areas in particular, and therefore prevent the amplification of natural catastrophes and support a sustainable rede-velopment of damaged areas. In a first step, this paper therefore aims at raising awareness, communicating environmental consequences and providing education for various players: On the one hand, the results provide support for decision mak-ers who coordinate logistic flows in humanitarian aid operations. On the other hand, we point out that awareness for environmental aspects of humanitarian aid operations should be raised and that education is needed. This should focus on (1) locals by educating them on how to minimize negative environmental impact and how to handle used items correctly to support a sustainable reconstruction of “their” environment (e.g. collecting and avoiding of incineration for specific items), (2) relief agencies who can reduce emissions of various (logistics) proc-esses through strategic planning (e.g. pre-positioned stock) in tandem with in-creasing speed and efficiency of supply chains and (3) donors (mainly govern-ments) who provide funds and, so far, have regarded ecological sustainability as a minor aspect of humanitarian aid due to a lack of direct results.
Although effort was put on high quality and reliability of calculations and re-search, some research limitations have to be acknowledged. Due to the limited numbers of cases and data from one organization (French Red Cross), the research might lack external validity. Moreover, we only focused on three specific (main) relief items with long life-cycles, so results for other items – particularly for items which need special treatment such as cooling or have shorter life-cycles (e.g. medical goods or nutrition) – may deviate. This could be analyzed and compared in further research. Due to missing information some assumptions for the LCA calculation had to be made. Drayage on the road for transportation processes from manufacturers to warehouses or between various warehouses were not taken into
consideration – this aspect was only considered for last mile transportation at the response area. Missing information on energy mixes for some countries (e.g. Gua-deloupe) was adapted. Finally, emission factors used were generally based on de-fault data (Ecoinvent) which can of course cause deviation. Nevertheless, the data reflects the general behavior of the Red Cross in minor and major operations and can therefore be seen as a representative sample.
Acknowledgments
The authors thank Mr. Mathieu Grenade from the French Red Cross who provided detailed insights into relief operation and supply chain data, gave valuable feed-back and contributed constructive ideas during the development of the LCA calcu-lation tool and period of analysis.
References
Carbon Trust (2012) Carbon Trust, 2012: Carbon footprinting. An introduction
for organizations. http://www.carbontrust.co.uk/.
Cotrill (2002) Cottrill, K., 2002: Preparing for the worst. Traffic World, 266(40),
15.
Curran (1996) Curran, M. A., 1996: Environmental Life Cycle Assessment.
McGraw Hill, New York.
Dubois and Araujo (2007) Dubois, A., and Araujo, L., 2007: Case research in
purchasing and supply management: Opportunities and challenges.
Journal of Purchasing and Supply Management 13, 170–181.
Ecoinvent (2013) Ecoinvent, 2013: About us. http://www.ecoinvent.ch/
European Environmental Agency (1997) European Environmental Agency,
1997: Life-cycle assessment (LCA) – a guide to approaches, experiences and information sources. Environmental Issues Series, 6,Copenhagen.
IFRC (2013a) IFRC, 2013a: Emergency Response Units (ERUs): Types. 2013,
http://www.ifrc.org/en/what-we-do/disaster- management/responding/disaster-response-system/dr-tools-and-systems/eru/types-of-eru/
IFRC (2013b) IFRC, 2013b: Procurement Catalogue. 2013, http://procurement.ifrc.org/catalogue/.
Kovács and Spens (2007) Kovács, G., and Spens, K. M., 2007: Humanitarian
logistics in disaster relief operations. Journal of Physical Distribution &
Logistics Management, 37(2), 99-114.
Kovács and Spens (2011) Kovács, G., and Spens, K. M., 2011: Trends and
developments in humanitarian logistics - a gap analysis. International
Lee and Zbinden (2003) Lee, H. W., and Zbinden, M., 2003: Marrying logistics
and technology for effective relief. Forced Migration Review, 18, 34-35.
Long and Wood (1995) Long, D. C., and Wood, D. F., 1995: The logistics of
famine relief. Journal of Business Logistics, 16(1), 213-229.
Pedraza-Martinez and Van Wassenhove (2012) Pedraza-Martinez, A. J., and
Van Wassenhove, L. N., 2012: Transportation and vehicle fleet management in humanitarian logistics: challenges for future research.
European Journal of Transport Logistics, 1, 185–196.
PRé (2013) PRé, 2013: Simapro Software.
www.pre-sustainability.com/simapro-lca-software.
Society of Environmental Toxicology and Chemistry (SETAC) (1990) Society
of Environmental Toxicology and Chemistry (SETAC), 1990: A technical framework for life-cycle assessments, Workshop Report, Vermont, Smugglers Notch.
Thomas (2003) Thomas, A., 2003: Why logistics? Forced Migration Review, 18,
4.
Thomas and Kopczak (2005) Thomas, A. S., and Kopczak, L., 2005: From
Logistics to Supply Chain Management: The path forward in the humanitarian sector.San Fransisco.
Tomasini and Van Wassenhove (2009) Tomasini, R., and Van Wassenhove, L.,
2009: Humanitarian Logistics. Palgrave Macmillan, Hampshire.
DEFRA (2012) U.K. Department for Environment, F. a. R. A., 2012: Guidelines
to Defra / DECC's GHG Conversion Factors for Company Reporting. http://www.defra.gov.uk/publications/files/pb13773-ghg-conversion-factors-2012.pdf
U.S. Energy Information Administration (EIA) (2003) U.S. Energy
Information Administration (EIA), 2003: End-Use Consumption Tables for Non-Mall Buildings.
U.S. Environmental Protection Agency (2013) U.S. Environmental Protection
Agency, 2013: Greenhouse Gas Equivalencies Calculator. http://www.epa.gov/cleanenergy/energy-resources/calculator.html.
Wiedmann and Minx (2008) Wiedmann, T., and Minx, J., 2008: A Definition of
'Carbon Footprint'. In C. C. Pertsova (Ed.), Ecological Economics Research Trends. Nova Science Publishers. Hauppauge NY, USA. 1-11.
WRI (2012) WRI, 2012: Greenhouse Gas Protocol – Emission factors from
Cross-Sector Tools. http://www.ghgprotocol.org/calculation-tools/all-tools.