Publisher’s version / Version de l'éditeur:
Vous avez des questions? Nous pouvons vous aider. Pour communiquer directement avec un auteur, consultez la première page de la revue dans laquelle son article a été publié afin de trouver ses coordonnées. Si vous n’arrivez pas à les repérer, communiquez avec nous à [email protected].
Questions? Contact the NRC Publications Archive team at
[email protected]. If you wish to email the authors directly, please see the first page of the publication for their contact information.
https://publications-cnrc.canada.ca/fra/droits
L’accès à ce site Web et l’utilisation de son contenu sont assujettis aux conditions présentées dans le site LISEZ CES CONDITIONS ATTENTIVEMENT AVANT D’UTILISER CE SITE WEB.
Proceedings of the Joint NSC-NRC Workshop on Construction Technologies: 26
April 2004, Taipei, Taiwan, pp. 147-156, 2004-04-01
READ THESE TERMS AND CONDITIONS CAREFULLY BEFORE USING THIS WEBSITE. https://nrc-publications.canada.ca/eng/copyright
NRC Publications Archive Record / Notice des Archives des publications du CNRC :
https://nrc-publications.canada.ca/eng/view/object/?id=1d400d45-9fa5-4a86-a2c1-6019b47db46c https://publications-cnrc.canada.ca/fra/voir/objet/?id=1d400d45-9fa5-4a86-a2c1-6019b47db46c
NRC Publications Archive
Archives des publications du CNRC
This publication could be one of several versions: author’s original, accepted manuscript or the publisher’s version. / La version de cette publication peut être l’une des suivantes : la version prépublication de l’auteur, la version acceptée du manuscrit ou la version de l’éditeur.
Access and use of this website and the material on it are subject to the Terms and Conditions set forth at
Properties of vacuum insulation panels: results from experimental
investigations at NRC Canada
Kumaran, M. K.; Mukhopadhyaya, P.; Lackey, J. C.; Normandin, N.; van
Reenen, D.
Properties of vacuum insulation panels: results from experimental
investigations at NRC Canada
Kumaran, M.K.; Mukhopadhyaya, P.;
Lackey, J.C.; Normandin, N.; Van Reenen, D.
NRCC-47055
A version of this document is published in / Une version de ce document se trouve dans :
Proceedings of the Joint NSC-NRC Workshop on Construction
Technologies, Taipei, Taiwan, April 26-27, 2004, pp. 147-156
PROPERTIES OF VACUUM INSULATION PANELS: RESULTS FROM
EXPERIMENTAL INVESTIGATIONS AT NRC CANADA
M Kumar KUMARAN1, Phalguni MUKHOPADHYAYA2, John C. LACKEY3, Nicole NORMANDIN3 and David
VAN REENEN3
ABSTRACT
Many samples of commercially available vacuum insulation panels were tested in the laboratory to determine their physical properties such as thermal resistance, water vapour permeance of the foils and sorption characteristics of the core material. The effect of various exposure conditions, which includes 32 ºC, relative humidity up to 90 % and 5 bar over-pressure, on the thermal resistance was determined. Also, the edge effects when panels were put side by side were evaluated. The performance of the sealing foils and seams in the manufactured products was checked in terms of water vapour permeance and air permeance.
The tested products seem to withstand major environmental loads. High humidity, higher temperature and even higher pressure have not significantly changed their thermal resistances in two years. Air permeance across the foils is immeasurably low. Water vapour does permeate, albeit at a very low rate (1 to 3 ng m-2 s-1 Pa-1), across the foils and seams. However, precipitated silica as a core material has appreciable capacity to adsorb and store water molecules.
Though the central portions of the panels show remarkable thermal resistances, the edge effect for the same reason is significant. The joining point of the four corners of four high performance panels is only as efficient as a high performance cellular plastic insulation.
Keywords: Vacuum insulation, High-performance thermal insulation, Long-term performance
INTRODUCTION
The projected primary energy demand for Canada in 2020 is 1.4 X10¹⁹ J. Out of that 1.0 X10¹⁹ J is to meet the end-use demand. About 35 % of the end-end-use demand is for Residential/Agricultural/ Commercial/Government sector. In today’s dollar value, this 35 % is approximately $35 Billion! It is here that the high performance thermal insulation materials and products can make a difference.
Since the oil crisis of the seventies, thermal insulation in building envelopes became the key element to reduce heat losses and to improve energy efficiency of built environment. Canada was in the forefront of this technology. But there is room for considerable improvement. Energy specialists in Europe calculated that the optimum thickness of contemporary insulation materials in buildings should be 50 cm. But the higher thickness of insulation in buildings cannot be achieved in terms of sustainability. It will only deteriorate the situation. The solution is to develop high performance thermal insulation materials and develop practical building applications for such materials. Micro-and
1
Principal Research Officer & Group Leader, Institute for Research in Construction, National Research Council Canada, e-mail: [email protected]
2 Research Officer, Institute for Research in Construction, National Research Council Canada, e-mail:
3
Technical Officer, Institute for Research in Construction, National Research Council Canada, e-mail: [email protected], [email protected], [email protected]
nano- porous materials, vacuum technology and special gas filled porous structures are all viable solutions. With the development of insulation materials that are ten times more efficient than contemporary products, the thickness of building envelopes can be even reduced from the current level. That means less consumption of wood and wood based materials and fewer materials to recycle at the end of the service life. Furthermore, as Canada’s commitment to uphold Kyoto Agreement has to be met, any innovation that reduces CO2 generation needs attention. High performance insulation materials will go a long way in reducing energy consumption and hence CO2 generation. Researchers at IRC have been working with several European partners on a project on new generation of insulation materials for building applications. The information from the project is expected to form the basis for the development such products and application procedures in Canada in a near future. Several Canadian industrial partners were financially supporting IRC’s effort to gather the existing information through the collaborative project with the Europeans. The project is undertaken as an International Energy Agency Annex (Annex 39).
The partners of the Annex decided to investigate vacuum insulation panels (VIP) as the primary high performance thermal insulation product. IRC’s role was to determine the characteristics of the products that are currently available.
WHAT MAKES A VACCUM INSULATION PANEL?
A vacuum insulation panel essentially is composed of two components: a micro to nano porous material called the “core” evacuated and sealed using a thin membrane called the “foil”. This is schematically shown in Figure 1.
CORE FOIL
Figure 1. A Schematic Representation of a Vacuum Insulation Panel.
The initial thermal conductivity of a VIP depends on the pore dimensions of the core and the level of the vacuum retained within the sealed panel. This is illustrated in Figure 2, based on a set of data published by a manufacturer of VIPs. 0 0.005 0.01 0.015 0.02 0.025 0.03 0.035 0.04 1 10 100 1000 10000 100000 PRESSURE, Pa THERMAL CONDUCTIVITY, W m -1 K -1
OPEN-CELL POLYSTYRENE OPEN-CELL POLYURETHANE PRECIPITATED SILICA NANOGEL
Just for comparison, the thermal conductivity of low-density fibrous insulation or open porous foam is approximately 0.04 W m-1 K-1. From Figure 2 it can be seen that all four core materials can offer very high thermal resistance (very low thermal conductivity) if the vacuum is maintained at 10 Pa. The nanogel product maintains very low thermal conductivity even at 10 kPa. This is because it is mainly nano porous or the pore sizes are predominantly in the nano meter range. The open-cell polyurethane system, being predominantly micro porous the efficiency of the VIP is lost at less than 100 Pa vacuum levels. The precipitated silica and the open-cell polystyrene obviously have pore sizes between micro and nano meter.
Air molecules and water molecules can permeate through the foil and the seams, thus increasing the pressure within the panel. The long-term thermal resistance of VIPs will then depend on the efficiency of the foil and its seams that seal the vacuum to retard the permeation of air and water vapour. Any application of the panels shall not alter the efficiency of the foil and the seam. Even one pinhole in the foil or the seam destroys the vacuum and the high performance of the VIPs. This is a challenge in building applications.
TEST PROGRAM AT IRC
Twelve 30 cm X 30 cm X 30 mm VIPs were obtained from a manufacturer that has been recommended by the Annex participants. The initial thermal resistances of the panels were determined according to ASTM Standard C 518. Different number of panels was subjected to different environmental loads, as recommended by the Annex participants, and after regular intervals the thermal resistances were repeatedly determined. This was continued for more than a year. The exposures during that time included fixed periods of
Exposure to standard laboratory conditions
Exposure to laboratory temperature but high (about 90 %) RH Exposure to 32 ºC and 90 % RH
Exposure to 5 bar over pressure and Exposure to 3 bar over pressure
The core material and foil were separated from one VIP specimen. The sorption curve for the core specimen was determined according to ASTM Standard C 1498. The water vapour permeance of the foil was determined according to ASTM Standard E 96.
At the recommendation of the Annex participants, two types of unused foil bags with seams on three sides (these are the bags that are eventually used to produce the VIP) were acquired. The water vapour permeability was determined according to ASTM Standard E 96 of the foils with and without the seams.
The results from the test program are reported below.
Preliminary Tests to Confirm the Applicability of ASTM Standard C 518
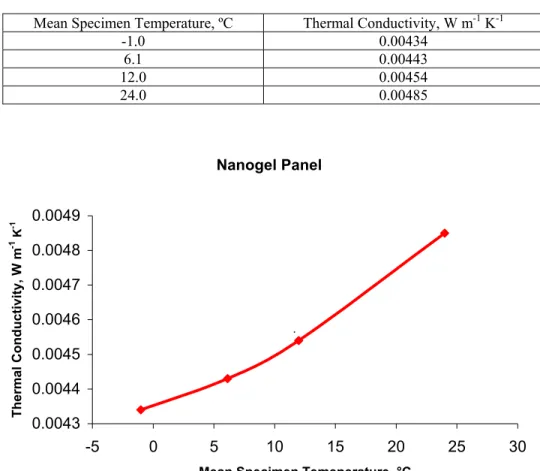
The ASTM Standard C518 uses Heat Flow Meter (HFM) Apparatus to determine heat transmission characteristics of traditional thermal insulation materials where the measured thermal conductivity is typically between 0.016 and 0.055 W m-1 K-1. As seen earlier, the thermal conductivity of a VIP can be as low as 0.004 W m-1 K-1. One had to test whether the HFM Apparatus could be used to measure the thermal conductivity and changes in thermal conductivity of VIPs. To accomplish this, a fresh test specimen of a VIP with a label claiming a thermal conductivity of 0.004 W m-1 K-1 from its manufacture was chosen. The thermal conductivity of the panel at four different mean temperatures was determined according to ASTM Standard C518. The results in Table 1 and plotted in Figure 3 confirmed that the ASTM Standard could be used in this investigation. Rather than depending on the absolute value, the incremental change in the thermal conductivity with temperature was used to come this conclusion.
Initial Thermal Resistivities of Twelve VIPs
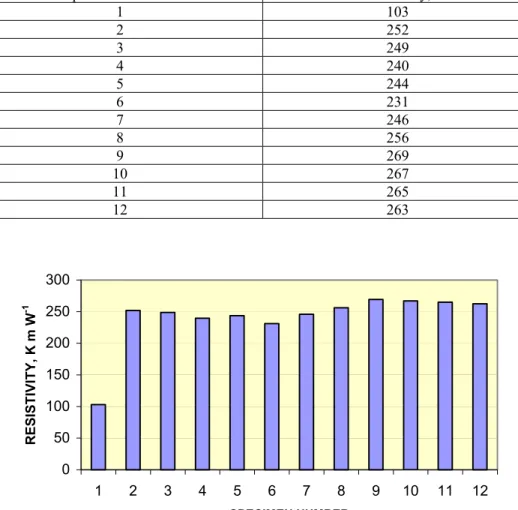
The initial thermal resistivities (Standard C518 conditions) of the twelve test specimens, as tested within two weeks of arrival at IRC laboratory are listed in Table 2 and are plotted in Figure 4.
Table 1. The Thermal Conductivity of a VIP at Four Mean Temperatures.
Mean Specimen Temperature, ºC Thermal Conductivity, W m-1 K-1
-1.0 0.00434 6.1 0.00443 12.0 0.00454 24.0 0.00485 Nanogel Panel 0.0043 0.0044 0.0045 0.0046 0.0047 0.0048 0.0049 -5 0 5 10 15 20 25 30
Mean Specimen Temeperature, °C
Thermal Conductivity, W m
-1
K
-1
.
Figure 3. The Thermal Conductivity of A VIP At Several Mean Specimen Temperatures, According To ASTM Standard C 518.
___________________________________________
Note:
All subsequent data obtained from C 518 will be expressed as thermal resistivities (reciprocal of thermal conductivities) since we are more interested in the loss of thermal performance with time. For reference, the thermal resistivity of a typical low-density fibrous or open-cell foam insulation will be approximately 25 K m W-1 and that of a freshly made high performance cellular plastic insulation will be approximately 55 K m W-1.
Initial Thermal Resistivities of Twelve VIPs
The initial thermal resistivities (Standard C518 conditions) of the twelve test specimens, as tested within two weeks of arrival at IRC laboratory are listed in Table 2 and are plotted in Figure 4.
Eleven of the twelve VIPs tested had the expected high thermal resistivity. The remaining one had approximately half the thermal resistivity of the others. That was an indication of some defects. Visually nothing was apparent.
Table 2. Initial Thermal Resistivities of Twelve VIPs.
Specimen Number Thermal Resistivity, K m W-1
1 103 2 252 3 249 4 240 5 244 6 231 7 246 8 256 9 269 10 267 11 265 12 263 0 50 100 150 200 250 300 1 2 3 4 5 6 7 8 9 10 11 12 SPECIMEN NUMBER RESISTIVITY, K m W -1
Figure 4.Initial Thermal Resistivities of TwelveVIPS; Specimen 1 Apparently Arrived With A Defect, But None Was Visible.
Laboratory Ageing of Specimens 9 and 10
Specimens 9 and 10 were aged in the laboratory, under standard laboratory conditions, (21 ± 1) ºC and approximately 50 % RH. The results are listed in Table 3.
Table 3. Ageing of Two Specimens in the Laboratory; Numbers in Parenthesis Indicate the Time in Days.
Specimen Thermal Resistivity, K m W-1
9 269 (0) 253 (43) 253 (98) 248 (195) 250 (254) 251 (373)
10 267 (0) 251 (42) 250 (97) 247 (194) 248 (252) 248 (372)
Initially there was a measurable (about 6 %) drop in the resistivity of both specimens, but after that the changes were negligible for nearly one year. Within the limits of the precision of the heat flow meter apparatus the resistivity remained the same.
Ageing of Specimen 4 Partially at 90 % Relative Humidity
Specimen 4 was aged in a way similar to specimens 9 and 10, except that between 90 days and 190 days, the specimen was exposed to 90 % RH at 23 ºC for 60 days. The results are listed in Table 4.
Table 4. Ageing of One Specimen in the Laboratory; Numbers in Parenthesis Indicate the Time in Days.
Specimen Thermal Resistivity, K m W-1
4 240 (0) 227 (53) 226 (90) 222 (189) 223 (264) 221 (377)
Comparison of the data in Table 3 to those in Table 4 suggests that the 60-day exposure to high RH has not affected the ageing pattern of the test specimen in any noticeable way.
Ageing of Specimens 6 and 12 partially at 32 ºC and 90 % Relative Humidity
Specimens 6 and 12 were aged similar to specimens 9 and 10 except that between 255 and 290 days they were exposed to 32 ºC and 90 % RH for 30 days. The results on these specimens are listed in Table 5.
Table 5. Ageing of Two Specimens in the Laboratory; Numbers in Parenthesis Indicate the Time in Days.
Specimen Thermal Resistivity, K m W-1
6 231 (0) 218 (55) 215 (92) 214 (255) 212 (292) 210 (377)
12 263 (0) 243 (44) 243 (95) 243 (246) 240 (294) 240 (372)
Comparison of the data in Tables 3 and 5 reveal that the higher temperature and higher RH together also have no noticeable effect on the pattern of ageing of the specimens.
Ageing of Specimens 3 and 8 partially at 90 % Relative Humidity and then partially 32 ºC and 90 % Relative Humidity
Specimens 3 and 8 were exposed to 90 % RH at laboratory conditions, initially at 30 days followed by another 30 days. Then after about 250 days they were exposed to 32 ºC and 90 % RH for 30 days. The changes in the thermal resistivity of these specimens are listed in Table 6.
Table 6. Ageing of Two Specimens in the Laboratory; Numbers in Parenthesis Indicate the Time in Days.
Specimen Thermal Resistivity, K m W-1
3 249 (0) 235 (30) 231 (60) 225 (259) 221 (290) 220 (377)
8 256 (0) 240 (30) 240 (60) 237 (252) 235 (290) 235 (373)
Comparison of the data in Table 6 with those in Tables 4 and 5 even 90 days of exposure during 1 year to high humidity and out of that 30 days at higher temperature than laboratory temperature has not affected the overall ageing of the specimens.
Ageing of Specimens 2, 5, 7 and 11 at Over-pressures 5 bar and 3 bar
Initially for about 250 days specimens 2, 5 and 11 were aged, like specimens 9 and 10 and specimen 7 was aged identical to specimens 3 and 8. But then they were stacked in a pressure chamber and kept at an over-pressure of 5 bar for 30 days, tested for their resistivity and then subjected to an over-pressure of 3 bar for 15 days. The exposure to 5 bar shrunk all specimens by approximately 6 % in all dimensions. But the vacuum was apparently unchanged as indicated by visual inspection. A further exposure to 3 bar over-pressure for 15 days did not alter the physical appearances of the four specimens. The shrinkage affected the resistivity significantly, as shown in Table 7. However there was no significant change in the resistivity due to the second exposure to 3 bar over-pressure. When the specimens were retested after nearly 480 to 490 days of total ageing, the results as shown in Table 7 indicated that the vacuum remained in tact. So the shrinkage probably only collapsed the pore structure, that too partially and more
solid particles came together. This may be the reason for the substantial decrease in the resistivity after the exposure to the 5 bar over-pressure.
Table 7. Ageing of Four Specimens in the Laboratory for About 250 Days Followed by 30 Days Over-Pressure at 5 bar and Then 15 Days Over-Pressure at 3 bar; Numbers in Parenthesis Indicate Total Ageing Time in
Days.
Specimen Thermal Resistivity, K m W-1
2 252 (0) 232 (90) 231 (254) 125 (292) 125 (307) 124 (490)
5 244 (0) 228 (90) 224(252) 139 (289) 136 (304) 138 (486)
7 246 (0) 231 (60) 230 (249) 116 (286) 114 (301) 117 (483)
11 265 (0) 250 (97) 248 (243) 128 (281) 127 (296) 129 (479)
The Defective Specimen 1
Within the first 60 days the defective specimen lost its vacuum altogether and the resistivity was reduced to 54.0 K m W-1. This is still higher than the resistivity of any common insulation and matches that of the best cellular plastic insulation. This resistivity is entirely due to the nano porous structure of the core material.
At this stage the VIP was slit opened and the foil and the core were separated. From the foil, six circular specimens, approximately 15 cm in diameter, were prepared for dry cup measurements according to ASTM Standard E 96 and air permeance measurements according to a procedure developed at the Institute4. Two sets of chamber RH conditions were used for the dry cup measurements, namely 90 % RH and 95 % RH. Measurements were conducted in triplicate at each test condition.
The core was cut into many 35 mm X 35 mm X 30 mm pieces for conducting sorption and desorption measurements, according to ASTM Standard C1498. The dry mass of each test specimen was determined by drying to constant mass at 105 ºC. At each test condition, measurements were done in triplicate. Sorption was done at 11.3 %, 22.7 %, 50.1 %, 71.0 %, 88.0 % and 94.9 % RH. Desorption measurements were done at 50.1 %, 70.5 %, 89.5 % and 94.8%. The RH measurements are better than 1 % accurate as traceable to a chilled-mirror standard. For the desorption measurements, the specimens were conditioned at very close to the saturation vapour pressure for 24 h and it was noticed that all conditioned specimens shrunk by as much as 1/3 of their original volume.
Water Vapour Permeances of the Foil
The results from the dry cup measurements are listed in Table 8. It can be seen that the foil is very resistant to vapour diffusion. 1 ng m-2 s-1 Pa-1 is about 1/60 of a Perm.
The foil of the VIP specimens 1 to 6 were shiny and called metalized and that of specimens 7 to 12 were dull and called metallic.
Table 8. Water Vapour Permeance (WVP) of the Metalized Foil Using Cup Method.
RH in the cup, % RH in the chamber, % Temperature, ºC WVP, ng m-2 s-1 Pa-1
0 89.3 ± 0.5 22.3 ± 0.1 1.24 0 89.3 ± 0.5 22.3 ± 0.1 0.91 0 89.3 ± 0.5 22.3 ± 0.1 0.94 0 94.7 ± 0.5 22.4 ± 0.1 1.34 0 94.7 ± 0.5 22.4 ± 0.1 1.08 0 94.7 ± 0.5 22.4 ± 0.1 1.29
4
Bomberg, M. T. and Kumaran, M.K., " A Test method to determine air flow resistance of exterior membranes and sheathings," Journal of Thermal Insulation, Vol.9, pp. 224-235,1986.
Sorption and Desorption Characteristics of the Core
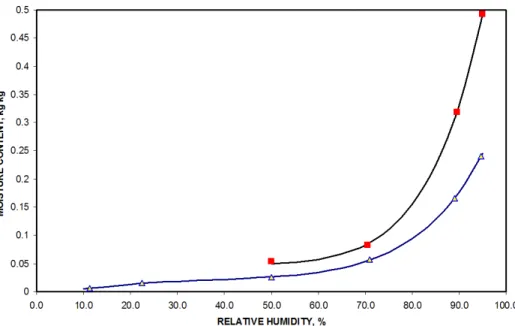
The core that has been since identified as a nano porous system that includes precipitated silica, micro-fibers and an opacifier is dusty and gray in colour. The specimens appeared to be layered parallel to the major surface of the VIP. The results from the sorption measurements are listed in Table 9 and those from the desorption measurements are listed in Table 10. Both sets of data are plotted in Figure 5.
Table 9. Equilibrium Moisture Content* (EMC) at 22.5 ± 0.5 ºC from the Sorption Measurements on the Core. RH, % EMC, kg kg-1 RH, % EMC, kg kg-1 11.3 0.0065 71.0 0.056 11.3 0.0068 71.0 0.056 11.3 0.0058 71.0 0.056 22.7 0.015 88.0 0.153 22.7 0.015 88.0 0.153 22.7 0.014 88.0 0.155 50.1 0.027 94.9 0.218 50.1 0.027 94.9 0.205 50.1 0.025 94.9 0.199
Table 10. Equilibrium Moisture Content* (EMC) at 22.5 ± 0.5 ºC from the Desorption Measurements on the Core. RH, % EMC, kg kg-1 RH, % EMC, kg kg-1 50.1 0.054 89.5 0.311 50.1 0.050 89.5 0.303 50.1 0.053 89.5 0.312 70.5 0.083 94.8* 0.492 70.5 0.082 70.5 0.084
*The fluctuations in the chamber during the measurement were large and only an average value of many measurements on all three specimens is given as an approximation.
Figure 5. The Hysteresis Shown By The Core of VIP Specimen 1; The Points Are Averages At Each Test Condition. The Lower Curve Is For The Sorption And The Upper For The Desorption.
Tables 9 and 10 and Figure 5 reveals the hygroscopic nature of the core. At the initial stage of adsorption, any water molecule that enters the VIP has a strong chance to get adsorbed by the core and to negate any potential increase in the total pressure.
Air Permeance of the Foil
The foil test specimens, even at an over pressure of 100 kPa, yielded no measurable air flow rates. An attempt to follow pressure decay within the test chambers showed no decay for many hours. Both these prove that the foils are highly resistant to the diffusion of air molecules. The permeance is infinitesimally small and immeasurable by conventional methods.
Heat Flow and Edge effects
Test specimens 5, 6, 11 and 12, during the first two months of the test program, were put side by side and the edges were brought together as close as possible, to make one 60 cm X 60 cm test assembly of four VIPs. The resulting assembly was tested in a 60 cm X 60 cm heat flow meter apparatus that conformed to ASTM Standard C 518. The point at which four corners of the individual test specimens met lay at the center of the metering area in the apparatus. The effective resistivity of the assembly was only 53 K m W-1, in comparison with 220 K m W-1 or higher resistivity shown by individual VIP. It is obvious from this measurement that locations at which the edges meet in an application of VIPs will correspond to appreciable thermal bridges. This will remain a challenge in building applications of VIPs.
Vapour Permeances of Foils with and without Seams
Two types of foil bags that are used for VIP manufacture were selected for these tests. One type was identified as a single layer metalized foil and the other a three layer metalized foil. The bags already had seams on three edges. From each type, six circular test specimens were prepared for vapour permeance tests according to ASTM Standard E 96. Three of the six had the seams in tact at the center of the test specimens. Dry cup measurements were done on all twelve test specimens at two different chamber conditions, approximately 90 % and 94 % RH. The results from these measurements are listed in Tables 11 to 14. The results show that the seams do not provide any easier path for vapor diffusion in comparison with the foils themselves. Also, as one would expect, the three layers metalized foil
offers measurably higher resistance towards vapour diffusion than that offered by the single layer metalized foil. But all values in the Tables are about 1 to 3 ng m-2 s-1 Pa-1.
Table 11. Water Vapour Permeance (WVP) of the Single Layer Metalized Foil.
RH in the cup, % RH in the chamber, % Temperature, ºC WVP, ng m-2 s-1 Pa-1
0 89.8 ± 0.5 22.6 ± 0.1 3.26 0 89.8 ± 0.5 22.6 ± 0.1 2.79 0 89.8 ± 0.5 22.6 ± 0.1 2.84 0 89.3 ± 0.5 22.2 ± 0.1 2.28 0 89.3 ± 0.5 22.2 ± 0.1 2.64 0 89.3 ± 0.5 22.2 ± 0.1 2.47
Table 12. Water Vapour Permeance (WVP) of the Single Layer Metalized Foil with the Seam at the Center of the Test Specimen.
RH in the cup, % RH in the chamber, % Temperature, ºC WVP, ng m-2 s-1 Pa-1
0 89.8 ± 0.5 22.6 ± 0.1 3.32 0 89.8 ± 0.5 22.6 ± 0.1 3.04 0 89.8 ± 0.5 22.6 ± 0.1 3.98 0 89.3 ± 0.5 22.2 ± 0.1 2.72 0 89.3 ± 0.5 22.2 ± 0.1 2.75 0 89.3 ± 0.5 22.2 ± 0.1 3.22
Table 13. Water Vapour Permeance (WVP) of the Three Layers Metalized Foil.
RH in the cup, % RH in the chamber, % Temperature, ºC WVP, ng m-2 s-1 Pa-1
0 89.8 ± 0.5 22.6 ± 0.1 0.90 0 89.8 ± 0.5 22.6 ± 0.1 1.02 0 89.8 ± 0.5 22.6 ± 0.1 0.89 0 89.3 ± 0.5 22.2 ± 0.1 0.76 0 89.3 ± 0.5 22.2 ± 0.1 0.66 0 89.3 ± 0.5 22.2 ± 0.1 0.73
Table 14. Water Vapour Permeance (WVP) of the Three Layers Metalized Foil with the Seam at the Center of the Test Specimen.
RH in the cup, % RH in the chamber, % Temperature, ºC WVP, ng m-2 s-1 Pa-1
0 89.8 ± 0.5 22.6 ± 0.1 1.30 0 89.8 ± 0.5 22.6 ± 0.1 1.54 0 89.8 ± 0.5 22.6 ± 0.1 0.96 0 89.3 ± 0.5 22.2 ± 0.1 1.18 0 89.3 ± 0.5 22.2 ± 0.1 1.39 0 89.3 ± 0.5 22.2 ± 0.1 0.84 GENERAL CONCLUSIONS
Based on the information available to date from the investigations at the Institute, the following conclusions are made:
• Environmental loads such as high relative humidity and higher than normal indoor temperatures have no measurable influence on the ageing pattern of the VIPs.
• • • • • •
Over-pressure may compact the VIP but do not accelerate the aging by air intrusion. Thus the foil and seams appear to be very resistant towards the diffusion of air molecules.
Foils and seams do admit water vapour diffusion across them. The rate of diffusion is relatively small. Multi-layers of metalized films make the rate of diffusion even smaller.
Precipitated silica has large affinity towards water molecules. Therefore at the initial stages of water vapour diffusion majority of the water molecules that traverse the foils and seams will be adsorbed by the core material and thus will delay any increase in the net pressure inside the VIP.
The technology used to make the seams prevents additional vapour diffusion paths across the seams. The thermal bridges that the edges of VIPs can create are significant.
In future work, it may be necessary to measure the net pressure rather than the thermal resistivity to follow the very slow ageing pattern shown by the VIPs.
ACKNOWLEDGEMENT
A “Special Interest Group” financially supported the Institute’s participation in the Annex. The group includes: NRCan, Icynene , Enbridge Consumers Gas, Lexcor Industry Supply , Rideau Construction Inc., CMHC, BASF Canada and Plastifab.