Publisher’s version / Version de l'éditeur:
Solar Energy - Journal of the International Solar Energy Society, 76, 5, pp.
523-544, 2004-05-01
READ THESE TERMS AND CONDITIONS CAREFULLY BEFORE USING THIS WEBSITE.
https://nrc-publications.canada.ca/eng/copyright
Vous avez des questions? Nous pouvons vous aider. Pour communiquer directement avec un auteur, consultez la
première page de la revue dans laquelle son article a été publié afin de trouver ses coordonnées. Si vous n’arrivez pas à les repérer, communiquez avec nous à PublicationsArchive-ArchivesPublications@nrc-cnrc.gc.ca.
Questions? Contact the NRC Publications Archive team at
PublicationsArchive-ArchivesPublications@nrc-cnrc.gc.ca. If you wish to email the authors directly, please see the first page of the publication for their contact information.
NRC Publications Archive
Archives des publications du CNRC
This publication could be one of several versions: author’s original, accepted manuscript or the publisher’s version. / La version de cette publication peut être l’une des suivantes : la version prépublication de l’auteur, la version acceptée du manuscrit ou la version de l’éditeur.
For the publisher’s version, please access the DOI link below./ Pour consulter la version de l’éditeur, utilisez le lien DOI ci-dessous.
https://doi.org/10.1016/j.solener.2003.12.007
Access and use of this website and the material on it are subject to the Terms and Conditions set forth at
Impact of window blinds on daylight-linked dimming and automatic
on/off lighting controls
Galasiu, A. D.; Atif, M. R.; MacDonald, R. A.
https://publications-cnrc.canada.ca/fra/droits
L’accès à ce site Web et l’utilisation de son contenu sont assujettis aux conditions présentées dans le site LISEZ CES CONDITIONS ATTENTIVEMENT AVANT D’UTILISER CE SITE WEB.
NRC Publications Record / Notice d'Archives des publications de CNRC:
https://nrc-publications.canada.ca/eng/view/object/?id=32b8a46d-21b5-4ba4-bbc5-6f21086d11f3 https://publications-cnrc.canada.ca/fra/voir/objet/?id=32b8a46d-21b5-4ba4-bbc5-6f21086d11f3
Impact of window blinds on daylight-linked dimming and
automatic on/off lighting controls
Galasiu, A.D.; Atif, M.R.; MacDonald, R.A.
NRCC-46780
A version of this document is published in / Une version de ce document se trouve dans :
Solar Energy, v. 76, no. 5, May 2004, pp. 523-544
IMPACT OF WINDOW BLINDS ON DAYLIGHT-LINKED DIMMING AND
AUTOMATIC ON/OFF LIGHTING CONTROLS
Anca D. Galasiu*, Morad R. Atif and Robert A. MacDonald
Indoor Environment Research Program, Institute for Research in Construction National Research Council Canada
*corresponding author: Tel: +1 (613) 993-9670 Fax: +1 (613) 954-3733
E-mail: anca.galasiu@nrc-cnrc.gc.ca
Keywords: daylighting, photocontrolled lighting, photocontrolled blinds, window blinds, lighting consumption, lighting systems in office buildings.
ABSTRACT
This paper presents the field-measured performance of two commercial photocontrolled lighting systems, continuous dimming and automatic on/off, as a function of various configurations of manual and photocontrolled automatic venetian blinds. The performance indicators considered were the space illumination and the electric lighting consumption as a function of blind slat angle and retraction area. The results showed that under clear sky and without blinds both lighting control systems reduced the lighting energy consumption on average by 50 to 60% when compared to lights fully on from 6 AM to 6 PM. These savings, however, dropped by 5 to 45% for the dimming system, and by 5 to 80% for the automatic on/off system with the introduction of various static window blind configurations. The savings in lighting energy were more significant when the lighting control systems were used with photocontrolled blinds. This was due to the capability of the blinds to adjust their position automatically in direct response to the variable daylight levels.
1. INTRODUCTION
Research has shown that daylight-linked lighting control systems such as automatic on/off and continuous dimming have the potential to reduce the electrical energy consumption in office buildings by as much as 30 to 60% (Benton et al., 1991; Opdal and Brekke, 1995; Brekke and Hansen, 1997; Lee et al., 1999). However, research has also shown that in spite of few promising laboratory test results and computer predictions, most daylight-linked systems do not provide the anticipated energy savings when installed in real buildings (Bordass et al., 1994; Floyd and Parker, 1995; Love, 1995; Slater, 1995/96; Galasiu and Atif, 2003). Window shading devices, which are used by occupants for sun shading and glare control, have an impact on the energy performance of these systems. Research shows that occupants are very likely to change the position of the blinds when direct sunlight reaches their work area, but seldom change them for useful daylight admittance even after the unwanted conditions fade away (Rea, 1984; Lindsay and Littlefair, 1992). This means that blinds
tend to remain closed for long periods of time, which prevents the photocontrolled lighting systems from achieving maximum energy savings because the blinds reduce the amount of daylight available at the control photosensor. Photocontrolled blinds have been introduced to offset the limitations of manually-operated blinds. Theoretically, the benefit from the use of a photocontrolled blind system arises from the fact that blinds close automatically when the interior becomes too glary or too hot, and re-open later to admit useful daylight. Therefore, by adjusting their position in response to the exterior daylight levels, photocontrolled blinds are presumably able to protect the interior from glare and overheating when there is a need for it, and admit usable daylight soon after these conditions come to an end.
The aim of this study was to investigate the effect of various configurations of manual and automatic photocontrolled venetian blinds on the space daylight availability and the response of two types of commercial photocontrolled lighting systems. The specific objectives were:
• to evaluate the lighting energy savings from daylighting in real daylit office spaces equipped with either photocontrolled automatic on/off or continuous dimming lighting controls; and
• to evaluate the effect of manually-operated and photocontrolled venetian blinds on the performance of the two lighting control systems and their associated energy savings.
The performance indicators measured included the space illumination and the lighting energy consumption as a function of shading device type (manual or automatic blinds), and configuration (blind slat angle and retraction area).
2. TEST-SITE DESCRIPTION
The experimental site consisted of four adjacent private offices situated in Ottawa, Canada, at a latitude of 45.24°, longitude of 75.43°, and altitude of 125 m. Figures 1 and 2 show an exterior and an interior view of the south-facing office spaces, located in front of a small hill covered by green grass for about 8 months a year, and by clean snow during the remaining months. Each office had a floor area of 14 m2, a height of 3 m, and was occupied from 8 AM to 5 PM during weekdays by their regular occupants performing their usual daily tasks.
The fenestration system in each office consisted of six double glazed, low-E, “view” window panes and three double glazed, low-E, “clerestory” window panes placed high in the walls to allow for deep daylight penetration. The overall opening of each window pane was 90 x 60 cm. The “view” windows were clear and had a visible transmittance of 75%. The “clerestory” windows were gray-tinted and had a visible transmittance of 36%. Although this choice of glazing contradicts the general daylighting design concept of using high-transmittance glazing for the upper windows to increase the daylight contribution away from the windows, and low-transmittance glazing for the lower windows to decrease glare and brightness ratios, alterations to the original building fenestration system were not considered in this study.
On the exterior façade, the “view” windows were separated from the “clerestory” windows by a continuous and highly-reflective aluminum light-shelf. The daylight penetration into the offices was also increased by an interior, highly reflective, white-colored window mullion, 40 cm deep, which acted as an interior light-shelf. In each office the windows were fitted with four white-colored, manual aluminum venetian blinds with 2.5 cm wide slats.
Ambient lighting was provided in each office by two energy efficient recessed fluorescent lighting fixtures, each incorporating two, 32-watt, T8 fluorescent lamps. The average lighting power density in each office was about 9 W/m2, and the average space illuminance measured on the workplane at night under full electric lighting was 570 lux.
The walls and ceilings were painted off-white and had an estimated reflectance of 70%. The floor was covered with a light-brown carpet with an estimated reflectance of 30%. All four offices were furnished with similar brown-colored furniture, which had a different layout in each office to accommodate the occupants’ requirements.
2.1 Photocontrolled Electrical Lighting System
For the purpose of this experiment, the original lighting fixtures in two side-by-side offices were provided with a commercial photocontrolled dimming system. This system adjusted continuously the power flowing to the lamps based on a signal received from a ceiling photosensor located 60 cm from the upper window pane. The photosensor was designed to ensure an open-loop feedback to the lighting controller and according to the technical specifications, the ballast dimming range of the control system was between 100% to 1% illuminance level (100% to 8% power level). The system was calibrated to complement the available daylight and maintain a constant illuminance level on the workplane of 570 lux, the design illuminance at night under full electric lighting.
In the other two adjacent offices, the lighting fixtures were equipped with a commercial photocontrolled on/off system also operated based on a signal received from a ceiling photosensor located 60 cm away from the upper window pane. In these offices, however, the automatic on/off lighting system was calibrated to turn the lights off when the average illuminance from daylighting on the workplane exceeded 570 lux, and to turn the lights back on at full power when the illuminance dropped below this level. In order to prevent the lights from constantly changing between the on and off states in response to short, transient conditions (the “passing-cloud” effect), the control system incorporated a timer, which controlled the photosensor to remain within a given range for at least 2 minutes before selecting a new lighting scene.
With the above experimental set-up, lighting system calibration and benchmarking tests were conducted periodically under clear, partly cloudy and overcast sky to verify the similarity between the
electrical lighting systems of each pair of rooms and to determine the relative deviation resulting from instrumental error, the rooms’ relative position to the exterior environment, and the systems’ components and operation. During these tests all blinds were fully-retracted, simulating spaces in which a photocontrolled lighting system would provide the maximum lighting energy savings. Results of these tests showed that the offset in daily lighting energy consumption between each pair of rooms was about 5% under clear and partly cloudy sky, and less than 2% under overcast sky, regardless of season. This offset became part of the benchmarking in all the subsequent calculations.
2.2 Photocontrolled Shading System
To evaluate the impact of photocontrolled blinds on the performance of the two photocontrolled lighting systems, all four venetian blinds of one “on/off” office and of one “dimming” office were modified to incorporate motorized drives and photocontrolled command units, which were all components of a commercial automatic blind systems. These modifications prevented the blinds from being retractable and they covered the entire window during all the automatic blinds tests.
The motorized photocontrolled blind system was designed to operate similarly to an automatic photocontrolled lighting system. In each office, the system included:
• a light photosensor mounted on one of the bottom window panes and facing outdoors, which monitored the external daylight levels;
• a control unit, which gradually adjusted the angle of the blind slats in tiny increments in response to the changing light conditions; and
• motorized drives, which adjusted the blind slat tilt angle automatically based on the signal received from the control unit.
According to the level of sensitivity selected, the motorized blinds were expected to maintain a preset level of indoor illumination throughout the day and to close completely at night. During the day, the photocontrolled blinds system was built to operate with the following levels of sensitivity that could be selected from the control unit:
• always open (fixed position - blinds remained fully open regardless of changes in sunlight); • low sensitivity (very strong sunlight was required before blinds started to close);
• normal sensitivity (moderate sunlight started to close the blinds and strong sunlight closed them completely);
• high sensitivity (blinds started to close with diffuse sunlight and closed completely with moderate sunlight);
Only the “normal sensitivity” setting was included in this study. The automatic blind system and the lighting control systems worked independently of each other. Each system had its own control photosensor and routine algorithm and no attempt was made to integrate them.
3. METHODOLOGY
Each type of blind system (i.e. manual or photocontrolled), was monitored over two distinctive periods of the year to account for seasonal variations. A total of 10 static blind configuration tests were conducted for the manual venetian blinds. Each blind configuration was monitored for 5 to 10 days in order to encompass various sky conditions ranging from clear to overcast. The motorized automatic blinds were monitored separately for a total of four months, two in the winter and two in the summer.
During all the tests, one “on/off” office and one “dimming” office was used as a reference case (reference rooms) to which the performance of the “modified” offices (test rooms) having a similar type of electrical lighting control system was compared. The 10 tests involving the manual blinds were grouped in three categories as follows:
• All blinds tests, designed to identify the effect of six static blind configurations on the lighting
energy consumption. The comparison was done against the “no blinds” configuration in the reference room, while the following configurations were present in the test room:
– all four blinds with slats horizontal;
– all four blinds tilted 45˚ upward (exterior edge of the blind slats positioned upward, allowing a view of the sky from the interior);
– all four blinds tilted 45˚ downward (exterior edge of the blind slats positioned downward, allowing a view of the ground from the interior);
– top blinds fully retracted, bottom blinds 50% retracted;
– top blinds fully retracted, bottom blinds closed (blind slats squeezed downward to their mechanical limit);
– bottom blinds fully retracted, top blinds closed.
• Top blinds tests, designed to identify the impact of the top blinds on the performance of the
lighting control system when the bottom blinds are closed. These tests are applicable to situations when the “view” windows are covered by blinds for sun shading and glare control, and only the “clerestory” windows are used for daylight admission. During these tests, the bottom blinds in both the reference and the test rooms were closed, while the top blinds were either horizontal or tilted 45˚ downward in the test room, and fully retracted in the reference room.
• Bottom blinds tests, designed to identify the impact of the bottom blinds on the performance of
the lighting control system when the top blinds are closed. These tests are applicable to situations without “clerestory” windows, when daylight is admitted only through the “view” windows. During
these tests the top blinds in both the reference and the test rooms were closed, while the bottom blinds were either horizontal or tilted 45˚ downward in the test room, and fully retracted in the reference room.
The following parameters were measured in each room every minute and averaged at 10-minute intervals:
• Horizontal indoor illuminance, collected in each office at two test-points, one located next to
the ceiling photosensor operating the lighting control systems, and the second located on the desktop (0.85 m from the floor, and 2.75 m from the windows). The measured dimming percentage, and the correlation between the lighting power consumption and the resulting illuminance (as specified by the manufacturer of the lighting control system) were used to separate the total illuminance into daylight and electric light components. In the on/off offices, the available daylight illuminance was calculated by subtracting from the total measured illuminance, the illuminance measured at night under full electric lighting (570 lux).
• Electric lighting system power profile, collected at the breaker panel serving the lighting
circuits. The on/off state and the dimming percentage of the electrical lighting system were monitored independently for each office, and the daily lighting energy consumption was calculated for 12-hour intervals, from 6 AM to 6 PM.
• The angular position of the blinds (slat tilt angle), monitored for the “normal sensitivity” mode
of the photocontrolled blinds. In each office, all four blinds were synchronized to provide the same tilt angle measured from the horizontal plane. A reading of 10 Volt corresponded to a horizontal tilt angle. A reading lower than 1 Volt corresponded to the blinds being squeezed downward to their mechanical limit. Any reading between these two positions corresponded to a downward angle (a view of the ground from the interior).
The sky condition was also continuously recorded during the monitoring period and was characterized by the experimenters as either clear sky (less than 30% cloud cover), partly cloudy sky (between 30-70% cloud cover) and overcast sky (over 70% cloud cover).
4. RESULTS
4.1 CONTINUOUS DIMMING LIGHTING CONTROL SYSTEM 4.1.1 Performance of the Dimming Control System without Blinds
Data showed that regardless of season, on clear sky days and with the blinds fully retracted, the dimming system had the potential to save between 50 to 60% lighting energy over the 12-hour period considered (6 AM to 6 PM) compared to the electric lights being fully on during the same time
interval. The space illuminance (daylight + electric light) was also maintained reasonably well above 500 lux, the IESNA recommended illuminance for office lighting. However, data also showed that the lowest daily lighting energy consumption of the dimming system recorded in the “no blinds” configuration under a clear sky in March (Figure 13) occurred rather rarely, in less than 20% of all the clear sky days available throughout the one-year monitoring period. This suggests that even under “ideal” sky conditions, this desired level of performance was not evident or easily attainable. Usually, the average daily consumption of the dimming system on clear sky days was about 800 Wh/day, which represents a reduction of about 50% compared to lights fully on. The maximum dimming level achieved by the system was 13% light output (15% power level), which is higher than the 1% light level (8% power level) claimed for this system by its manufacturer. The highest daytime consumption (1560 Wh/day) was measured under a completely overcast sky and was only 6% lower than the energy consumption with the electric lights fully on (1660 Wh/day).
Results also showed that under clear sky, the daylight component of the illuminance on the workplane was mostly below 500 lux in the summer, and over 500 lux in the winter for up to 6 hours a day. This was a direct result of the sun’s altitude above the horizon, which at this latitude is at its highest (68°) in June and at its lowest (22°) in December. This caused the daily lighting consumption to frequently be 30% higher in the summer compared to winter, which contradicts the common belief that electric lighting usage between 6 AM and 6 PM would most likely be higher in the winter than in the summer due to the reduced daylight hours.
4.1.2 Performance of the Dimming Control System with Static Venetian Blinds
Table 1 presents the average increase in lighting energy consumption of the dimming control system and reduction in daylight availability caused by the 10 static blind configurations tested, as follows:
4.1.2.1 Blinds retracted versus blinds with slats horizontal
The comparison between the illuminance and the power demand profile of the dimming control system with “all blinds retracted” versus “all blinds horizontal” was conducted in September and May (Galasiu and Atif, 2002). Measured data showed that in both seasons under clear sky, the horizontal blind slats reduced the illuminance at the ceiling photosensor by 30 to 50% for about 8 hours between 6 AM to 6 PM. This in turn increased the lighting consumption of the test room by about 30%. On the desktop, the average difference between the daylight illuminance in the test room versus the reference room was about 10% in both spring and fall. The daylight illuminance was in both rooms below 500 lux in the spring, and above 500 lux in the fall for about 5.5 hours a day. The daily lighting consumption was about 20 to 25% higher in May than in September, which was again directly related to the sun’s position above the horizon (in September, at noon, the sun is at 45°, compared to 63° in May). The fact that the daylight-hours interval is actually longer in May than in September was clearly
insufficient to compensate for the increase in daily energy use generated by the lower indoor illuminance levels.
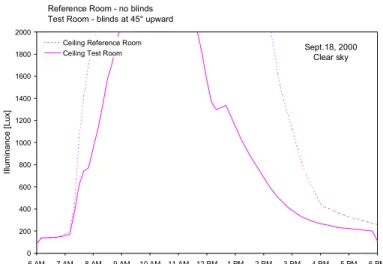
4.1.2.2 Blinds retracted versus blinds with slats at 45˚ upward
The comparison between “all blinds retracted” versus “all blinds at 45˚ upward” showed that under clear sky, the blinds positioned with the slats at a 45˚ upward angle reduced the total illuminance at the ceiling photosensor on average by 45 to 60% in both September and May for about 8 to 10 hours a day. The daylight availability on the desktop was reduced by about 30% in the fall, but was not substantially affected in the spring by this blind setting (about 10% difference between the test and the reference room). In both rooms, the daylight illuminance was always below 500 lux in the spring. In the fall, the daylight illuminance in the reference room was above 500 lux for about 3 hours longer than in the test room. The blinds increased the daily lighting consumption in the test room by 35 to 45% compared to the reference room, and in both rooms the lighting consumption was about 30 to 35% lower in September than in May. As an example, Figure 3 shows a comparison between the power demand profile of the dimming control system, and the illuminance distribution on the workplane and at the ceiling level obtained for these two configurations.
4.1.2.3 Blinds retracted versus blinds with slats at 45˚ downward
The comparison between “all blinds retracted” and “all blinds at 45˚ downward” under a clear sky in September and May showed that the blinds positioned with their slats at a 45˚ downward angle reduced the total illuminance at the ceiling photosensor by 40 to 45% for 7 hours in the spring, and 10 hours in the fall. The daylight availability on the desktop was reduced by about 40% in the fall and by 15% in the spring. In both rooms, the daylight illuminance was mainly below 300 lux in the spring. In the fall, the daylight illuminance in the reference room was above 500 lux for about 4 hours longer than in the test room. The blinds increased the daily lighting energy consumption in the test room by 25 to 30%. In this case too the daily lighting consumption was 20 to 30% higher in May than September.
4.1.2.4 Blinds retracted versus bottom windows 50% covered
The comparison between “all blinds retracted” versus “bottom blinds 50% covered” was conducted in November and July (Galasiu and Atif, 2002). Data showed that under clear sky, the illuminance at the ceiling photosensor was not affected significantly by this blind setting in the fall. In the summer, however, the illuminance at the ceiling photosensor was reduced on average by 25%. In the fall, the daylight illuminance on the desktop was above 500 lux for about one hour longer in the reference room than in the test room and the desktop daylight illuminance was generally reduced by 20%. In both rooms, the daylight illuminance was mostly below 500 lux in the summer. The daily lighting energy consumption of the test room was not affected substantially by the blinds covering half of the bottom windows, and the difference between the two rooms was lower than 10% during both fall and
summer. In both rooms, the daily lighting consumption was about 10% higher in July compared to November. Again, the longer interval of daylight hours in July compared to November did not seem to have counteracted the increase in daily energy use generated by the overall lower indoor
illuminance levels measured in the summer. (The sun’s position above the horizon, at noon, at this location is 24° in November, and 65° in July).
4.1.2.5 Blinds retracted versus bottom windows fully covered
The comparison between “all blinds retracted” versus “bottom blinds fully covered” was conducted in November and July (Galasiu and Atif, 2002). Under clear sky, closing the bottom blinds did not affect the ceiling illuminance in the fall, but it affected it significantly in the summer, when for about 7.5 hours the illuminance in the test room was reduced to 50% of the illuminance measured in the reference room. This increased the daily lighting energy consumption by about 15% in the test room compared to the reference room. In the fall, the difference between the two rooms was about 10%. During both seasons, the daylight availability on the desktop in the test room was affected by the bottom windows being totally covered and the daylight illuminance was reduced on average by 30-35%. In the fall, the daylight illuminance was above 500 lux in the reference room for about 4 hours longer than in the test room. In both rooms the daylight illuminance was lower than 500 lux in the spring. The daily lighting consumption was about 20% higher in July compared to November.
4.1.2.6 Blinds retracted versus top windows fully covered
The comparison between “all blinds retracted” versus “top blinds fully covered” was conducted in December and July (Galasiu and Atif, 2002). Under clear sky in the winter, closing the top blinds reduced the ceiling illuminance by about 30% for 5 hours a day, which in turn increased the daily lighting consumption in the test room by about 20%. Daylight availability on the desktop was not significantly affected by the top blinds being closed in the test room, and the illuminance was above 500 lux for 6 hours a day in both rooms. This shows that because of the top blind setting, the dimming system in the test room could not relate effectively to the daylight illuminance available on the workplane, which was much above the design illuminance. In the summer, the daylight illuminance on the desktop was always below 500 lux and the difference in lighting consumption between the two rooms was about 15%. At both the ceiling photosensor and on the desktop the daylight availability was reduced on average by 20 to 25%. There was no significant difference in the daily lighting consumption of the two rooms under clear sky in December compared to July. This seems to be one of the few cases when the longer daylight hours interval in July compared to December sufficed in offsetting the increase in the daily energy use caused by the sun’s position and the associated lower indoor illuminance levels measured in the summer.
4.1.2.7 Top blinds tests
These tests were conducted in October, December and June and showed the effect on the lighting energy consumption from setting the top blinds in two different positions (horizontal and at a 45˚ downward angle), while the bottom windows were completely covered in both the test and the reference room. Data presented above showed that covering the bottom windows completely and leaving the top windows uncovered under a clear sky increased the daily lighting consumption by about 10 to 15% compared to the reference case with all blinds fully retracted. Once the bottom blinds were closed in both rooms, however, setting the top blinds horizontally, increased the lighting consumption by about 5% in the December, and by about 15% June. When the top blinds were positioned at a 45˚ downward angle there was an increase in daily lighting energy consumption of about 10% in June, and 20% in October. During these tests, the daily lighting consumption under clear sky was between 5 to 25% higher in June compared to October and December.
4.1.2.8 Bottom blinds tests
These tests were conducted in October and June and showed the effect on the lighting energy consumption from setting the bottom blinds in two different positions (horizontal and at a 45˚ downward angle), while the top windows were completely covered (Galasiu and Atif, 2002). Previous tests showed that covering the top windows completely and leaving the bottom windows uncovered under a clear sky increased the lighting consumption by about 15 to 20% compared to the reference case with all blinds fully retracted. Once the top blinds were closed in both rooms, if the bottom windows had horizontal blinds or the blinds were tilted at 45˚ downward made a significant difference only in the summer when the lighting consumption increased by about 30%. This effect was not evident in the fall, when the difference in lighting consumption between the two rooms was less then 5%. The daily lighting consumption was not significantly different in the reference room in October compared to June. However, in the test room, the daily lighting consumption was about 30% higher in June compared to October, when the bottom windows were covered with blinds with slats horizontal or tilted at 45˚ downward.
Overall, data collected during the “top and bottom blind” tests showed that in spite of the fact that the bottom windows were twice the size of the top windows, in the fall and winter especially, covering the bottom windows with blinds (either half or completely) and leaving the top windows unobstructed had a lower effect on the lighting energy consumption than the reverse configuration with the top windows covered and the bottom windows uncovered. With the top blinds closed, the dimming system could not reach its full savings potential even when the daylight availability on the workplane was high and at levels much above the space design illuminance. In the summer, both the “bottom blinds closed” and the “top blinds closed” configurations increased the daily lighting consumption in the test room by 15% compared to the “no blinds” reference room.
The correlation between the lighting consumption of the dimming lighting control and each blind configuration was found to be reasonably independent of season and mostly dependent on the sky condition. Figures 4 and 5 show trendlines of the daily lighting energy consumption under sky conditions ranging from clear to overcast sky for all blind configurations tested. The lighting consumption with the electric lights at full power from 6 AM to 6 PM, or the electric lighting consumption with “ideal” blinds fully closed was also included (assuming that “ideal” blinds would obstruct all the incoming daylight from reaching the interior when the blinds are fully closed). As shown, depending on their setting, the presence of window blinds under clear sky increased the daily lighting consumption in the test room somewhere between 5 to 45% compared to the blinds fully retracted in the reference room. The effect of the blinds on the lighting consumption was less pronounced as the sky condition changed from clear to overcast sky.
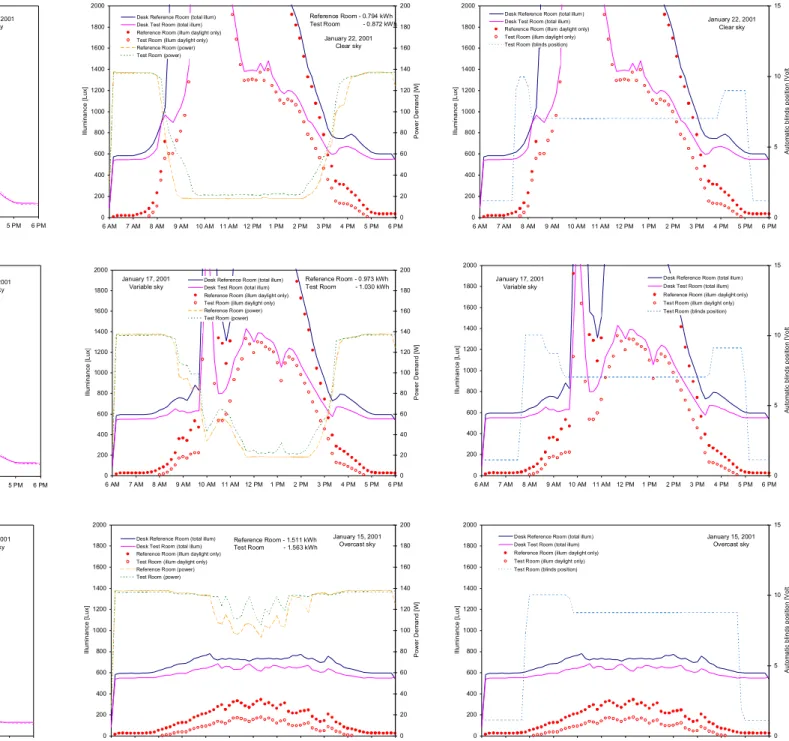
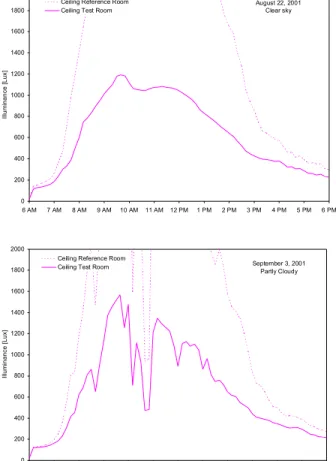
4.1.3 Performance of the Dimming Control System with Photocontrolled Blinds
When used in combination with photocontrolled blinds, the daily energy consumption of the dimming control system increased with the sun altitude, when the direct sun availability indoor was reduced. Figures 6 and 7 show examples of the daily performance of the continuous dimming lighting control system and the photocontrolled venetian blinds for two periods of the year, December to March, and July to September for three sky conditions: clear, variable and completely overcast sky. Figure 8 shows trendlines of the daily lighting energy consumption from 6 AM to 6 PM for all the data collected during the two mentioned periods. Compared to the blinds fully retracted configuration in the reference room, data collected from December to March in the test room showed an average increase in daily lighting energy consumption of about 10% under clear and partly cloudy sky, and up to 15% under overcast sky. Data collected from July to September showed an increase between 25 to 45% in energy consumption under clear and partly cloudy sky, and between 7 to 15% under overcast sky. This suggests that a photocontrolled blind system would impact less on the performance of the lighting control system than most of the static blind configurations tested in this study, especially in the winter when the sun is at a low altitude.
The increased lighting energy savings would seemingly be a benefit added to a good protection of the indoor against direct sun, glare and overheating. However, as shown in Figures 6 and 7, this was not always the case. In the summer (Figure 7, graphs on the right-side column), the photocontrolled blinds installed in the test room with continuous dimming lighting control remained mostly open (slats horizontal) or very close to open during daytime regardless of the sky condition. This was expected because the indoor daylight availability in the summer was never high enough to actually justify frequent adjustments. Yet, the blinds adjusted very slightly and never closed throughout the day even in December and January when under clear sky, the indoor daylight levels raised significantly (Figure 6). Nevertheless, measurements show that even though occasionally greater than expected illuminance values were present indoors, the photocontrolled blinds still reduced the daylight
illuminance on desktop in the test room to about half of the illuminance in the “no blinds” reference room, which suggests that this room was still protected better from direct sunlight than the “no blinds” room. At the ceiling control photosensor, the illuminance was not significantly affected by the automatic blinds from December to February, but was reduced on average by 50% during August and September, which explains the lesser effect that the photocontrolled blinds had on the lighting consumption of the dimming system in the winter compared to summer.
4.2 PERFORMANCE OF THE AUTOMATIC ON/OFF LIGHTING SYSTEM 4.2.1 Performance of the Automatic On/Off Control System without Blinds
Similarly to the dimming control system, the lowest lighting energy consumption of the automatic on/off system in the “no blinds” reference room was recorded on the same clear sky day in March (460 Wh/day), when the electric lighting was off from about 7:30 AM to 3 PM. This represents a reduction of 65% in daily lighting consumption compared to the electric lights being fully on from 6 AM to 6 PM. However, similarly to the dimming system, this level of performance occurred in less than 20% of all the clear sky days available during the one-year monitoring period. Usually, the average daily consumption of the automatic on/off system on clear sky days was about 600 Wh/day, which represents a reduction of about 50% compared to lights fully on. The highest daily consumption of the automatic on/off system was measured under completely overcast skies (1340 Wh/day) when the electric lighting was continuously on between 6 AM and 6 PM.
As found for the dimming control system, in this case too the daily lighting consumption in the “no blinds” reference room was about 40% higher in May than in September, and 5-10% higher in June and July compared to November and December. Data shows that between 6 AM and 6 PM, the electric lighting was off for about 1 to 2 hours longer under fall and winter clear skies (usually between 9 AM to 3 PM) than under spring and summer clear skies (at most between 9 AM to 1 PM). This suggests that the reduced daylight hours in the winter, which trigger about 4 hours of operation at full power out of the 12 hours considered (i.e. between 6 to 8 AM and 4 to 6 PM), may have a lesser impact on the daily lighting consumption of this type of lighting control system than the overall low indoor daylight levels occurring throughout the entire day in the summer due to the higher sun altitude.
4.2.2 Performance of the Automatic On/Off Control System with Static Venetian Blinds 4.2.2.1 All blinds tests
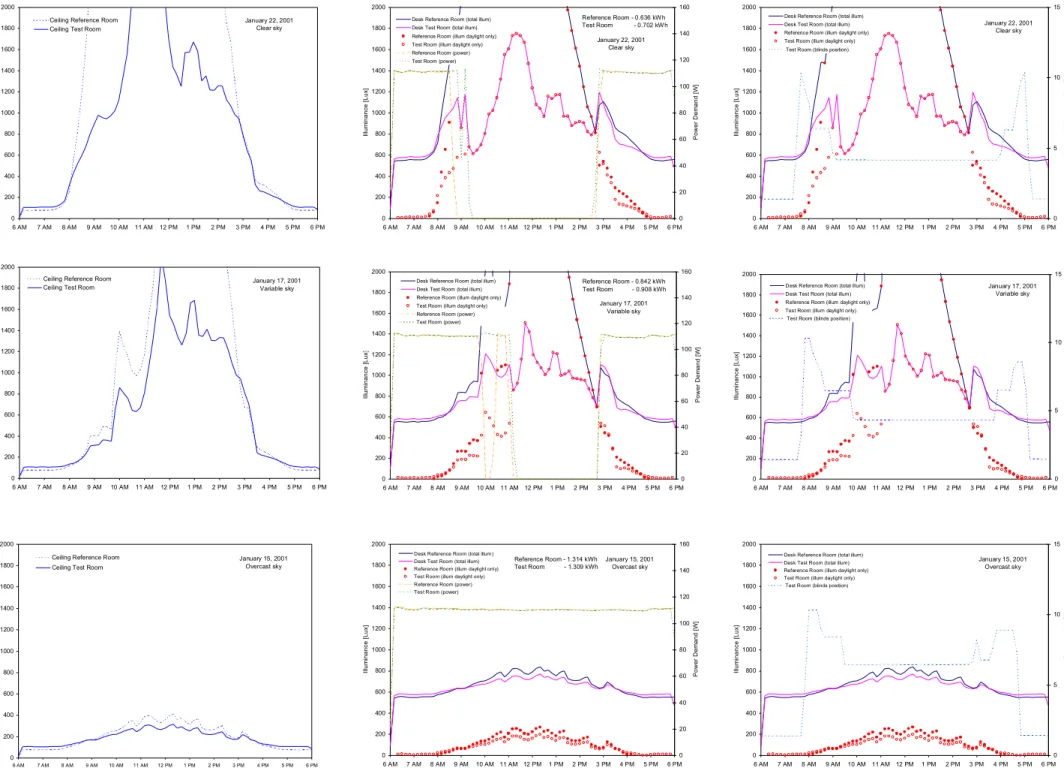
Table 2 presents the average increase in energy consumption of the automatic on/off lighting control system and the reduction in daylight availability on the workplane and at the ceiling photosensor caused by the 10 blind configurations tested. As an example, Figure 9 shows a comparison between the power demand profiles of the automatic on/off lighting control system, and the illuminance distribution at the workplane and ceiling level for “all blinds fully retracted” versus “all blinds at 45˚
upward” configurations under a clear sky in September and May. The sharp drop in ceiling illuminance level shown around noon in September was caused by a tree located remotely in front of this room’s window. An important shading effect from the tree crown was observed only during three months of the year (September, October and November), when the low daylight levels at the ceiling photosensor triggered a change in lights status from off to on. This aspect was taken into account in the comparison analysis between the test and the reference room, and the energy consumption shown in brackets in Figure 9 represents the energy consumption after the “tree-effect” had been eliminated. This occurrence, nonetheless, showed the importance of accounting for other environmental factors other than the window shading devices when estimating the saving potential of daylight-linked lighting control systems.
As mentioned previously, measured data showed that the effect of the blinds on the savings potential of the automatic on/off lighting control system was much greater in the spring and summer than in the fall and winter. In the “no blinds” reference room, the illuminance at the ceiling photosensor was often up to 80% higher during fall and winter than during spring and summer. In the test room, regardless of the blind setting and season, the illuminance at the ceiling photosensor was about half of the illuminance measured simultaneously in the reference room. This caused the illuminance at the ceiling photosensor to be mostly below 1000 lux for most blind configurations in the spring and summer, which triggered the electric lights to stay fully on in this room for the entire day, even under completely clear skies. This increased the lighting consumption in the test room by 50 to 80% compared to the lighting consumption in the “no blinds” reference case. As shown in Table 2, the only time in the summer when the electric lighting system in both rooms performed in a similar way was during the test which compared the “all blinds retracted” versus the “bottom windows half covered” configurations. In this case, the difference in lighting consumption between the two rooms was only 15%. For all the other blind configurations tested, the daylight illuminance on the desktop in the test room was mostly below 500 lux in spring and summer, compared to the illuminance being slightly over 500 lux in the reference room for about 4 to 6 hours a day.
The daylight illuminance on the desktop was generally over 500 lux in the fall and winter in both rooms between 8:30 AM and 2 PM for most blind configurations, with the exception of the test which compared the “all blinds retracted” versus the “bottom windows fully covered” configurations. The average difference in lighting consumption between the two rooms under clear sky in the fall and winter was:
• 10% when the blinds in the test room were horizontal; • 35% when the blinds in the test room were at 45˚ upward; • 30% when the blinds in the test room were at 45˚ downward;
• no significant difference (less than 5%) when the bottom windows in the test room were either half or fully covered;
Generally, data showed that all blind configurations tested affected to a certain extent the energy savings potential of the automatic on/off lighting control system. However, of them all, two configurations have caused important shortcomings in its performance. In December, when the top windows were completely obstructed by blinds, the electric lighting continued to operate even when the daylight illuminance on the desktop was extremely high and much above the space design illuminance. This increased the lighting consumption of the test room by 40 to 60%. Similarly, in November when the top windows were not obstructed by blinds but the bottom windows were completely covered, the electric lighting remained off even at times when the desktop illuminance dropped below the design illuminance.
4.2.2.2 Top blinds tests
As mentioned before, these tests were designed to compare the effect on the lighting energy consumption from the top blinds being positioned in two different ways while the bottom windows were completely covered. Previous tests showed that covering the bottom windows and leaving the top windows uncovered under a clear sky in November did not have a significant effect on the lighting consumption (less than 5% difference between the test and the reference room). In July, however, the effect from the bottom blinds was significant, and the electric lights were on for the entire day in the test room, while the lights were off for 4.5 hours in the “no blinds” reference room. This increased the daily lighting consumption of the test room by 60%. Once the bottom blinds were closed in both rooms in December, the difference in lighting consumption between the two rooms was about 5% when the top windows were not covered by blinds or when the top blinds were horizontal, and 20% when the top blinds were tilted at 45˚ downward. In June, however, the difference in lighting energy consumption between the two rooms was only 10%, regardless of the top blinds being horizontal or tilted at 45˚ downward.
4.2.2.3 Bottom blinds tests
These tests were designed to compare the impact on the lighting energy consumption of two different configurations of the bottom blinds when the top windows were completely covered. Previous tests showed that covering the top windows completely and leaving the bottom windows uncovered under a clear sky increased the lighting consumption by about 40 to 60% in the test room compared to the reference case with no blinds. Once the top blinds were closed in both rooms, the lighting consumption in the test room increased in October on average by 30% when the bottom blinds were positioned with the slats horizontal or at 45˚ downward. In June, the difference in lighting energy consumption between the two rooms was only 5%, regardless of the top blinds being horizontal or tilted at 45˚ downward. During these tests, the illuminance was reduced on average by 50% at the ceiling level and by 20% on the desktop.
A general annual correlation based on blind configuration and sky condition could not be developed for the automatic on/off lighting control system because its performance varied largely from one season to another under similar blind configurations.
4.2.3 Performance of the Automatic On/Off Control System with Photocontrolled Blinds
Figures 10 and 11 show examples of the daily performance of the automatic on/off lighting control system and photocontrolled venetian blinds from December to March, and from July to September for three sky conditions. Figure 12 shows trendlines of the daily lighting energy consumption from 6 AM to 6 PM for all the data collected during these two periods.
Under clear sky, the photocontrolled blinds increased the daily energy consumption of the automatic on/off lighting control system on average by 15% in the winter, and by 25% in the summer. The electric lighting was always fully on under overcast sky. The daylight illuminance on the desktop was not significantly affected by the photocontrolled blinds in August and September, because the blinds adjusted only slightly from the horizontal position throughout the day. Daylight illuminance levels were, however, significantly reduced in December and January, when the blinds were mostly tilted at a 45˚ downward angle to prevent the access of direct sun into the room. Under clear sky, the photocontrolled blinds reduced the illuminance at the ceiling photosensor in the test room to half of the illuminance in the reference room. Under overcast sky, the photocontrolled blinds never opened to a fully horizontal position even when the indoor daylight illuminance was very low. This did not affect, however, the lighting energy consumption because the electric lighting would have been on anyway due to the low overall daylight levels under this sky condition.
4.3 CONTINUOUS DIMMING VERSUS AUTOMATIC ON/OFF LIGHTING CONTROL
Surprisingly, the continuous dimming control system used in this study did not surpass the automatic on/off system in terms of energy efficiency. On the contrary, the dimming system used up to 35% more electric energy than the automatic on/off system over a 12-hour period during daytime with clear sky and without blinds, and about 24% more electric energy over a 12-hour period during night time to provide an average illuminance of 570 lux on the desktop (1.66 kWh versus 1.34 kWh). Under partly cloudy and overcast skies the difference between the two lighting systems was somewhat lower due to the capability of the dimming system to reduce the power to the lamps at times when the on/off system was fully on.
Figure 13 presents a side-by-side comparison between the performance of the automatic on/off and the continuous dimming lighting systems used with photocontrolled blinds under a clear sky. As shown, both control systems reduced substantially the lighting energy consumption when compared to the consumption of the lighting system being fully on between 6 AM and 6 PM. However, as mentioned before, this particular day in March provided a rather uncommon example of the best performance that was observed throughout the entire year for both systems, which was achieved in
less than 20% of the clear sky days occurring throughout the monitoring period. The average daily energy consumption was generally 30% higher than the consumption measured for this particular day in March.
As shown in Figure 13, once again the dimming system used about 40 to 60% more lighting energy than the automatic on/off. The additional energy used by the dimming system was due to two factors. First, the components of the continuous dimming system required more power to operate than those of the automatic on/off system. Second, the minimum light output of the dimming system under clear sky was 13%, which was associated with a minimum power usage of 15%, whereas the minimum light output and power level of the automatic on/off was 0%. These two factors outweighed the occasions when the on/off system was at 100%, and the dimming system was at less than 100%. However, it must be kept in mind that these results came from a highly daylit perimeter office and, therefore, the continuous dimming system may be relatively more advantageous in other settings.
In addition, a continuous dimming system may be more agreeable for the occupants due to its capability to adjust the light levels in an unnoticeable way. Anecdotal evidence from the users’ perspective suggested that overall, the continuous dimming system was less distracting to the occupants. Nevertheless, the fact that the lights were still “on” under clear sky (even if dimmed to 15% of initial power load in this installation) was less appreciated by the occupants. Likewise, while the automatic on/off saved overall more energy, the sudden changes in light levels due to frequent switching between the on and off states were found by the occupants to be distracting.
The results suggest that a continuous dimming system combined with a lights-off capability would be a more desirable and energy efficient solution. However, for technical reasons and in order to prolong lamp life, most commercial fluorescent photocontrolled dimming systems are expressly built to not allow the electric lighting system to switch off entirely. The results of this study showed, nonetheless, that in some applications this will come with an energy penalty when compared to an automatic on/off system.
4.4 MANUAL VERSUS PHOTOCONTROLLED BLINDS
As expected, when used in combination with photocontrolled blinds, the savings in lighting energy consumption increased noticeably especially for the automatic on/off lighting control. In this case, the presence of the photocontrolled blinds increased the daily lighting consumption by only 15 to 25%, compared to most of the static configurations tested, which increased the lighting consumption somewhere between 10 to 80%. In the case of the dimming control, however, the advantage introduced by the photocontrolled blinds was less evident especially in the summer, when both static and photocontrolled blinds increased the daily lighting consumption somewhere between 5 to 45%. However, in the winter, the beneficial effect from the use of the photocontrolled blinds was more
apparent. In this case the daily lighting consumption increased by only 15% with photocontrolled blinds, while the increase was about 30 to 35% with most static blind configurations.
Evidently, the savings in lighting energy provided by the use of photocontrolled blinds would depend greatly on the sensitivity level selected for the operation of the blind system. It was shown that the photocontrolled blinds performed somewhat differently in the two side-by-side test rooms, regardless of the fact that they were set to operate at the same level of sensitivity. Such an example is shown in Figure 13, when the blinds remained open throughout the day in the test room with dimming control, not being able to reduce the peak in daylight illuminance shown around 11 AM. This peak was not present in the test room with automatic on/off control, which was better protected from direct sunlight by the tilted blind slats. Likewise, under overcast sky, the blinds in the dimming room have adjusted better to a fully horizontal position than the blinds in the automatic on/off room, which occasionally remained tilted even when the daylight illuminance was very low (Figures 6, 7, 10 and 11). This indicates that the photocontrolled blinds in the on/off room have adjusted better to higher daylight levels, contrary to the blinds in the dimming room which performed better under overcast sky. The difference in blind response may have originated from the fact that each room had an independent blind system with its own control photosensor, and a perfect synchronization between the two rooms was rather difficult to achieve. Alternatively, this does not imply that the difference in blind system performance could not have originated from a system related technicality.
5. CONCLUSIONS
Two types of commercial lighting control systems were tested during a one-year field experiment: photocontrolled continuous dimming and photocontrolled automatic on/off. The lighting energy consumption of each system was recorded daily from 6 AM to 6 PM under various sky conditions and window blind configurations including windows without blinds, windows equipped with photocontrolled automatic blinds, and windows equipped with manual venetian blinds positioned in 10 different ways.
Results showed that under clear sky and with the blinds fully retracted both lighting control systems were able to provide considerable lighting energy savings when compared to the lights being fully on during the same 12-hour daytime interval. However, in real-world installations window blinds affect the performance of these systems. The mode of operation selected for the operation of photocontrolled blinds, as well as the various configurations that can be chosen by the occupants for manually-operated blinds were showed to have reduced significantly the lighting energy savings potential of both lighting control systems. The impact of the blinds on the lighting consumption was a function of the variability of daylight levels due to the sky condition, which varied largely from one season to another for the automatic on/off system, but showed no significant seasonal dependency in the case of the dimming control system.
Results also showed that both lighting control systems achieved greater energy savings when used in combination with photocontrolled venetian blinds than when used in combination with most static blind configurations. This was because the photocontrolled blinds were able to adjust their slats periodically according to the variations in external daylight levels, and this was showed to have especially improved the saving potential of the automatic on/off system. However, results also showed that the photocontrolled blinds used in this experiment have not always performed as expected and have not adjusted in the most optimum fashion at all times. Occasionally, under clear sky the blinds allowed direct sun to reach indoors, while some other times, under overcast sky, the blinds did not adjust to a fully horizontal position even when the indoor daylight levels were very low. It is believed, however, that future enhancements to this system would further improve its lighting energy savings potential.
Unexpected, however, was the fact that the automatic on/off lighting control system tested in this installation achieved greater lighting energy savings than the continuous dimming control. A major reason for this had undoubtedly to do with the fact that these results were obtained in a highly daylit setting and therefore, the continuous dimming system may be relatively more advantageous in other settings. In well daylit environments, however, the results suggest that a continuous dimming system combined with a lights-off capability would to be a more desirable and energy efficient solution. In addition, knowledge and awareness about the magnitude of the effect that window shading devices or other environmental factors, such as shading from surrounding vegetation, may have on the performance of photocontrolled lighting systems would unquestionably allow for a better selection of the most appropriate design solution for each individual application. This would also allow for more accurate estimates when anticipating the saving potential of these systems, and would offer an improved operation and optimization for energy savings.
REFERENCES
Atif, M. R., Galasiu, A. D., 2003. Energy performance of daylight-linked automatic lighting control systems in large atrium spaces: report on two field-monitored case studies. Energy and Buildings, Vol. 35(5), pp. 441-461.
Benton, C., Fountain, M., Selkowitz, S., Jewell, J., 1991. Control System Performance in a Modern Daylighted Office Building. Proceedings of the 22nd session of the CIE, Vol. 1, Melbourne, Australia, pp. 31-24.
Bordass, W., Heasman, T., Leaman, A., Perry, M.J., 1994. Daylight use in open plan offices: the opportunities and the fantasies. Proceedings of National Lighting Conference and Daylighting
Colloquium, Robison College, Cambridge, UK, pp. 243-256.
Brekke, B., Hansen, E. H., 1997. Energy Saving in Lighting Installations by Utilizing Daylight.
CADDET Energy Efficiency Newsletter no.1, pp.24-26.
Floyd, D.B., Parker, D. S., 1995. Field commissioning of a daylight-dimming lighting system.
Proceedings of the 3rd European Conference on Energy-Efficient Lighting - Right Light 3, Newcastle,
UK, pp. 83-88.
Galasiu, A.D., Atif, M.R., 2002. Field-performance of daylight-linked lighting controls and window blinds: a pilot study. Proceedings of the 5th European Conference on Energy-Efficient Lighting -
Right Light 5, Nice, France, pp. 1-14.
Lee, E., DiBartolomeo, D., Selkowitz, S., 1999. The Effect of Venetian Blinds on Daylight Photoelectric Control Performance. Journal of the Illuminating Engineering Society, Vol. 28(2), pp. 3-23.
Lindsay C.T.R., Littlefair, P.J., 1992. Occupant use of venetian blinds in offices. Building Research
Establishment Garston Library, Contract PD233/92, Watford, UK.
Love, J., 1995. Field performance of daylighting systems with photoelectric controls. Proceedings of
the 3rd European Conference on Energy-Efficient Lighting - Right Light 3, Newcastle, UK, pp. 75-82.
Opdal, K., Brekke, B., 1995. Energy Savings in Lighting by Utilization of Daylight, Proceedings of the
Rea, M.S., 1984. Window blind occlusion: a pilot study. Building and Environment, Vol. 19(2): pp. 133-137.
Slater, A., 1995. Occupant use of lighting controls: A review of current practice, problems, and how to avoid them. Proceedings of the CIBSE National Conference, Eastbourne, UK, pp. 204-209.
Slater, A., 1996. Lighting controls in offices: How to improve occupant comfort and energy efficiency,
Proceedings of the CIBSE National Lighting Conference, Bath, UK, pp. 178-184.
ACKNOWLEDGMENT
This work was conducted as part of a project co-funded by the Panel on Energy Research and Development, Public Works and Government Services Canada and the National Research Council Canada. The authors would like to acknowledge the valuable contribution of their colleague Roger Marchand who assisted on site with the data collection. Special gratitude is also due to the occupants of the monitored offices: Harris Cunningham, Brian Kyle, Zoubir Lounis, Frédérique Malpas, Guy Felio, Bilgin Buberoglu, and Jefferey Potkins, all employees of the Institute for Research in Construction of the National Research Council Canada, for their cooperation and understanding during the course of the project.
Figure 1 Exterior view of the south-facing façade
Fall 0 200 400 600 800 1000 1200 1400 1600 1800 2000 6 AM 7 AM 8 AM 9 AM 10 AM 11 AM 12 PM 1 PM 2 PM 3 PM 4 PM 5 PM 6 PM Il lum inanc e [ Lux ]
Ceiling Reference Room
Ceiling Test Room Sept.18, 2000
Clear sky Reference Room - no blinds
Test Room - blinds at 45° upward
0 200 400 600 800 1000 1200 1400 1600 1800 2000 6 AM 7 AM 8 AM 9 AM 10 AM 11 AM 12 PM 1 PM 2 PM 3 PM 4 PM 5 PM 6 PM Il lum inanc e [ Lux ] 0 20 40 60 80 100 120 140 160 180 200 P o wer Dem and [ W ]
Desk Reference Room (total illum) Desk Test Room (total illum) Reference Room (illum daylight only) Test Room (illum daylight only) Reference Room (power) Test Room (power)
Sept.18, 2000 Clear sky Reference Room - 0.720 kWh Test Room - 0.944 kWh Reference Room - no blinds
Test Room - blinds at 45° upward
Spring 0 200 400 600 800 1000 1200 1400 1600 1800 2000 6 AM 7 AM 8 AM 9 AM 10 AM 11 AM 12 PM 1 PM 2 PM 3 PM 4 PM 5 PM 6 PM Il lum inanc e [ Lux ]
Ceiling Reference Room
Ceiling Test Room May 20, 2001
Clear sky
Reference Room - no blinds Test Room - blinds at 45° upward
0 200 400 600 800 1000 1200 1400 1600 1800 2000 6 AM 7 AM 8 AM 9 AM 10 AM 11 AM 12 PM 1 PM 2 PM 3 PM 4 PM 5 PM 6 PM Il lum inanc e [ Lux ] 0 20 40 60 80 100 120 140 160 180 200 P ow er D em and [ W ]
Desk Reference Room (total illum) Desk Test Room (total illum) Reference Room (illum daylight only) Test Room (illum daylight only) Reference Room (power) Test Room (power)
Reference Room - no blinds Test Room - blinds at 45° upward
May 20, 2001 Clear sky Reference Room - 0.948 kWh Test Room - 1.327 kWh
Figure 3 Example of power demand profiles of the continuous dimming lighting system and illuminance distribution at the ceiling and desktop levels. CONFIGURATION SHOWN:
Blinds at 45° downward y = 0.7627x + 424.09 R2 = 0.9917 Blinds horizontal y = 0.7397x + 447.46 R2 = 0.985 Blinds at 45° upward y = 0.6813x + 600.35 R2 = 0.8956 No blinds y = 1.0708x - 97.891 R2 = 0.9836 0 200 400 600 800 1000 1200 1400 1600 1800 2000 0 200 400 600 800 1000 1200 1400 1600 1800 2000 Lighting Energy Consumption of Reference Room [Wh/day]
Light ing Energy C ons um pt ion of T e s t R oom [ W h/ day ] no blinds blinds horizontal blinds at 45° upward blinds at 45° downward blinds fully closed
CONTINUOUS DIMMING
CLEAR SKY
OVERCAST SKY "Ideal" blinds fully closed
Top blinds closed y = 0.8497x + 317.25
R2 = 0.927 Bottom blinds closed y = 0.9026x + 189.03
R2 = 0.9838 Bottom blinds 50% retracted
y = 0.96x + 43.334 R2 = 0.9531 No blinds y = 1.0708x - 97.891 R2 = 0.9836 0 200 400 600 800 1000 1200 1400 1600 1800 2000 0 200 400 600 800 1000 1200 1400 1600 1800 2000 Lighting Energy Consumption of Reference Room [Wh/day]
Light ing Energy C ons um pt ion of T e s t R oom [ W h/ day ] no blinds
bottom blinds 50% retracted bottom blinds closed top blinds closed blinds fully closed
CONTINUOUS DIMMING
CLEAR SKY
OVERCAST SKY "Ideal" blinds fully closed
Figure 4 Lighting energy consumption of the dimming control system in the test and reference rooms for various sky conditions and blind settings (ALL BLINDS TESTS; Daily lighting energy consumption calculated from 6 AM to 6 PM).
No blinds y = 1.0708x - 97.891
R2 = 0.9836 Bottom blinds closed
No top blinds y = 0.9703x + 48.984
R2 = 0.9807
Bottom blinds closed Top blinds horizontal y = 0.9178x + 171.5
R2 = 0.978 Bottom blinds closed
Top blinds at 45° downward y = 0.799x + 340.87 R2 = 0.9999 0 200 400 600 800 1000 1200 1400 1600 1800 2000 0 200 400 600 800 1000 1200 1400 1600 1800 2000 Lighting Energy Consumption of Reference Room [Wh/day]
Light ing Energy C ons um pt ion of T e s t R o m m [ W h/ day ] no blinds
bottom blinds closed, no top blinds bottom blinds closed, top blinds horizontal bottom blinds closed, top blinds at 45° downward blinds fully closed
CLEAR SKY
OVERCAST SKY
CONTINUOUS DIMMING
"Ideal" blinds fully closed
No blinds y = 1.0708x - 97.891
R2 = 0.9836
Top blinds closed No bottom blinds y = 0.9939x + 12.244
R2 = 0.9873
Top blinds closed Bottom blinds at 45° downward
y = 0.6382x + 585.63 R2 = 0.509
Top blinds closed Bottom blinds horizontal
y = 0.7125x + 487.97 R2 = 0.6124 0 200 400 600 800 1000 1200 1400 1600 1800 2000 0 200 400 600 800 1000 1200 1400 1600 1800 2000 Lighting Energy Consumption of Reference Room [Wh/day]
Light ing Energy C ons um pt ion of T e s t R oom [ W h/ day ] no blinds
top blinds closed, no bottom blinds top blinds closed, bottom blinds horizontal top blinds closed, bottom blinds at 45° downward blinds fully closed
CONTINUOUS DIMMING
CLEAR SKY
OVERCAST SKY "Ideal" blinds fully closed
Figure 5 Lighting energy consumption of the dimming control system in the test and reference rooms for various sky conditions and blind settings (BOTTOM AND TOP BLINDS TESTS; Daily lighting energy consumption calculated from 6 AM to 6 PM).
0 200 400 600 800 1000 1200 1400 1600 1800 2000 6 AM 7 AM 8 AM 9 AM 10 AM 11 AM 12 PM 1 PM 2 PM 3 PM 4 PM 5 PM 6 PM Il lu m inance [ Lux]
Ceiling Reference Room Ceiling Test Room
January 22, 2001 Clear sky 0 200 400 600 800 1000 1200 1400 1600 1800 2000 6 AM 7 AM 8 AM 9 AM 10 AM 11 AM 12 PM 1 PM 2 PM 3 PM 4 PM 5 PM 6 PM Il lu m inance [ Lux] 0 20 40 60 80 100 120 140 160 180 200 Po we r De m a n d [ W ]
Desk Reference Room (total illum) Desk Test Room (total illum) Reference Room (illum daylight only) Test Room (illum daylight only) Reference Room (power) Test Room (power)
January 22, 2001 Clear sky Reference Room - 0.794 kWh Test Room - 0.872 kW h 0 200 400 600 800 1000 1200 1400 1600 1800 2000 6 AM 7 AM 8 AM 9 AM 10 AM 11 AM 12 PM 1 PM 2 PM 3 PM 4 PM 5 PM 6 PM Il lu m inance [ Lux] 0 5 10 15 A u to m a tic b lin d s p o s itio n [V o lt
Desk Reference Room (total illum) Desk Test Room (total illum) Reference Room (illum daylight only) Test Room (illum daylight only) Test Room (blinds position)
January 22, 2001 Clear sky 0 200 400 600 800 1000 1200 1400 1600 1800 2000 6 AM 7 AM 8 AM 9 AM 10 AM 11 AM 12 PM 1 PM 2 PM 3 PM 4 PM 5 PM 6 PM Il lu m inance [ L ux]
Ceiling Reference Room
Ceiling Test Room January 17, 2001Variable sky
0 200 400 600 800 1000 1200 1400 1600 1800 2000 6 AM 7 AM 8 AM 9 AM 10 AM 11 AM 12 PM 1 PM 2 PM 3 PM 4 PM 5 PM 6 PM Il lu m inance [ Lux ] 0 20 40 60 80 100 120 140 160 180 200 Pow e r D e m and [ W ]
Desk Reference Room (total illum) Desk Test Room (total illum) Reference Room (illum daylight only) Test Room (illum daylight only) Reference Room (power) Test Room (power)
January 17, 2001 Variable sky Reference Room - 0.973 kWh Test Room - 1.030 kWh 0 200 400 600 800 1000 1200 1400 1600 1800 2000 6 AM 7 AM 8 AM 9 AM 10 AM 11 AM 12 PM 1 PM 2 PM 3 PM 4 PM 5 PM 6 PM Il lu m inance [ Lux] 0 5 10 15 Aut o m a ti c bl in ds posi ti on [ V ol t
Desk Reference Room (total illum) Desk Test Room (total illum) Reference Room (illum daylight only) Test Room (illum daylight only) Test Room (blinds position)
January 17, 2001 Variable sky 0 200 400 600 800 1000 1200 1400 1600 1800 2000 6 AM 7 AM 8 AM 9 AM 10 AM 11 AM 12 PM 1 PM 2 PM 3 PM 4 PM 5 PM 6 PM Il lu m inance [ L ux]
Ceiling Reference Room Ceiling Test Room
January 15, 2001 Overcast sky 0 200 400 600 800 1000 1200 1400 1600 1800 2000 6 AM 7 AM 8 AM 9 AM 10 AM 11 AM 12 PM 1 PM 2 PM 3 PM 4 PM 5 PM 6 PM Il lu m inance [ L ux] 0 20 40 60 80 100 120 140 160 180 200 Pow e r D e m and [ W ]
Desk Reference Room (total illum) Desk Test Room (total illum) Reference Room (illum daylight only) Test Room (illum daylight only) Reference Room (power) Test Room (power)
January 15, 2001 Overcast sky Reference Room - 1.511 kWh Test Room - 1.563 kWh 0 200 400 600 800 1000 1200 1400 1600 1800 2000 6 AM 7 AM 8 AM 9 AM 10 AM 11 AM 12 PM 1 PM 2 PM 3 PM 4 PM 5 PM 6 PM Il lu m inance [ L ux] 0 5 10 15 A u to m a tic b lin d s p o s itio n [V o lt
Desk Reference Room (total illum) Desk Test Room (total illum) Reference Room (illum daylight only) Test Room (illum daylight only) Test Room (blinds position)
January 15, 2001 Overcast sky
0 200 400 600 800 1000 1200 1400 1600 1800 2000 6 AM 7 AM 8 AM 9 AM 10 AM 11 AM 12 PM 1 PM 2 PM 3 PM 4 PM 5 PM 6 PM Il lu m inance [ Lux]
Ceiling Reference Room Ceiling Test Room
August 22, 2001 Clear sky 0 200 400 600 800 1000 1200 1400 1600 1800 2000 6 AM 7 AM 8 AM 9 AM 10 AM 11 AM 12 PM 1 PM 2 PM 3 PM 4 PM 5 PM 6 PM Il lu m inance [ Lux] 0 20 40 60 80 100 120 140 160 180 200 Po we r De m a n d [ W ]
Desk Reference Room (total illum) Desk Test Room (total illum) Reference Room (illum daylight only) Test Room (illum daylight only) Reference Room (power) Test Room (power)
August 22, 2001 Clear sky Reference Room - 0.693 kWh Test Room - 1.012 kWh 0 200 400 600 800 1000 1200 1400 1600 1800 2000 6 AM 7 AM 8 AM 9 AM 10 AM 11 AM 12 PM 1 PM 2 PM 3 PM 4 PM 5 PM 6 PM Il lu m inance [ Lux] 0 5 10 15 A u to m a tic b lin d s p o s itio n [V o lt
Desk Reference Room (total illum) Desk Test Room (total illum) Reference Room (illum daylight only) Test Room (illum daylight only) Test Room (blinds position)
August 22, 2001 Clear sky 0 200 400 600 800 1000 1200 1400 1600 1800 2000 6 AM 7 AM 8 AM 9 AM 10 AM 11 AM 12 PM 1 PM 2 PM 3 PM 4 PM 5 PM 6 PM Il lu m inance [ L ux]
Ceiling Reference Room
Ceiling Test Room September 3, 2001
Partly Cloudy 0 200 400 600 800 1000 1200 1400 1600 1800 2000 6 AM 7 AM 8 AM 9 AM 10 AM 11 AM 12 PM 1 PM 2 PM 3 PM 4 PM 5 PM 6 PM Il lu m inance [ Lux ] 0 20 40 60 80 100 120 140 160 180 200 Po we r De m a n d [ W ]
Desk Reference Room (total illum) Desk Test Room (total illum) Reference Room (illum daylight only) Test Room (illum daylight only) Reference Room (power) Test Room (power)
September 3, 2001 Partly Cloudy Reference Room - 0.752 kWh Test Room - 1.036 kWh 0 200 400 600 800 1000 1200 1400 1600 1800 2000 6 AM 7 AM 8 AM 9 AM 10 AM 11 AM 12 PM 1 PM 2 PM 3 PM 4 PM 5 PM 6 PM Illu m in a n c e [L u x ] 0 5 10 15 A u to m a tic b lin d s p o s itio n [V o lt
Desk Reference Room (total illum) Desk Test Room (total illum) Reference Room (illum daylight only) Test Room (illum daylight only) Test Room (blinds position)
September 3, 2001 Partly Cloudy 0 200 400 600 800 1000 1200 1400 1600 1800 2000 6 AM 7 AM 8 AM 9 AM 10 AM 11 AM 12 PM 1 PM 2 PM 3 PM 4 PM 5 PM 6 PM Il lu m inance [ L ux]
Ceiling Reference Room
Ceiling Test Room August 23, 2001Overcast sky
0 200 400 600 800 1000 1200 1400 1600 1800 2000 6 AM 7 AM 8 AM 9 AM 10 AM 11 AM 12 PM 1 PM 2 PM 3 PM 4 PM 5 PM 6 PM Il lu m inance [ L ux] 0 20 40 60 80 100 120 140 160 180 200 Po we r De m a n d [ W ]
Desk Reference Room (total illum) Desk Test Room (total illum) Reference Room (illum daylight only) Test Room (illum daylight only) Reference Room (power) Test Room (power)
August 23, 2001 Overcast sky Reference Room - 1.327 kWh Test Room - 1.508 kWh 0 200 400 600 800 1000 1200 1400 1600 1800 2000 6 AM 7 AM 8 AM 9 AM 10 AM 11 AM 12 PM 1 PM 2 PM 3 PM 4 PM 5 PM 6 PM Il lu m inance [ L ux] 0 5 10 15 A u to m a tic b lin d s p o s itio n [V o lt
Desk Reference Room (total illum) Desk Test Room (total illum) Reference Room (illum daylight only) Test Room (illum daylight only) Test Room (blinds position)
August 23, 2001 Overcast sky
No blinds y = 0.9242x + 99.353 R2 = 0.9835 Jul 28 - Sep30 y = 0.7868x + 438.92 R2 = 0.9328 Dec 19 - Mar 11 y = 0.9823x + 99.88 R2 = 0.9929 0 200 400 600 800 1000 1200 1400 1600 1800 2000 0 200 400 600 800 1000 1200 1400 1600 1800 2000
Lighting Energy Consumption of Reference Room [Wh/day]
Light ing Energy C ons um pt ion of T e s t R oom [ W h/ day ] No blinds
Automatic blinds winter Automatic blinds summer Blinds fully closed CONTINUOUS DIMMING
CLEAR SKY
OVERCAST SKY "Ideal" blinds fully closed
Figure 8 Impact of the photocontrolled automatic venetian blinds on the lighting energy consumption of the continuous dimming control system.