Publisher’s version / Version de l'éditeur:
Vous avez des questions? Nous pouvons vous aider. Pour communiquer directement avec un auteur, consultez la première page de la revue dans laquelle son article a été publié afin de trouver ses coordonnées. Si vous n’arrivez pas à les repérer, communiquez avec nous à PublicationsArchive-ArchivesPublications@nrc-cnrc.gc.ca. Questions? Contact the NRC Publications Archive team at
PublicationsArchive-ArchivesPublications@nrc-cnrc.gc.ca. If you wish to email the authors directly, please see the first page of the publication for their contact information.
https://publications-cnrc.canada.ca/fra/droits
L’accès à ce site Web et l’utilisation de son contenu sont assujettis aux conditions présentées dans le site LISEZ CES CONDITIONS ATTENTIVEMENT AVANT D’UTILISER CE SITE WEB.
Journal of the Electrochemical Society, 151, 8, pp. A1269-A1278, 2004-07-20
READ THESE TERMS AND CONDITIONS CAREFULLY BEFORE USING THIS WEBSITE. https://nrc-publications.canada.ca/eng/copyright
NRC Publications Archive Record / Notice des Archives des publications du CNRC :
https://nrc-publications.canada.ca/eng/view/object/?id=1cda90a1-2d0c-4034-9696-e17ebeeb5b75
https://publications-cnrc.canada.ca/fra/voir/objet/?id=1cda90a1-2d0c-4034-9696-e17ebeeb5b75
Archives des publications du CNRC
This publication could be one of several versions: author’s original, accepted manuscript or the publisher’s version. / La version de cette publication peut être l’une des suivantes : la version prépublication de l’auteur, la version acceptée du manuscrit ou la version de l’éditeur.
For the publisher’s version, please access the DOI link below./ Pour consulter la version de l’éditeur, utilisez le lien DOI ci-dessous.
https://doi.org/10.1149/1.1768545
Access and use of this website and the material on it are subject to the Terms and Conditions set forth at
Dependence of CH
₃OH oxidation activity for a wide range of PtRu
alloys: detailed analysis and new views
Dependence of CH
3OH Oxidation Activity for a Wide Range
of PtRu Alloys
Detailed Analysis and New Views
C. Bock,*
,zB. MacDougall,*
and Y. LePageNational Research Council of Canada, Ottawa, Ontario K1A 0R6, Canada
Unsupported PtRu alloy powders of a wide range of compositions were prepared at low temperatures by carefully adjusting the preparation procedure. PtRu alloys of essentially the same surface, nominal and bulk composition, were formed up to ca. 46 atom % Ru content. Adsorbed CO stripping voltammetry and CH3OH oxidation characteristics, namely, i-V curves and pseudo-steady-state current density values recorded at constant potentials, were the same as reported for corresponding bulk alloys, suggesting that the electrocatalytic activities of the powders can be compared to bulk alloys. CH3OH oxidation activities obtained for PtRu alloy, Pt, and Ru powders showed the PtRu alloy of 70:30 atom % Pt:Ru composition to exhibit the highest activity independent of the temperature and potential tested ~0.3 and 0.4 V vs. a reversible hydrogen electrode!. The experimental pseudo-steady-state current density values for the CH3OH oxidation reaction were found to show the same dependence on Ru content as theoretical values calculated assuming that an assembly of three neighboring Pt and one Ru site are involved in the oxidation of a CH3OH molecule.
© 2004 The Electrochemical Society. @DOI: 10.1149/1.1768545# All rights reserved.
Manuscript submitted October 1, 2003; revised manuscript received February 10, 2004. Available electronically July 20, 2004.
Pt-Ru catalysts are of major interest as anode materials for low-temperature fuel cells such as the direct methanol fuel cell. Platinum catalyzes the methanol adsorption and dehydrogenation reactions, shown in Eq. 1 1 2. As a result, an intermediate ‘‘CO’’-type species is formed that can be oxidized to CO2with the assistance of -OH
type groups that are formed by the partial oxidation of H2O on
neighboring surface sites ~M!, Eq. 3 1 4
Pt 1 CH3OH 5 Pt-~CH3OH!ads @1#
Pt-~ CH3OH!ads5 Pt-~ CO!ads1 4H11 4e2 @2#
M 1 H2O → M-OH 1 H11 1e2 @3#
Pt-~ CO!ads1 M 2 OH → Pt 1 M 1 CO21 H11 1e2 @4#
The -OH formation needs to take place at low potentials in order for a fuel cell to generate high power outputs. Until now, bimetallic Pt-Ru catalysts have exhibited some of the best catalytic activities toward the electrochemical CH3OH oxidation reaction, likely due to
the ability of Ru to form active oxygen species at low potentials.1,2 Equation 4 suggests that the Pt and Ru site distribution at the atomic level influences the CH3OH oxidation activity, as discussed in a
number of studies.3,4Gasteiger et al.3studied the CH3OH oxidation
reaction using well-characterized bulk PtRu alloys prepared by arc-melting. Based on data collected for three different Pt:Ru ratios, they concluded that a Pt:Ru composition of close to 90:10 atom % shows the highest activity for the CH3OH oxidation reaction at room
temperature. Furthermore, the general view exists that an increase in temperature results in a change of the optimal Pt:Ru ratio ~toward higher, namely, 50 atom % Ru, contents!.3,5This change in the op-timal PtRu ratio has been based on an apparent activity of Ru to dehydrogenate CH3OH at higher temperatures ~.60°C!, while Ru
does not show such an activity at room temperature.3These conclu-sions have been questioned by Iwasita et al.5and Kabbabi et al.4 The latter suggested an optimal Ru content of 10-15 atom % inde-pendent of the temperature; however, they reported experimental current density data for the oxidation of CH3OH that were more
than one order of magnitude too high, thus casting some doubt on the validity of their data. Iwasita et al. found very similar CH3OH
oxidation activities at room temperature for Pt:Ru ratios between 90:10 and 70:30 atom %. As pointed out by Iwasita et al.,5 they
mainly used PtRu catalyst systems that consisted of Ru particles/ islands deposited onto Pt surfaces prepared using a variety of meth-ods, i.e., they used catalysts for which the distribution of Ru and Pt sites is less random than for true alloy catalysts. This may explain the independence of the CH3OH oxidation activity on the Pt:Ru
ratio for 10-30 atom % Ru contents. Other studies that involve dif-ferent Pt:Ru ratios exist.2,6Often these studies compare the CH3OH
oxidation activities per catalysts weight or geometrical electrode area and not the true catalytic activity and/or use catalysts for which the bulk and surface composition varies. However, for fundamental and mechanistic studies, the use of catalysts of known and prefer-ably random site distribution, i.e., true alloys, is essential. Indeed, it is difficult to prepare well-defined PtRu alloys for which the bulk and surface composition is known and the same. Typically, this in-volves expensive methods such as sputter deposition, arc-melting followed by surface polishing that leads to bulk metal alloys.3,4,7,8
In this work, the preparation and properties of a range of PtRu alloy powders is discussed for Pt:Ru atomic ratios of up to ca. 45 atom % Ru. PtRu alloy powders that show essentially the same bulk and surface compositions are used to obtain the CH3OH oxidation
activities as a function of the Pt:Ru atomic ratio for a broad potential range. This includes the low-potential region which is relevant to real fuel cell applications and where the -OH formation is believed to be rate determining.9 The use of PtRu powders allows facile preparation of electrodes of easily adjustable and sufficiently high surface areas that permit reliable CH3OH oxidation current
measure-ments to be made, even at low potentials. The influence of tempera-ture on the optimal Pt:Ru atom % for the CH3OH oxidation reaction
is also discussed.
Experimental
Catalyst powder preparation.—A range of Pt, Ru, and PtRu al-loy powders were synthesized using a simple chemical reduction method. The nominal atomic Pt to Ru ratio for the PtRu alloy pow-ders was varied between 91 and 54 atom % Pt, i.e., between 9 and 46 atom % Ru. All powders were prepared at room temperature using NaBH4 ~Anachemia! as reducing agent. RuCl3 ~99.99%
pu-rity, Alfa Aesar! and PtCl4~99.9% purity, Alfa Aesar! were used as
precursor salts. Table I summarizes the amounts of Pt and Ru pre-cursor salts used for the synthesis of the catalyst powders. In all cases, the precursor salts were dissolved in 150 mL H2O and stirred
for 30 min. 75 mL of 0.2 M NaBH4was added dropwise ~within less
than 5 min! to the well-stirred solution for the catalyst powders of less than 30 atom % Ru. For the catalysts made of more Ru, 75 mL
*Electrochemical Society Active Member. zE-mail: christina.bock@nrc-cnrc.gc.ca
Journal of The Electrochemical Society, 151 ~8! A1269-A1278 ~2004!
0013-4651/2004/151~8!/A1269/10/$7.00 © The Electrochemical Society, Inc.
of 0.4 M NaBH4was added within less than 1 min to the precursor
salt solution ~unless otherwise stated!. Solid catalyst powder par-ticles were formed immediately and the precursor salts were trans-formed completely into solid catalyst powders. The trans-formed Pt, PtRu, and Ru catalyst powders were filtered and excessively washed with H2O and subsequently dried in an air oven at 80°C for 30 min unless
otherwise stated. The precursor salts were dried in air at 135°C prior to their use. Pt, Ru, and PtRu alloy powders were prepared using different glassware. All glassware involved in the powder prepara-tion was cleaned using aqua regia prior to its use.
Working electrode preparation.—The catalyst powders were formed into electrodes by sonicating 13 mg of a particular powder dispersed in solutions consisting of 300 mL Nafion solution ~5 wt % Nafion dissolved in lower alcohols, Fluka! and 2 mL H2O for 30
min. Appropriate amounts ~1-20 mL! were pipetted onto ca. 0.25 cm2Au foil electrodes ~99.9% Au, 0.1 mm thick, Goodfellow!
form-ing thin catalyst layers. The electrodes were dried in air at room temperature, cold-pressed for ca. 30 s applying 1 ton, and subse-quently washed excessively with H2O. The Au foils were firmly
attached to Au wire electrodes, and Au not covered with the catalyst powder was carefully wrapped with Teflon tape.
Cells and electrodes.—Three-compartment cells, in which the reference electrode was separated from the working and counter electrode compartment by a Luggin capillary, were employed for the electrochemical studies. The cells were equipped with water jackets and condensers that allowed electrochemical studies under tempera-ture control between 20 and 60°C. All potentials reported in this paper are vs. the reversible hydrogen electrode ~RHE! unless other-wise stated. However, mercury sulfate electrodes ~MSE, 20.68 V
vs.RHE10! were used as reference electrodes in the experiments. Large-surface-area Pt gauzes served as counter electrodes.
Techniques and instrumentation.—Electrochemical experiments were performed using a Solartron SI 1287 electrochemical interface ~Solartron Group, Ltd.! driven by Corrware software ~Scribner Assoc.!. A Scintag XDS2000 system was employed using a Cu Ka source to obtain X-ray diffraction ~XRD! spectra for the as-prepared catalyst powders. The scanning angle extended from 2u of 20 to 120°. The software program Topas 2 (DIFFRACPLUSTopas, Bruker
Axis, Inc.! was employed to extract lattice parameter constants from the experimental XRD spectra. The entire XRD spectra ~20-120°! were employed to analyze the data. Si powder ~typically 1-20 mm, 99.9985% purity, Alfa Aesar! was used as the internal standard for the XRD analyses. The powders were analyzed using a Si~510! plate ~GEM Dugout!. X-ray photoelectron spectroscopy ~XPS! spectra were obtained using a Kratos Axis Ultra spectrometer equipped with a monochromatized Al Ka source. The as-prepared catalyst pow-ders were attached to sticky Cu tape ~3M copper tape, Soquelec,
Montreal! for the XPS analyses. For each catalyst, a survey spec-trum was collected before high-resolution spectra of the C 1s, O 1s, Pt 4f, Ru 3p, and Ru 3d core level regions were collected. Decon-volutions of the XPS spectra were performed using a CasaXPS ver-sion 2.1.34 ~Neal Fairley!. A Shimadzu UV-1201 S UV-visible spec-trophotometer was also used.
CO adsorbed(COads) stripping voltammetry.—CO was adsorbed
onto the Pt-based powder electrodes at 0.15 V by bubbling CO gas ~Matheson purity, Matheson gas! through the 0.5 M H2SO4solution
for 20 min. Solution CO was subsequently removed by argon gas bubbling ~air products! for 40 min, maintaining the potential at 0.15 V. The potential was then cycled at 10 mV s21starting at 0.15 V for
two complete oxidation/reduction cycles.
Solutions.—All CH3OH oxidation studies were carried out using
0.5 M CH3OH 1 0.5 M H2SO4solutions. Prior to the
electrochemi-cal studies, the solutions were deoxygenated using high-purity argon gas. A.C.S. grade chemicals and high resistivity 18 MV water were used.
Results and Discussion
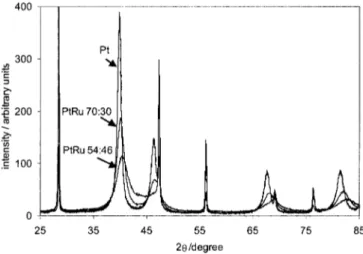
Characterization of the catalyst powders XRD characteri-zation.—XRD spectra were obtained for the as-prepared catalyst powders as well as for the catalyst powders mixed homogeneously with Si powder that served as internal standard. Figure 1 shows typical XRD spectra for Pt, PtRu 70:30 atom %, and PtRu 54:56 atom % catalyst powders that were homogeneously mixed with Si. The main peak of the hexagonal Si is clearly seen at 28.44~29!°.11 The peak position for Pt is seen to shift to more positive 2u values with increasing Ru content. This indicates a decrease in the lattice parameter of the face centered ~fcc! Pt lattice, and hence, an incor-poration of Ru into the Pt lattice. Diffraction peaks for Ru, such as Ru metal or RuO2 phases, were not recognizable in the raw XRD
spectra. Figure 2 shows the dependence of the lattice parameter for fcc Pt (aPt) determined using the Topas 2 program as a function of
the nominal atom % of Ru. Microstrain was taken into consideration and the entire XRD spectra were used for the data-fitting procedure. Particle size and microstrain values estimated using the Topas soft-ware program are shown in Table II. Figure 2 shows that the lattice parameter values obtained from the raw XRD data for the catalyst powders prepared in this work decrease in a linear manner as the atom % of Ru increases, in agreement with Vegard’s law.12Lattice parameter values reported for bulk PtRu alloys7and values obtained
Table I. Amounts of precursor salts used for the powder synthe-sis and Pt:Ru nominal and surface ratios.
PtCl4 ~g!
RuCl3 ~g!
Nominal Pt:Ru ratio
~atom %!a Surface Pt:Ru ratio~atom %!b
1.06 - 100:0 100:0 1.06 0.073 91:9 91:9 1.06 0.115 85:15 84:16 1.06 0.163 80:20 82:18 1.06 0.217 75:25 77:23 1.06 0.28 70:30 70:30 1.06 0.351 65:35 68:32 1.06 0.435 60:40 60:40 1.06 0.555 54:46 55:45 - 1.6 0:100 0:100
aNominal Pt:Ru atom % ratio calculated from the Pt and Ru precursor salts used for the powder preparation.
bSurface Pt:Ru atom % ratio determined from XPS measurements.
Figure 1. Typical XRD spectra for Pt, PtRu 70:30 atom %, and PtRu 54:46 atom % powders. An approximate amount of Si powder was homogeneously mixed into the powders as an internal standard. The XRD spectra were collected using a step size of 0.06° and an accusation time of 20 s. The spectra were collected between 2u’s of 20 and 120°; however, a zoomed-in window of 25-85° is shown in Fig. 1.
from ab initio calculations13are also shown in Fig. 2. Ab initio cell and structure optimizations were performed with VASP13 on the known structure of Pt as well as on hypothetical cubic models for the stoichiometric compositions Pt107Ru, Pt31Ru, Pt26Ru, Pt15Ru,
Pt7Ru, Pt3Ru, and PtRu with resulting symmetries Fm3m, Im3m,
or Pm3m. The cell edge for a hypothetical Fm3m model of Ru was also optimized. Results of the ab initio computed cell edge (aPt) vs.
the atom % Ru content are seen ~Fig. 2! to plot on a straight line with a slope of 20.000133 nm, indicating that these cubic PtRu alloys have a cell edge which follows Vegard’s law. We did not attempt to establish the maximum Ru content of such alloys, but this limit is experimentally known to be about 80 atom %. Hard-sphere considerations based on experimental cell volumes for fcc Pt and hexagonal close packed ~hcp! Ru, and assuming a Vegard law type of behavior of aPtvs.the atom % of Ru, actually give a slope of
20.000137 nm, a result which is in excellent agreement with the quantum results. Ab initio calculations for Pt-Ru systems have been
carried out previously, focusing on the CO and -OH adsorption on Pt and Ru sites,14 as well as calculating the lattice parameters as a function of the Ru content for PtRu alloys.15
It is seen that the lattice parameter values for the powders pre-pared in this work are close to the bulk alloy and ab initio calcula-tion data. This indicates that the Ru content of the alloy is similar to the nominal content for the catalysts prepared in this work. The fitting of the XRD data of the higher Ru atomic composition ~.35 atom %! required the addition of a hexagonal Ru phase. The Ru amount in this phase was, however, very small compared to the alloy, thus suggesting that the majority of the Ru is incorporated into the fcc Pt lattice. Particle sizes estimated from the raw XRD data suggests particle sizes of less than 25 nm ~Table II!. The particle size is seen to decrease with increasing Ru content, consistent with pre-viously reported results.16 It is clear, however, that these unsup-ported and unstabilized catalyst powders consist of larger, agglom-erated particles of ca. 150-200 nm size, as indicated by transmission electron microscopy ~TEM! measurements. Microstrain analyses suggest stress to be considerable ~in the percentage range! for all powders. This is expected for these rapidly synthesized powders.
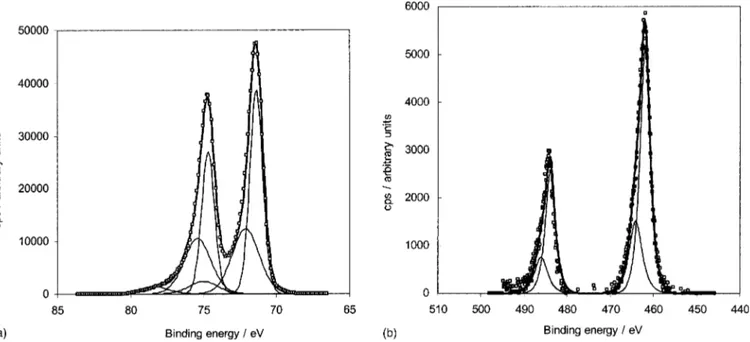
XPS characterization.—The Pt-based powders were analyzed by XPS to obtain the Pt to Ru atomic ratios as well as to identify the oxidation states of the Pt and Ru surface components. The Pt:Ru atomic ratios determined from the Pt 4f and Ru 3p spectra are shown in Table I. The less intensive Ru 3p region was used instead of the main Ru 3d region. The latter overlays with the C 1s peak, thus complicating the deconvolution and interpretation of the Ru 3d spectra. It is seen that for all catalyst powders, the surface atomic ratio is close to the nominal value, thus suggesting that the surface and bulk concentrations of these catalysts are essentially the same. Figures 3a and b show deconvoluted XPS spectra for the Pt 4f and Ru 3p region, respectively, for the PtRu 54:46 atom % catalyst. The position of the C 1s peak, i.e., 284.6 eV, was used to correct the XPS spectra for charging effects that were in the range of 60.1 eV. The deconvolution of the Pt spectra indicates that a significant fraction ~54%! of the Pt is present as Pt metal, indicated by Pt 4f7/2and 5f5/2
peaks at 71.4 and 74.7 eV, respectively, and full widths at half maxi-mum ~fwhm! of 1.05 eV of each peak.1739% of the Pt is suggested to be present as PtO, indicated by Pt 4f7/2and 5f5/2peaks at 72.1 and
75.4 eV, respectively, and fwhm of 2.1 eV.17A small fraction ~ca.
6%! of the Pt is suggested to be present as Pt chlorides, indicated by the Pt 4f7/2 and 5f5/2 peaks at 75 and 78.3 eV, respectively, and
fwhm of 2.3 eV.18The presence of a small amount of Cl2~that is
introduced into the catalyst systems by use of chloride-based pre-cursor salts! was confirmed in the XPS survey spectra. The decon-volution of the Ru 3p spectra suggest 70% of the Ru to be present as Ru metal ~Ru 3p1/2and 3p3/2peaks at 462 and 484 eV, respectively,
fwhm of 2.6 eV18,19! and 30% of the Ru between the metallic and 1IV state, i.e., as lower, reducible Ru oxides ~Ru 3p1/2 and 3p3/2
peaks at 464.1 and 486.1 eV, respectively, fwhm of 3.5 eV18,19!. It is noteworthy that the XPS spectra shown in Fig. 4a and b are quali-tatively representative for the PtRu powders of Pt:Ru atom % ratio of 91:9 to 65:35 atom %, i.e., the catalyst particle surfaces are sug-gested to mainly consist of Pt and Ru metals as well as lower, reducible oxides. Similarly, the XPS data for the Ru powder showed the surface to consist of mainly Ru metal and lower Ru oxides.
COads stripping voltammetry.—COads stripping voltammetry is a
technique that can be used to obtain in situ information of catalyst surfaces under electrochemical conditions.7,20CO adsorbs on metal-lic Pt sites at sufficiently negative potentials and the adsorbed CO ~ca. 0.8-1 monolayer! can be anodically stripped from the Pt surface to form CO2.7In the case of Pt-only catalysts, the COadsstripping
charge (QCOads) can be used to obtain the electroactive Pt surface
area.7,21For example, a charge-to-Pt area conversion factor of 420 mC cm22is used for the case of the adsorption of one CO molecule
per Pt surface site. Figure 4a shows a COads stripping
voltammo-gram for a Pt powder catalyst electrode. The current axis is normal-Figure 2.Pt lattice parameter (aPt) dependence on the nominal atom % of
Ru for fcc Pt. ~l! The data obtained from fitting the experimental XRD spectra for the Pt-based powders prepared in this work. A Si standard was homogeneously dispersed between the powders for the analysis, and the entire slow-scan spectra ~2u between 20 and 120°! were used to calculate the lattice parameter values using the Topas software program. The vertical lines represent the errors of the lattice parameter in the y direction, while the bars are only used to better locate the error lines. The solid line represents the lattice parameter dependence obtained from ab initio calculations,13while
the crosses represent the same, but for previously reported data obtained from experimental XRD spectra for bulk PtRu alloys.7
Table II. Parameters derived from raw XRD dataa for the as-prepared Pt-based catalysts.
Nominal Pt:Ru ratio ~atom %! Particle size ~nm! Microstrain ~%! 100:0 27.5 6 3.4 1.1 6 0.063 91:9 13 6 1.2 2.6 6 0.15 85:15 13.4 6 1.4 1.7 6 0.17 80:20 12.2 6 1.2 1.1 6 0.063 75:25 11.2 6 1.5 1.8 6 0.08 70:30 11.6 6 1.7 2.6 6 0.26 65:35 5.4 6 0.7 2.7 6 0.5 60:40 7.9 6 0.6 2.5 6 0.5 54:46 4.6 6 2.1 2.5 6 0.5
aComplete slow-scan XRD spectra collected between 2us of 20 and
75° were used for the data fitting.
ized by the QCOads value determined for this particular electrode.
The first cycle ~thick line! represents the CO stripping curve, while the second cycle ~thin line! is equivalent to the background CV for this catalyst in 0.5 M H2SO4. For polycrystalline Pt, typical
hydro-gen adsorption/desorption peaks are observed in the background cy-clic voltammetry ~CV!. The experimentally observed QCOadsvalues
were found to be 80% of two times the H desorption charge (QHdes)
for Pt powder electrodes. This suggests that under the conditions used in this work 0.8 of a CO monolayer is adsorbed on the Pt surface sites, i.e., the correct QCOads to Pt surface area conversion
factor is 336 mC cm22 (50.8 3 420 mC cm22). The conversion of
the QCOadsvalues to Pt surface areas in the presence of Ru is more
complicated unless the number of CO molecules that adsorb per Ru and Pt sites is known. In recent work in our laboratory,21it has been shown that activation-controlled (COOH)2 oxidation currents can
be used to obtain electroactive Pt areas even for multicomponent catalysts such as PtRu powders. It has also been shown that the combination of the (COOH)2technique and COads stripping
volta-mmetry can be used to estimate the number of CO molecules that adsorb on Ru and Pt sites.21The QCOadsvalue and the Pt surface area
(APt) estimated using the (COOH)2 oxidation currents are related
using an experimentally determined conversion factor ( fAPt), as
fol-lows
APt5
QCOads
420mCcm22*fAPt @5#
As discussed in previous work, the value of the fAPtfactor
de-pends on the catalyst powder; it is unity for Pt-only powders and less than unity if CO adsorbs on other, e.g., Ru, catalyst sites.21In the case of PtRu alloys, the same ratio of CO molecules per Pt and Ru sites are suggested to adsorb, and the experimentally determined
fAPtfactor is equivalent to the atomic fraction of Pt surface sites. For
example, for a Pt:Ru surface ratio of 85:15 atom %, the fAPtfactor is
0.85; for a Pt:Ru surface ratio of 70:30 atom %, the fAPtfactor is
0.7,21etc. These fAPtfactors and Eq. 5 will be used in this work to
obtain the real catalytic activities for the PtRu catalysts toward the CH3OH oxidation reaction, i.e., to obtain CH3OH oxidation currents
per Pt surface area.
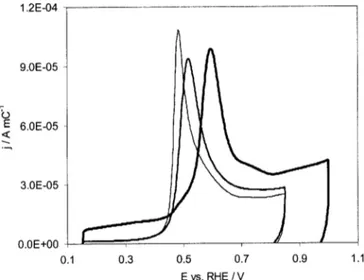
Fig. 4a-d shows typical COads stripping voltamograms for Pt
powder and PtRu powders of 70:30 and 54:46 atom % composition, respectively. The current scales in these CVs are normalized using the corresponding, experimental QCOadsvalues to better compare the
data. As discussed in previous work,21the COadsoxidation potential
can be linked to the PtRu surface concentration for the case of alloys. With an increase in atomic Ru content ~up to ca. 46%!, the COads stripping potential is shifted to more negative values in the
same manner as also seen in our data. The COadsstripping
voltam-mograms observed in this work also show that they can be used to gain some insight into the PtRu alloy catalyst surface within a cer-tain error range @mainly due to variations in the potential measure-ments ~610 mV!#. The shape and characteristics of the entire COads
voltammograms observed in this work for a catalyst powder of a particular composition are in good agreement with literature data for bulk alloys of the corresponding Pt:Ru surface ratio.7,20Therefore, the COads stripping data suggest that the surface composition of
these catalyst powders prepared in this work are the same as the bulk and nominal composition, as also suggested by the XRD and XPS results. Furthermore, the good agreement between the COads
stripping characteristics of the powder and bulk alloys validates the use of these powders to obtain mechanistic CH3OH oxidation
infor-mation. It is also seen that for the Ru powder ~e.g., Fig. 4b Ru powder!, very positive potentials are required to strip the adsorbed CO completely from the catalyst surface and the COads stripping
peaks become broad.
In this work, COadsstripping voltammograms were also recorded
for the catalysts before and after CH3OH oxidation studies. The
COads stripping voltamograms were used to calculate Pt surface
areas and to ensure that the catalyst surfaces are not altered as a result of the CH3OH oxidation experiments.
Catalyst preparation parameters and resulting catalyst properties.—Influence of the NaBH4addition rate on the degree of
PtRu alloy formation.—In this work, the rapid addition of high con-centrations of NaBH4solutions to the Pt and Ru precursor solutions
was found essential to incorporate the Ru into the Pt fcc lattice. The influence of the rate and amount of NaBH4addition is more
pro-nounced for the synthesis of the catalyst powders made of higher Ru ~.30 atom %! ratio. The influence of the NaBH4 addition rate is
Figure 3. XPS spectra for the as-prepared PtRu alloy catalyst of Pt:Ru ratio of 54:46 atom %: ~a! the spectra for the Pt 4f core region and ~b! the Ru 3p core region, ~h! the experimental data, ~ ! convoluted peaks, and ~—! the sum of the deconvoluted peaks.
discussed in this section using Pt:Ru precursor ratios of 54:46 atom %. The slow addition of NaBH4~i.e., the dropwise addition of 75
mL of 0.2 M NaBH4 over a period of 30 min! was found to not
entirely reduce the Ru~1III!-chloride precursor salt, while UV-visible ~UV-vis! spectroscopy did not show detectable amounts of dissolved Pt. These differences can be assigned to different reduc-tion rates of the Ru and Pt precursor salts, i.e., to a faster reducreduc-tion rate of PtCl4than RuCl3.
Values of aPtestimated using raw XRD data recorded for
pow-ders 1 ~slow addition rate, 30 min for the addition of 75 mL of 0.2 M NaBH4) and 2 ~more rapid addition rate, 5 min for the addition of
75 mL of 0.2 M NaBH4) showed that PtRu alloys of less than 46
atom % Ru were formed. aPtvalues of 0.387192 6 3 3 1025 and
0.387102 6 8 3 1025 nm and corresponding Pt:Ru alloy ratios of
ca.62:38 and 61:39 atom % for powders 1 and 2, respectively, were estimated. These aPt values also suggest lower Pt:Ru alloy ratios
than for the rapidly synthesized powder 3. XPS analyses were also carried out for these PtRu catalyst powders of nominal 54:46 atom % ratio. The XPS data suggest Pt:Ru atom % ratios of 12:88 for powder 1, 28:72 for powder 2, and 55:45 for powder 3 ~rapid addi-tion rate and increased NaBH4 amount, less than 1 min for the
addition of 75 mL of 0.4 M NaBH4). These data indicate that Ru is
preferentially located on the catalyst surface for the powders pre-pared using a smaller amount and slower addition rate of the NaBH4
reducing agent, and hence, the catalyst particle composition ~surface
Figure 4.COadsstripping voltammograms recorded at 10 mV s21in 0.5 M H2SO4solutions for ~a! Pt powder, ~b! Ru powder, ~c! PtRu 70:30 atom % alloy,
and ~d! PtRu 54:46 atom % alloy. ~—! The first oxidation cycle, i.e., the anodic stripping of the COads, and ~ ! the second complete oxidation/reduction
cycle, which is equivalent to the background CV of the catalyst powder electrode in 0.5 M H2SO4.
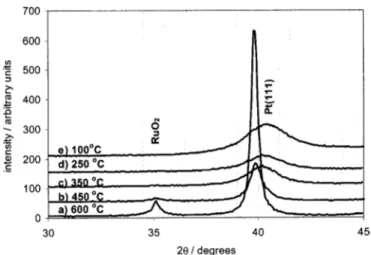
Figure 5. Typical XRD spectra for PtRu 54:46 atom % catalyst powders subjected to heat-treatments for 1 h in an air oven at ~a! 600, ~b! 450, ~c! 350, ~d! 250, and ~e! 100°C. The spectra are corrected using the position of the internal Si powder standard at 28.44°. The XRD spectra were collected using a step size of 0.06° and 40 s accusation time. The spectra were collected between 2u’s of 20 and 60°; however, a zoomed-in window of 30-45° is shown in Fig. 5.
vs.bulk! of the ‘‘more slowly’’ synthesized PtRu powders 1 and 2 is not uniform. XPS analysis for powders of nonuniform conditions such as powders 1 and 2 likely yields only an estimate of the Pt:Ru surface ratio.
Heat-treatment of the prepared catalyst powders.—In this work, care was taken to avoid the exposure of the PtRu catalysts to high temperatures. Treatment at high temperatures of PtRu alloys typi-cally results in Pt segregation on the catalyst surface.22In this sec-tion, the influence of heat-treatment on the prepared catalyst pow-ders is discussed to ensure that suitable catalyst preparation conditions are used. PtRu alloy catalysts of 54:46 atom % compo-sition were heated in air for 1 h at either ~a! 600, ~b! 450, ~c! 350, ~d! 250, or ~e! 100°C. Figure 5 shows an enlarged region of the XRD spectra recorded for the heat-treated catalyst powders. The XRD spectra clearly indicate the formation of a RuO2phase for the
catalysts treated at 600°C. The Pt~111! peak is seen to become nar-rower with increasing temperature, indicating ~an expected! increase
in catalyst particle size. This was confirmed from particle size cal-culations for the full XRD spectra using the Topas software. The 2u position of the Pt~111! peak is seen to shift to smaller values, indi-cating that the amount of Ru in the fcc Pt lattice is smaller, i.e., the Pt:Ru alloy ratio decreases with increasing temperature. This is re-flected more quantitatively in the lattice parameter values estimated for the full spectra shown in Fig. 6. Figure 6 also shows the depen-dence of the atom % of Ru in the fcc Pt phase, calculated from the
aPtlattice parameter and using the theoretical Vegard’s law relation-ship shown in Fig. 2, showing a clear depletion of Ru in the PtRu alloy with increasing temperature. Best fits of the XRD spectra for the powders heat-treated at 350°C and higher temperatures were only obtained using Pt, Ru, and RuO2phases.
Changes in the surface properties of the PtRu catalyst induced Figure 6. Dependence of the lattice parameter of ~1! fcc Pt on the
tempera-ture used to treat a 54:46 atom % PtRu powder catalyst in air for 1 h. ~s! The dependence of atom % Ru in the fcc Pt phase on the temperature. The atom % Ru values were calculated using the lattice parameter values and the theoretical Vegard’s law relationship shown in Fig. 2.
Figure 7. COadsstripping voltammograms for PtRu 54:46 atom % catalyst
powders subjected to different heat-treatments. The first anodic cycle ~after CO adsorption at 0.15 V! is shown. The CVs were recorded at 10 mV s21in
0.5 M H2SO4solutions. ~ ! The COadsstripping voltammogram for the
catalyst powder heated at 100°C, ~—! the same for the catalyst powder heated at 250°C, and ~—! the stripping voltammogram for the catalyst pow-der heated at 600°C. The currents were normalized by the COadscharge to better compare the data.
Figure 8.CVs ~5th cycle! in 0.5 M CH3OH 1 0.5 M H2SO4recorded at 10 mV s21between 0.09 and 0.8 V for Pt powder, PtRu alloy ~54:46 atom %!, and
1 day old Ru powder. The background CV for the Ru powder electrode recorded in the 0.5 M H2SO4(CH3OH-free! solution is also shown. ~a, left! The CVs
by the heat-treatment were also observed by COads voltammetry.
Figure 7 shows the COadsstripping voltammograms ~normalized for
the corresponding COadscharge values! for the PtRu 54:46 atom %
catalysts heated at 100, 250, and 600°C. The COads stripping
vol-tammograms for the catalysts heated at 100°C is essentially the same as for the same catalysts but dried at 80°C ~Fig. 4c!, as well as room temperature, indicating that the catalyst surface is not affected by the 100°C heat-treatment. However, differences in the COads
stripping voltammograms are seen for the catalyst powders heated at 250 and 600°C. Both the COadsoxidation peak and oxidation onset
potential are shifted more positive with increasing temperature. This indicates that the catalyst surface properties are altered by the heat-treatment, resulting in conditions that are less favorable for the COadsoxidation reaction. It is most likely that the Pt: Ru site
distri-bution of the heat-treated catalysts ~250°C and higher! is less ran-dom than for the 100°C and lower temperature-treated catalysts, as suggested by the XRD data that show a decrease in the amount of Ru dissolved in the Pt fcc lattice with increasing temperature.
Activation enthalpies and CH3OH oxidation activities: PtRu
alloys vs. Ru powder electrodes.—In this section the CH3OH
oxi-dation activities as a function of temperature for the PtRu alloys ~of 54:46 and 70:30 atom %! and the freshly synthesized Ru metal powder electrodes were obtained using cyclic voltammetry ~CV!. Figures 8a and b show typical CVs for the CH3OH oxidation
reac-tion for Pt powder, PtRu alloys 54:46 atom %, and Ru powder catalyst electrodes. In all cases, five cycles were sufficient to reach current density-voltage ~i-V! characteristics that were independent of subsequent potential cycling. Therefore, the 5th CV cycles are shown in Fig. 8a and b. All currents were normalized for the Pt 1 Ru surface area estimated using COadsstripping voltammetry, as
discussed previously. Figure 8a shows the CH3OH oxidation
char-acteristics for 20°C, while Fig. 8b shows the situation for 60°C. A background CV for the Ru powder catalyst in 0.5 M H2SO4is also
shown in the two figures for comparison. It is seen that the freshly prepared Ru powder shows a recognizable activity toward the CH3OH oxidation reaction at both 20 and 60°C. However, its
activ-ity is clearly smaller than for the PtRu 54:46 atom % alloy powder. The activity of the Ru powder toward the oxidation of CH3OH
appears high when compared to literature data.3However, a freshly synthesized ~1 day old! Ru catalyst powder was used for the CV data shown in Fig. 8a and b. The activity of the Ru powder toward CH3OH oxidation reaction was observed to decrease with time, e.g.,
a 2 week old powder exhibited only ca. 20% of CH3OH oxidation
activity of the 1 day old powder, while a 6 month old Ru powder showed no activity for the COadsand CH3OH oxidation reactions.
This decay in activity may be due to the oxidation of the Ru surface in air. The mechanism and final product~s! of the CH3OH oxidation
using Ru is not known and may be different than for the Pt and PtRu alloy electrodes.
Figure 9 shows Arrhenius plots, i.e., plots of the logarithm of the CH3OH current density @ln(j)# vs. the inverse of the temperature
(1/T) for two PtRu alloys, i.e., 54:46 ~n! and 70:30 ~h! atom %, as well as for 1 day old Ru powders ~L!. The CH3OH current density
values were extracted from steady-state ~5th! CV data at 0.68 V, i.e., from CV data as shown in Fig. 8a and b. The experimentally ob-served CH3OH oxidation current is seen to increase with increasing
temperature, as expected.3For all tested temperature and potential ranges, the PtRu 70:30 atom % alloy catalyst shows the highest CH3OH oxidation activity, i.e., higher than the PtRu 54:46 atom %
Figure 9. Arrhenius plots, i.e., ln j vs. 1000/T graphs for the CH3OH
oxi-dation reaction using PtRu alloys of ~h! 70:30 atom %, ~n! 54:46 atom %, and ~L! 1 day old Ru powder. The current density data were extracted at 0.68 V vs. RHE from slow-sweep CV data ~see Fig. 8!.
Figure 10. CH3OH oxidation activity dependence on atom % Ru at ~a, left! 0.3 and ~b, right! 0.4 V vs. RHE. ~3! The current density values obtained from i-t
transients after 5 min in 0.5 M CH3OH and 0.5 M H2SO4at 20°C. The current values are normalized by the Pt 1 Ru surface area, as described in the text. ~j!
The theoretical current density values per Pt 1 Ru surface area calculated assuming that CH3OH to CO2oxidation requires three Pt and one adjunct Ru sites,
as discussed in the text and using Eq. 8.
alloy and the Ru powder. These data suggest that the optimal Pt:Ru ratio for the CH3OH oxidation reaction is independent of
tempera-ture ~between 20 and 60°C!, consistent with Kabbabi et al.’s conclusions4and the raw data in Gasteiger et al.’s work.3Activation enthalpy values (DH¯o#) were also extracted from the slope of these Arrhenius plots at a particular potential ~E! employing Eq. 623
slope 5
S
] ln j ]1 TD
E 5 2DH ¯o# R @6#~Note that in the case of measurements in aqueous solutions, the terms activation enthalpy and energy can be used interchangeably.23! In Eq. 6, T is temperature and R the gas constant ~8.314 J K21
mol21 24!. In this work, activation enthalpy values of 30, 33, and
28 6 5 kJ mol21 were obtained at 0.68 V for the 54:46 atom %
alloy, the 70:30 atom % alloy, and the Ru powders, respectively. The activation enthalpy values for the two PtRu alloys are lower than previously reported for similar catalysts that were estimated, how-ever, at lower overpotentials.3In fact, activation enthalpies similar to literature values of ca. 60 kJ mol21were estimated in this work
for the 70:30 and 54:46 atom % PtRu alloys at 0.5 V. The CH3OH
oxidation activity for the Ru powder was too small at lower poten-tials to allow the extraction of the activation enthalpy value. The activation enthalpy values estimated at 0.68 V are similar for the three powders. These data suggest that the activity for the CH3OH
oxidation reaction of the Ru does not increase more strongly with
increasing temperature than for the PtRu alloy electrodes. A signifi-cant contribution of Ru sites toward the CH3OH dehydrogenation
and oxidation reaction in PtRu alloys appears further questionable, as current density values for Ru are clearly lower than for PtRu alloys even at elevated temperatures. It should also be noted that contrary to the case of the Pt and the PtRu alloys, the relationship between the number of CO molecules that adsorb on Ru-only pow-ders and its real Ru surface area is not known and the true Ru surface area may actually be higher. This would result in smaller CH3OH oxidation current density values on the Ru-only powders
than reported here.
CH3OH oxidation currents as a function of Pt:Ru atomic
concentration.—In this section, the influence of the Pt:Ru atomic ratio on the CH3OH oxidation activity is investigated using a wide
range of catalyst compositions. CH3OH oxidation activities were
estimated from current-time ~i-t! transients recorded at 0.3 and 0.4 V after 5 min, i.e., when pseudo-steady-state conditions were achieved. The amount of catalyst powders used for the measure-ments was adjusted depending on the potential range and the PtRu ratio studied. Pt 1 Ru areas of 2-100 cm2were generally used for measurements at 0.3 V, while Pt 1 Ru areas of less than 10 cm2 were used for the measurements at 0.4 V. The use of the higher surface area electrodes at the lower potential allowed for sufficiently high current measurements to achieve good quality data, while use of the lower surface area electrodes at more positive potentials avoided the production of large amounts of H2at the counter
elec-trode. The latter is particularly important as an undivided cell is used in this work. Between the recordings of the individual i-t transients, a cathodic current of 5 3 1025 A was applied until the monitored
electrode potential reached a value of 0.025 V. The application of
the cathodic current was found to result in the complete recovery of the catalyst activity for the CH3OH oxidation reaction.
Figures 10a and b shows the CH3OH oxidation activities at
20°C as a function of the atom % of Ru at 0.3 and 0.4 V, re-spectively. The crosses show the experimentally observed CH3OH
oxidation currents divided by the Pt 1 Ru surface area, while the squares show theoretical curves obtained as described below. The experimental CH3OH current density values for the 65:35 and 54:46
atom % alloy are similar to previously reported values for bulk metal alloys of similar composition and comparable experimental conditions.3This agreement shows that these unsupported catalyst powders can be used for fundamental and reaction mechanistic studies. It is seen that for both potentials the 70:30 atom % com-position yields the highest CH3OH oxidation activity. The 70:30
atom % maximum and the shape of the curves can possibly be explained by considering a simple statistical model that views the alloys as fcc lattice made up of randomly distributed Pt and Ru sites. The CH3OH oxidation reaction is assumed to involve three
neigh-boring Pt sites and one Ru site, while all other sites are assumed not to be notably involved in the CH3OH oxidation reaction.
Electro-static interactions between adsorbed CH3OH molecules that may
lead to a decrease in CH3OH adsorption and possible alloying
ef-fects such as electronic influences of Ru on the Pt sites are ignored in this model. Using this simple model the number of catalyst sites involved in the CH3OH oxidation reaction per total surface sites,
i.e., the theoretical catalyst site utilization percentage ~csu %! can be calculated as a function of the Pt:Ru atom % ratio. The csu % is defined as follows
In Eq. 7, Pt 1 Ru, Pt, and Ru sites are used to calculate Pt 1 Ru, Pt, and Ru csu % numbers, respectively, shown in Table III as a function of the PtRu alloy composition. It is seen that the 70:30 atom % alloy yields the maximum utilization of Pt 1 Ru catalyst sites ~of 92%! consistent with the experimental data. The Pt 1 Ru csu % numbers shown in Table III were further used to calculate theoretical CH3OH oxidation currents (JCH3OH(theoretical)) as a
func-tion of the Pt:Ru atom % to better compare the catalyst site utiliza-tion and the experimental CH3OH oxidation data, as shown in Eq. 8
csu % 5 no. of catalyst sites actively utilized in the CHno. of total catalyst surface sites3 OH oxidation reaction @7#
Table III. Theoretical catalyst utilization percentage „csu %… numbers as a function of the Pt:Ru atomic ratioa
atom % Ru Pt 1 Ru csu %b Pt csu %c Ru csu %d
9 43 43 100 15 56 56 100 20 78 78 100 25 83 83 83 30 92 94 82 35 84 86 83 40 70 83 50 45 57 79 30
acsu % numbers are calculated assuming that an assembly of 3 Pt and 1 adjunct Ru site are the prerequisite for the CH3OH to CO2 oxida-tion reacoxida-tion, as discussed in the text.
b
Pt 1 Ru csu % is the percentage of Pt 1 Ru sites utilized per total Pt 1 Ru surface sites.
cPt csu % is the percentage of Pt sites utilized per Pt surface sites. dRu csu % is the percentage of Ru sites utilized per Ru surface sites.
JCH3OH~ theoretical!5
JCH3OH~ exp .70.30 atom % !
92% *Pt 1 Ru csu % @8# Equation 8 uses the experimental CH3OH oxidation current
for the 70:30 atom % alloy (JCH3OH(exp .70:30 atom %), namely, 4
3 1027 and 6.5 3 1026 A per cm22 Pt 1 Ru area, at 0.3 and 0.4
V, respectively, and the theoretical Pt 1 Ru csu % value of 92% for the 70:30 atom % PtRu alloy to calculate the theoretical CH3OH
current densities shown as squares in Fig. 10a and b. It is seen that the theoretical and experimental CH3OH oxidation current densities
per total Pt 1 Ru surface area are essentially the same ~with a few exceptions that may be due to experimental factors!, thus supporting the rather simple model used here. These results also suggest that CH3OH oxidation current arises mainly from CH3OH molecules
that are adsorbed and oxidized on assemblies consisting of three neighboring Pt and one Ru site, and that one Ru and three Pt sites are involved in the oxidation of a CH3OH molecule within the
po-tential range studied here. Table III also shows the calculated Pt and Ru csu % numbers, i.e., the percentage of Pt sites utilized per Pt sites on the catalyst surface and the percentage of Ru sites utilized per Ru sites on the catalyst surface, respectively. The data suggest that a significant number of Pt surface sites is not involved in the CH3OH to CO2oxidation reaction for the PtRu alloys of lower Ru
composition ~,20 atom % Ru!, while the Ru sites are entirely uti-lized. For the PtRu alloys of 30 atom % and higher values, the utilization of both the Pt and Ru sites decreases with increasing Ru content. However, all the theoretical CH3OH current density and
csu % values calculated in this work reflect trends and the true val-ues may be different, as only a simple model has been used that ignores a number of possibly relevant factors, as mentioned previ-ously.
Table IV shows CH3OH oxidation currents obtained at 20 and
60°C for PtRu alloys of 70:30 and 54:46 atom % PtRu alloy pow-ders. It is seen that the CH3OH oxidation activity is higher for the
70:30 atom % than for the 54:46 atom % alloy independent of tem-perature. In fact, the CH3OH oxidation current increases for both
catalysts by a factor of ca. 9 with an increase in temperature from 20 to 60°C. This increase is consistent with literature data3 and the activation enthalpy values reported in this work.
Conclusions
A wide range of PtRu powders of Pt:Ru ratio up to 54:46 atom % have been synthesized using a simple chemical reduction method involving low temperatures. Pt and Ru powder catalysts were also synthesized using the same method. Lattice parameter estimation for the fcc Pt shows a linear decrease in the lattice parameter value with increasing Ru content. This is in agreement with Vegard’s law and indicates the formation of PtRu alloys. The relationship of the fcc Pt lattice parameter on the nominal atom % of Ru was found to be essentially the same as predicted by ab initio calculations13 and previously reported data for bulk PtRu alloys.3 XPS studies
suggest the Pt:Ru surface ratio to be the same as the nominal Pt:Ru ratio, thus suggesting that PtRu particles of uniform compositions were formed. Furthermore, in situ electrochemical COads stripping
voltammograms recorded for the various Pt, Ru, and PtRu alloy powders were consistent with previously reported voltammograms for bulk PtRu alloys of corresponding Pt:Ru surface ratio, indicating that catalyst powders of similar nominal, bulk, and surface ratios were made. XPS data also suggest the Pt and Ru surface compo-nents to mainly consist of Pt and Ru metal as well as lower, reduc-ible Pt and Ru oxides. It is noteworthy that chemical reduction route synthesis provides a simple and less expensive method for the preparation of PtRu catalysts as compared to arc-melting and chemi-cal vapor deposition techniques. Furthermore, the method described in this work allows the preparation of catalyst powders at low tem-peratures, thus minimizing undesirable segregation of Pt on the cata-lyst surface. Many powders of a wide range of Pt:Ru atomic ratios can be easily prepared at ‘‘low’’ cost and used for detailed studies. Also, catalyst powder electrodes of variable surface areas can be prepared, thus allowing the study of the CH3OH oxidation activity
over a broad potential range, and most importantly, including lower potential ranges that are of interest to real fuel-cell applications.
Activation enthalpy values for the CH3OH oxidation reaction
were extracted for PtRu alloys and Ru powder electrodes over a temperature range of 20-60°C. It was found that freshly prepared Ru powders also exhibit an activity for the CH3OH oxidation reaction
even at low temperatures such as 20°C. However, the CH3OH
oxi-dation activity for the Ru powder is clearly smaller than for PtRu alloys and decays with the age of the Ru powder, eventually becom-ing completely inactive. The activation enthalpy values extracted at 0.68 V were essentially the same for the Ru and the PtRu alloy powders. This indicates that the optimal PtRu alloy composition for the CH3OH oxidation does not change with temperature. This
con-clusion is further supported by CH3OH oxidation activities obtained
from current-time transients at 20 and 60°C for PtRu alloys of 70:30 and 54:46 atom % ratio and is consistent with actual raw data reported in the literature.3
CH3OH oxidation activities were also obtained as a function of
Ru content for the PtRu alloy powders using many PtRu alloy pow-ders of different Pt:Ru ratios at 0.3 and 0.4 V. For all tested poten-tials, the 70:30 atom % PtRu alloy was found to yield the highest CH3OH oxidation activity. Theoretical CH3OH oxidation activities
were calculated as a function of the Pt:Ru ratio using a simple model that assumes that the CH3OH to CO2 oxidation reaction requires
three Pt sites and one neighboring Ru site. The theoretical and ex-perimental data were found to show the same behavior, thus sup-porting the model.
Acknowlegments
The authors thank P. L’Abbe ~National Research Council Canada! for making the electrochemical cells used in this work and G. Pleizier ~National Research Council Canada! for the XPS analyses. Helpful discussions with Dr. E. Gileadi ~Tel-Aviv Univer-sity, Israel! are also greatly appreciated.
The National Research Council of Canada assisted in meeting the publication costs of this article.
References
1. J. O’M. Bockris and H. Wroblowa, J. Electroanal. Chem. Interfacial Electrochem.,
7, 428 ~1964!.
2. M. Watanabe and S. Motoo, J. Electroanal. Chem. Interfacial Electrochem., 60, 267 ~1975!.
3. H. A. Gasteiger, N. Markovic, P. N. Ross, and E. J. Cairns, J. Electrochem. Soc.,
147, 1795 ~1994!.
4. A. Kabbabi, R. Faure, R. Durand, B. Beden, F. Hahn, J.-M. Leger, and C. Lamy, J.
Electroanal. Chem., 444, 41 ~1998!.
5. T. Iwasita, H. Hoster, A. John-Anacker, W. F. Lin, and W. Vielstich, Langmuir, 16, 522 ~2000!.
6. D. Chu and S. Gilman, J. Electrochem. Soc., 143, 1685 ~1996!.
7. H. A. Gasteiger, N. Markovic, P. N. Ross, and E. J. Cairns, Jr., J. Phys. Chem., 98, 617 ~1994!.
Table IV. Average CH3OH oxidation current densities at 20 and 60°C estimated at 0.4 V vs. RHE.a Pt:Ru ratio atom % JCH3OH at 20°C ~A cm22!b JCH3OH at 60°C ~A cm22!b Ratio: JCH3OH~ 60°C! JCH3OH~ 20°C! 70:30 6.4 3 1026 5.8 3 1025 9 54:46 3 3 1026 2.6 3 1025 8.7 aThe CH
3OH activities are estimated from pseudo-steady state i-t tran-sients recorded in 0.5 M CH3OH 1 0.5 M H2SO4 solution, as de-scribed in the text;
b
Current density values are normalized for total Pt 1 Ru surface area.
8. S. F. Huang, Y. Chi, C. S. Liu, A. J. Carty, K. Mast, C. Bock, B. MacDougall, S. M. Peng, and G. H. Lee, Chem. Vap. Deposition, 9, 151 ~2003!.
9. B. Gurau, R. Viswanathan, R. Liu, T. J. Lafrenz, K. L. Ley, E. S. Smotkin, E. Reddington, A. Sapienza, B. C. Chan, T. E. Mallouk, and S. Sarangapani, J. Phys.
Chem. B, 102, 9997 ~1998!.
10. A. J. Bard and L. R. Faulkner, Electrochemical Methods, Fundamentals and
Ap-plications, John Wiley & Sons, Inc., New York ~1980!.
11. X-Ray diffraction database, Diffraction Management System for Windows NT, Scintag, Inc., Cupertino, CA ~1997!.
12. B. E. Warren, X-Ray Diffraction, Dover Publications, New York ~1990!. 13. Y. Le Page, Unpublished results.
14. M. T. M. Koper, T. E. Shubina, and R. A. van Santen, J. Phys. Chem. B, 106, 686 ~2002!.
15. Q. Ge, S. Desai, M. Neurock, and K. Kourtakis, J. Phys. Chem. B, 105, 9533 ~2001!.
16. E. Antolini, L. Giorgi, F. Cardellini, and E. Passalacqua, J. Solid State
Electro-chem., 5, 131 ~2001!.
17. G. M. Bancroft, I. Adams, L. L. Coatsworth, C. D. Bennewitz, J. D. Brown, and W. D. Westwood, Anal. Chem., 47, 586 ~1975!.
18. C. D. Wagner, Handbook of X-Ray Photoelectron Spectroscopy, Perkin-Elmer Corporation, Physical Electronics Division, Eden Prairie, MN ~1979!.
19. A. S. Arico, P. Creti, P. L. Antonucci, J. Cho, H. Kim, and V. Antonucci,
Electro-chim. Acta, 43, 3719 ~1998!.
20. H. N. Dinh, X. Ren, F. H. Garzon, P. Zelenay, and S. Gottesfeld, J. Electroanal.
Chem., 491, 222 ~2000!.
21. C. Bock and B. MacDougall, J. Electrochem. Soc., 150, E377 ~2003!.
22. P. Ross, in Electrocatalysis, J. Lipkoswki and P. R. Ross, Editors, Wiley-VCH, Inc., New York ~1998!.
23. E. Gileadi, Electrode Kinetics for Chemists, Chemical Engineers, and Material
Scientists, VCH Publishers, Inc., New York ~1993!.
24. H. Kuchling, Physik, Formeln und Gesetze, Buch- and Zeit-Verlagsgesellschaft mbH Koeln ~1982!.