Publisher’s version / Version de l'éditeur:
ASHRAE Transactions, 107, 1, pp. 1-11, 2001-02-01
READ THESE TERMS AND CONDITIONS CAREFULLY BEFORE USING THIS WEBSITE. https://nrc-publications.canada.ca/eng/copyright
Vous avez des questions? Nous pouvons vous aider. Pour communiquer directement avec un auteur, consultez la
première page de la revue dans laquelle son article a été publié afin de trouver ses coordonnées. Si vous n’arrivez pas à les repérer, communiquez avec nous à PublicationsArchive-ArchivesPublications@nrc-cnrc.gc.ca.
Questions? Contact the NRC Publications Archive team at
PublicationsArchive-ArchivesPublications@nrc-cnrc.gc.ca. If you wish to email the authors directly, please see the first page of the publication for their contact information.
NRC Publications Archive
Archives des publications du CNRC
This publication could be one of several versions: author’s original, accepted manuscript or the publisher’s version. / La version de cette publication peut être l’une des suivantes : la version prépublication de l’auteur, la version acceptée du manuscrit ou la version de l’éditeur.
Access and use of this website and the material on it are subject to the Terms and Conditions set forth at
Effects of airflow on VOC emissions from "wet" coating materials:
experimental measurements and numerical simulation
Yang, X.; Chen, Q.; Zeng, J.; Zhang, J. S.; Nong, G.; Shaw, C. Y.
https://publications-cnrc.canada.ca/fra/droits
L’accès à ce site Web et l’utilisation de son contenu sont assujettis aux conditions présentées dans le site
LISEZ CES CONDITIONS ATTENTIVEMENT AVANT D’UTILISER CE SITE WEB.
NRC Publications Record / Notice d'Archives des publications de CNRC:
https://nrc-publications.canada.ca/eng/view/object/?id=7157e2ec-e291-4a99-9c20-49f7f56bfd59 https://publications-cnrc.canada.ca/fra/voir/objet/?id=7157e2ec-e291-4a99-9c20-49f7f56bfd59
Effects of airflow on VOC emissions from "wet"
coating materials: experimental measurements and
numerical simulation
Yang, X.; Chen, Q.; Zeng, J.; Zhang, J.S.; Nong,
G.; Shaw, C.Y.
A version of this document is published in / Une version de ce document se trouve dans : ASHRAE Transactions, v. 107, pt. 1, 2001, pp. 1-11
www.nrc.ca/irc/ircpubs
NRCC-43119
THIS PREPRINT IS FOR DISCUSSION PURPOSES ONLY, FOR INCLUSION IN ASHRAE TRANSACTIONS 2001, V. 107, Pt. 1. Not to be reprinted in whole or in part without written permission of the American Society of Heating, Refrigerating and Air-Conditioning Engineers, Inc., 1791 Tullie Circle, NE, Atlanta, GA 30329. Opinions, findings, conclusions, or recommendations expressed in this paper are those of the author(s) and do not necessarily reflect the views of ASHRAE. Written questions and comments regarding this paper should be received at ASHRAE no later than February 9, 2001.
ABSTRACT
The impact of airflow on volatile organic compound (VOC) emissions from “wet” materials has long been noticed. However, a comprehensive mass transfer model that can predict such an impact has not been reported. The objective of this research was to fill that gap. First, we measured the VOC emissions of “wet” coating materials (a decane and a wood stain) using a small-scale (0.4 m3) and a full-scale (55 m3) environmental chamber under different airflow conditions. A numerical model was then developed to numerically simulate the “wet” material emissions. The model considers VOC mass transfer in the air and material-air interface, diffusion in the material film, and diffusion in the substrate. The results from experimental measurements indicate that local airflow has impacts on “wet” material emissions, especially during the early stage. The numerical model developed can predict emis-sions under different flow conditions with reasonable accu-racy. Numerical simulations have further confirmed that the emissions from “wet” materials applied to an absorptive substrate are dominated by evaporation at the beginning and internal diffusion afterwards, which had been speculated based on previous experimental data. The numerical model has the potential to simulate “wet” material emissions in actual building environments based solely on the small-scale chamber data.
INTRODUCTION
The impact of local airflow (velocity and turbulence) on volatile organic compound (VOC) emissions from “wet” coat-ing materials has long been noticed and discussed by several researchers (e.g., Zhang et al. 1996a; Haghighat et al. 1994; Sparks et al. 1996; Haghighat and De Bellis 1998).
Under-standing such an impact allows the scale-up of the emission data measured in an inexpensive small-scale chamber to build-ings. The difference of airflow between a small-scale chamber and a building is obvious. A small-scale chamber usually has simple flow boundary conditions and laminar flow patterns, while conditions in a building (e.g., uncontrolled turbulent flow) can be more complicated and significantly different from the test conditions. Two main approaches are available for investigating the impact of airflow on material emissions: experimental measurements and computer simulations.
The experimental approach uses environmental test chambers to measure VOC emissions under controlled indoor conditions (ASTM 1990). Previous experimental studies have indicated that the emission process of a “wet” material appears to have three phases (Zhang et al. 1999). The first phase corre-sponds to a period shortly after the material is applied but still relatively wet. It appears that VOC emissions are related to evaporation at the surface of the material. In the second phase, the material dries down. The emissions transit from an evap-oration-dominant phase to an internal-diffusion controlled one. Then, in the third phase, the material becomes relatively dry and the VOC off-gassing rate becomes small. The domi-nant emission mechanism in this phase is believed to be the internal diffusion of VOCs through the substrate surface (e.g., Chang and Guo 1992; Wilkes et al. 1996; Zhang et al. 1996a). Further, Chang et al. (1997) and Zeng et al. (1999) both found that the substrates can significantly affect the emission rates and patterns of “wet” coating materials. Hence, the emissions of “wet” materials are likely to depend on many factors, including environmental conditions (temperature, air velocity, turbulence, humidity), properties of the material itself, and the substrate.
Effects of Airflow on VOC Emissions from
“Wet” Coating Materials: Experimental
Measurements and Numerical Simulation
Xudong Yang, Ph.D.
Qingyan Chen, Ph.D.
Jie Zeng, Ph.D.
Member ASHRAE Member ASHRAE
Jianshun Zhang, Ph.D.
Gang Nong
Chia-Yu Shaw, Ph.D., P.E.
Member ASHRAE Member ASHRAE
Xudong Yang is an assistant professor in the Department of Civil, Architectural, and Environmental Engineering at the University of Miami,
Coral Gables, Fl. Qingyan Chen is an associate professor in the Building Technology Program, Massachusetts Institute of Technology, Cambridge, Mass. Jianshun Zhang is an associate professor in the Department of Mechanical, Aerospace, and Manufacturing Engineering at Syracuse University, Syracuse, N.Y. Jie Zeng is a postdoctoral fellow, Gang Nong is a technical officer, and Chia-Yu Shaw is a senior research officer in the Indoor Environment Program, Institute for Research in Construction, National Research Council of Canada, Ottawa.
Since the emission characteristics of wet materials are affected by many external and internal factors, emission data from environmental chambers may not be used directly for buildings. It would also be too difficult to investigate the emis-sions under actual building conditions by experiments. A feasible way would be to develop computer models to simu-late the emission processes and interpret the data from inex-pensive small-scale chamber tests for applications in buildings.
Currently, there is a lack of a complete emission model that considers both the internal diffusion and the interaction between the material and its environment. Much progress has been made in developing mass transfer models for the oration period. Guo and Tichenor (1992) developed an evap-orative mass transfer model, the vapor pressure and boundary layer (VB) model for VOC emissions from interior architec-tural coatings. The VB model has been widely used for simu-lating the early stage emissions of “wet” materials. However, it may not apply to the entire emission process as the model neglects the internal diffusion in the materials film and the effect of substrate. Further, the VB model requires the gas phase mass transfer coefficient as an input. Gas phase mass transfer coefficient is usually determined by the flow field, such as air velocity, flow direction, and turbulence. Sparks et al. (1996) developed a correlation of the gas phase mass trans-fer coefficient with the flow Reynolds number (Re) and the VOC Schmidt number (Sc). However, the correlation may not be applicable to buildings in which the flow conditions usually cannot be represented by a single Reynolds number. Yang et al. (1997, 1998a) and Topp et al. (1997) numerically simulated the dynamic mass transfer coefficient under a small or full-scale environmental chamber. Despite such progress, not much work has been done on the material side. Limited work other than the VB model either assumes a constant surface concentration (Topp et al. 1997) or uses curve fitting to obtain the time-dependent surface concentration from the measured chamber concentration data (Yang et al. 1998a). These models are either not accurate or not practical in simulating the emis-sion process.
The objective of this research was to quantitatively study the effects of an important environmental factor— airflow on VOC emissions from “wet” coating materials. First, we conducted experiments using a 0.4 m3 test chamber and a 55 m3 full-scale chamber that simulates a real room. The data were further used to develop and validate a numeri-cal model. This numerinumeri-cal model applies to the entire emis-sion phases of “wet” materials. The use of this model requires the thermodynamic properties of compounds or materials. These properties can be inferred from inexpensive headspace analysis and small-scale chamber data. Hence, the model has the potential to simulate “wet” material emissions in actual building environments based solely on the small-scale chamber data.
EXPERIMENT
The purpose of our experiments to measure material emissions was two-fold: (1) to investigate the effects of air velocity, turbulence, and chamber scale on emission charac-teristics of “wet” materials directly and (2) to provide emis-sion data for developing and validating material emisemis-sion models.
Testing Materials
Two “wet” coating materials, a commercial oil-based wood stain and a single compound (decane), were tested for emissions. Wood stain is a common architectural coating material with well-known emissions characteristics (Chang and Guo 1992; Sparks et al. 1996; Yang et al. 1998a; Zhang et al. 1999), although different wood stains may have different compositions and exhibit different emission characteristics. A headspace analysis was conducted on the wood stain to deter-mine the compounds emitted. In this procedure, a sample of wood stain was placed in a small airtight glass container. Samples of the air inside the container (i.e., headspace) were then analyzed by gas chromatography and mass spectrometry (GC/MS). The headspace analysis indicated that the wood stain contains five major compounds: nonane, decane, unde-cane, dodeunde-cane, and octane. The single compound decane was also tested in that its emission characteristics can be compared with those of the wood stain as reference data. To test material emissions under a real scenario, the materials were applied on an oak substrate of 0.06 m2 (0.24 m × 0.25 m).
Testing Facility
In order to generate different types of airflow patterns, both a small-scale and a full-scale environmental chamber were used. The small-scale chamber (Zhang et al. 1996a) consists of an inner and an outer chamber, both made of stain-less steel (Figure 1). The outer chamber is 1.0 m long × 0.8 m wide × 0.5 m high (0.4 m3). The material was placed in the inner chamber, where the local velocity was controlled by a stainless tube-axial fan.
The full-scale chamber (Zhang et al. 1996b) is 5 m long
× 4 m wide × 2.75 m high (55 m3), as shown in Figure 2. A square air diffuser was located at the center of the ceiling and an exhaust opening was at the corner of the ceiling. The air supply from the diffuser flowed along the ceiling and then mixed with the chamber air. The test sample was placed 1.0 m from one side wall at the central section of the chamber (Figure 2), as the airflow there was expected to be parallel to the substrate and not affected by the side wall.
An electronic balance was used to monitor the weight loss due to the VOC emissions from the testing materials (Zhang et al. 1999). In order to confirm the results from the balance, the total VOC (TVOC) concentrations at the small-scale chamber’s exhaust outlet were also measured by using direct sampling and analysis with a flame ionization detector (FID) as well as tube sampling and GC/FID analysis. The
concen-AT-01-13-2 3 trations of individual compounds (nonane, decane, undecane,
dodecane, and octane) were also obtained from the GC/FID analysis. The TVOC concentrations in the full-scale chamber were measured using both a gas monitor and GC/FID.
Testing Conditions and Cases
In conducting the experiments, different airflow patterns were achieved directly by using different chambers as well as by changing the ventilation rates in the full-scale chamber. A total of six cases were tested, as listed in Table 1. For the small-scale chamber cases, the maximum air velocity above the material in the inner chamber was controlled to be around 0.15 m/s and the air exchange rate in the whole chamber was 1.0 ACH (air change per hour). The full-scale chamber was oper-ated at three different air exchange rates, i.e., 1 ACH, 5 ACH,
and 9 ACH, to represent several situations in actual buildings. Other test conditions can be found in Table 1.
MODEL DEVELOPMENT
VOC emission from a “wet” coating material is the result of interactions among the coating material, the substrate, and the environment (air phase). The emission model is developed based on the simplified physical system, as illustrated in Figure 3. The figure shows a “wet” coating material applied onto a porous, absorptive substrate. Since the amount of coat-ing material applied is small, the material may be quickly absorbed by the porous substrate, and a wet layer with a uniform initial VOC concentration could be formed inside the substrate. The upper boundary of the wet layer is exposed to ambient airflow and the lower boundary is the substrate initially unaffected by the wet film. During the drying process, the main VOC emission mechanisms are the diffusion of the VOC molecules through the film layer and evaporation of the VOCs from the film surface. In addition, the VOCs can also diffuse to or from the substrate through the film-substrate
Figure 1 The small-scale chamber for emission
measurements.
Figure 2 Schematic of the full-scale chamber for emission measurements. TABLE 1 Testing Cases Case No. Emission material Initial mass applied (g) Environmental conditions Chamber size
Air exchange rate (ACH)
Temperature (°C)
Relative humidity (%)
Case 1-1a Decane 4.3710 Small-scale
(1.0 m × 0.8 m × 0.5 m = 0.4 m3) 1 23.5 ± 0.5 50 ± 2 Case 1-1b Wood stain 4.5083
Case 2-1b Wood stain 4.5270
Full-scale
(5.0 m × 4.0 m × 2.75 m = 55 m3)
1
23.5 ± 0.5 50 ± 2 Case 2-2a Decane 4.7660
5 Case 2-2b Wood stain 4.1860
interface (sorption of VOCs by the substrate). Further, we assume the following:
1. Both the material film and substrate can be treated, from a macroscopic point of view, as homogeneous. Hence, it is possible to define an effective VOC mass diffusivity (including TVOC).
2. During the emission process, VOCs in the material film and the VOC vapor pressure are in thermodynamic equilibrium at the material-air interface. The VOC off-gassing only occurs at the material-air interface.
3. Fick’s law applies for VOC mass transfer.
4. Heat generation/release associated with the emissions is negligible.
5. The VOCs are passive contaminants and have no impact on airflow.
Based on the above assumptions, VOC emissions from a “wet” material are governed by mass transfer in four different layers: the material film, the substrate, the material-air inter-face, and the air phase (Figure 3). The governing equations are discussed below.
Material Film
The three-dimensional VOC diffusion in the material film is governed by Fick’s law:
(1) where
Cm = VOC concentration in the material film, mg/m3
τ = time, s
xj = coordinates (j = 1,2,3)
Dm = effective diffusion coefficient in the material film, m2/s
The Dm is a function of the pore structure, the material type, compound properties, temperature, as well as VOC concentrations. For a given compound, substrate, and temper-ature, the dependence of Dm on VOC concentration is assumed to follow a third-power empirical equation:
(2) where
Dm,0 = initial diffusion coefficient in the material film, m2/s
Cm,0 = initial VOC concentration in the material film, mg/m3 Equation 2 was taken after a similar study of the depen-dence of moisture transfer on moisture content in a hygro-scopic material (Chen and Pei 1989). Note the equation may not apply for a very small Cm/Cm,0 (when material film is totally dry) in that it will lead to an infinitely small Dm as
Cm/Cm,0 approaches 0. The VOC diffusivity in a dry film needs to be measured directly or estimated with long-term (e.g., several weeks or months) experimental data. This is
beyond the scope of this paper. As an approximation, the VOC diffusion coefficient in the substrate (see below) can be used as an asymptote of Dm at low concentrations.
Substrate
Theoretically, Equation 1 also applies to the VOC diffu-sion in the substrate. However, since both the VOC concen-tration and diffusion coefficient in a substrate are small, the process can be simplified by neglecting the dependence of the diffusion coefficient on VOC concentration (Schwope et al. 1989) and assuming a one-dimensional diffusion in the substrate. The latter simplification allows the use of a sorption model (Yang and Chen 1999; Yang 1999) to analytically solve the VOC mass transfer rate at the material film-substrate inter-face. In this way, no numerical grid in the substrate is needed.
Material-Air Interface
At the material-air interface, VOC concentration changes from liquid or solid phase concentration on the material side,
Cm (mg/m3), to the gas phase concentration on the air side, Ca (mg/m3). At equilibrium, the VOC concentrations in the two phases, in the simplest form, follow Henry’s law:
Ca = KmaCm (3) where Kma is the dimensionless material-air partition coeffi-cient. It is a material property and can be obtained from phys-ical data or by static headspace analysis (to be discussed later).
Air
The VOC transport in the air is determined by diffusion through the boundary layer at the material-air interface. Hence, a complete set of room airflow and VOC transport equations in the air phase are needed in order to fully describe the VOC transport in the air. For an isothermal, incompress-ible, Newtonian flow, the conservation equations for continu-ity, momentum, and VOC species are as follows:
∂Cm ∂τ --- ∂ ∂xj --- Dm∂Cm ∂xj --- = Dm Dm 0, Cm Cm 0, --- 3 =
Figure 3 Physical configuration of VOC emission
mechanisms for a “wet” material applied onto an absorptive substrate. 1: boundary layer diffusion; 2: phase change; 3: in-film diffusion; 4: in-substrate diffusion.
AT-01-13-2 5
Continuity
(4)
Momentum (isothermal flow)
(i = 1,2,3) (5)
Air phase VOC species
(6)
where, in Equations 4-6,
uj = three components of air velocity (j = 1,2,3)
µ = molecular viscosity of air, Pa·s
ρ = air density, kg/m3
P = air pressure, Pa
Ca = air phase VOC concentration, mg/m3
Da = VOC diffusion coefficient in the air, m2/s
S = VOC source term, mg/m3s; S = 0 if no additional sources or sinks
For laminar flow (e.g., flow in the small-scale chamber), the above continuity and momentum equations are solved numerically to obtain the distributions of air velocity. However, the airflow in a typical ventilated room (e.g., the full-scale chamber) is turbulent. In such a case, we also need a suitable turbulence model so that we can simulate the airflow and VOC transport using a personal computer. Chen (1995, 1996) calculated the various indoor flows with eight different turbulence models. His study concluded that the renormaliza-tion group (RNG) k-ε model (Yakhot et al. 1992) is the best among the eddy-viscosity models tested. This study has used the RNG k-ε model for the airflow simulation.
Boundary Conditions
Appropriate boundary conditions for velocities and VOC species are needed in order to close the governing equations. The velocity boundary conditions, including inlet, outlet, and walls, are given by Yang et al. (1998a, 1998b) and Yuan et al. (1999). For the full-scale chamber, the inlet velocity was not uniform. The velocity distribution was measured by a portable velocimeter and the measured data were then used as the boundary condition for the flow simulation. Figure 4 gives the measured inlet boundary condition for the case ACH = 5. The thickness of the inlet slot was adjusted as 0.00875 m, 0.015 m, and 0.025 m for ACH = 1, 5, and 9, respectively.
The boundary conditions for VOCs are as follows:
Ca,inlet = 0 at the air inlet (7)
at the material-air interface (8)
at the film-substrate interface (9)
Cm = Cms at the film-substrate interface (10)
Cm, y = Lm = 0 at the other side of the substrate (11) The RNG k-ε model uses wall functions for the near-wall region. The wall function for VOC near the substrate is obtained by using the heat and mass transfer analogy:
Ca+ = Scy+ for y+≤ 11.5 (12a)
Ca+ = for y+ > 11.5 (12b) where Ca+ = y+ = uτ = u+ = and
Ca,int = air phase VOC concentration at material-air interface, mg/m3
qint = VOC mass transfer rate at material-air interface, mg/m3s
y = distance between the first grid node and the wall, m
u = velocity parallel to the wall at the first grid node, m/s
τw = wall shear stress, kg/ms2
Sct = turbulent Schmidt number of VOC (1.0).
∂ ∂xj --- u( )j = 0 ∂ ∂τ --- u( )i ∂ ∂xj --- u( jui) + ∂ ∂xj --- µ ρ ---∂ui ∂xj --- 1 ρ ---∂p ∂xi ---– = ∂ ∂τ --- C( )a ∂ ∂xj --- u( jCa) + ∂ ∂xj --- Da∂Ca ∂xj --- +S
= Figure 4 Measured inlet flow boundary condition in the
full-scale chamber with 5 ACH.
D – m∂Cm ∂y --- –Da∂Ca ∂y ---= D – m∂Cm ∂y --- –Dms∂Cms ∂y ---= Sct u+ 9 Sc Sct ---–1 Sct Sc --- 1 4⁄ + Ca int, –Ca ( )uτ qint ---yuτρ µ ---τw ρ ---u uτ
---Numerical Method
Since VOC emission has a negligible impact on airflow, the numerical simulation of the above equations was conducted in two separate steps. First, a commercial compu-tational fluid dynamics (CFD) program (CHAM 1996) was used to simulate the airflow and obtain the steady-state distri-butions of air velocity and turbulent intensity. The flow results were then incorporated into the VOC mass-transfer equations for simulating emissions. This procedure involved the coupling between air region, interface, material film, and substrate (sorption model). Details of the procedure are given in Yang (1999).
The above mathematical model is based solely on the mass transfer mechanisms during each phase. Theoretically, the model can predict VOC emissions, provided that the phys-ical properties of the compounds and substrate are given. Although the properties, such as the material-air partition coefficient, can be experimentally measured, others, such as the effective diffusivities in the material film and substrate, are more difficult to obtain accurately. Recently, Bodalal et al. (1999) developed an experimental method to measure VOC diffusivity in several solid materials. However, the diffusivity for “wet” coating materials and oak wood substrate are not yet available. In this study, we obtained the VOC diffusivities in the material film and the substrate by fitting the simulated VOC emission rates with the small-scale chamber data. With the material diffusivities, the model can then be used to simu-late emissions in a room without further adjustment. In this paper, the experimental data measured in the full-scale cham-ber were used to validate the emission model developed.
RESULTS
Characteristics of Flow Fields
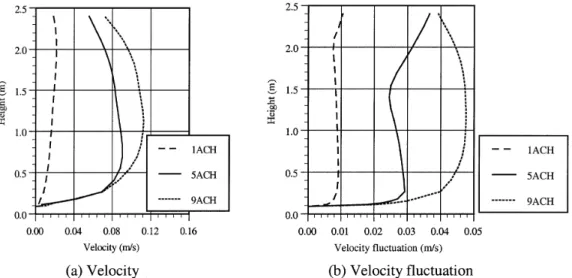
Figure 5 shows the simulated velocity distribution above the material in the inner chamber of the small-scale chamber and Figure 6 shows the simulated distributions of velocity and
velocity fluctuation above the material in the full-scale cham-ber (1, 5, 9 ACH). The velocity fluctuation was defined as
, where k is the kinetic energy of turbulence.
The above results indicate that in the full-scale chamber, a larger ventilation rate created larger local velocity and larger turbulence distributions around the testing material. The small-scale chamber had similar maximum velocity as the full-scale chamber with 9 ACH but with different turbulence level, i.e., laminar flow in the small-scale chamber but turbu-lent flow in the full-scale chamber.
Because the local flow characteristics in the small-scale chamber and in the full-scale chamber (with different ventila-tion rates) were different, it was expected that the emission rates under these flow conditions would also be different. The following sections present the results of VOC emissions by both experimental measurements and numerical simulations.
2k 3⁄
Figure 5 Simulated velocity distribution by CFD above the material in the inner chamber of the small-scale chamber, h = 0.08 m (inner chamber height).
AT-01-13-2 7
Experimental Results of VOC Emission Rate
Emission Rates Obtained from the Electronic Balance. For the “wet” materials tested, the weight loss was entirely due to the VOC emissions from the emission source. The emission rates can thus be obtained from the measured weight data.
The following exponential-power equation (Zeng et al. 1999) was used to fit the weight data:
W(τ) = aexp(–bτ) + c(τ + d)f + g (13) where
W(τ) = weight of the “wet” material remaining in the substrate, g
a, b, c, d, f = constants determined by least squares regression
analysis
g = weight of non-VOC content, g
In Equation 13 g = 0 for decane and g = 15.6% of the initial mass of wood stain applied (estimated by using the weight loss of wood stain applied on a glass plate over a period of 96 hours). The TVOC emission rate can then be calculated by
E(τ) = –d[W(τ)]/dτ = abexp(–bτ) – cf(τ + d)f – 1. (14)
The regression results of a, b, c, d, and f for the test cases are summarized in Table 2.
Effects of Airflow on Emission Characteristics. Figure 7 compares the TVOC emission rates of wood stain in the small-scale and the full-scale chamber. Cases 2-1b, 2-2b, and 2-3b were conducted in the full-scale chamber with air exchange rates of 1 ACH, 5 ACH, and 9 ACH, respectively. In the initial period (0-0.2 h), when emission was mostly controlled by surface evaporation, emission rates for cases with larger velocity and turbulence (e.g., case 2-3b) were higher than those with smaller velocity and turbulence. The flow field with larger velocity and turbulence generated a larger mass transfer coefficient and resulted in a larger initial emission rate. Note both case 2-2b and case 2-3b had higher initial emission rates than case 1-1b. This may be particularly attributed to the effects of turbulence on the boundary layer mass transfer. Cases 2-2b and 2-3b had a slightly smaller local velocity than case 1-1b, but the flow was turbulent for cases 2-2b and 2-3b while laminar for case 1-1b. On the other hand, the initial emission rates of case 1-1b were larger than those of case 2-1b. This is because the local air velocity of the former case (0.15 m/s) was much higher than that of the latter one (<0.03 m/s), although the flow was turbulent for the latter case.
Figure 7 Measured TVOC emission rates of wood stain in different chambers.
TABLE 2
Regression Data for W(τ) Using Exponential-Power Equation
Case No. a b c d f g Regression coefficient R2
Case 1-1a 2.8734 0.9279 39.6164 12.6941 -1.2655 0.0 0.9994 Case 1-1b 1.2904 1.9768 3.2826 1.9266 -0.4200 0.7028 0.9999 Case 2-1b 1.4434 1.7273 2.9565 1.9276 -0.2108 0.7057 0.9992 Case 2-2a 3.2428 1.1942 2.3068 2.7613 -0.3132 0.0 0.9989 Case 2-2b 0.8024 2.1436 2.1424 0.1595 -0.1173 0.6525 0.9965 Case 2-3b 2.0753 0.0013 1.0190 0.2465 -0.5469 0.7709 0.9921
In the second period (0.2-6 h), it became unclear which case had a higher emission rate. The general trend was that the emission rates of the cases with larger initial emission rates decayed faster. In the third period (from 6 h), the cases that emitted faster initially (e.g., case 2-3b) had smaller emission rates. This could be explained by two factors. First, as more and more VOCs were off-gassed, emissions changed from evaporation dominant to internal diffusion dominant. There-fore, the impact of local airflow became less important. Secondly, the “wet” films for cases with higher initial emis-sion rates also dried faster at the material surface. So the surface concentration became smaller at a later time. Also, the dried film could add more resistance to the VOC diffusion at a later emission phase. Therefore, emissions during the second and third period were likely to be affected by combined factors.
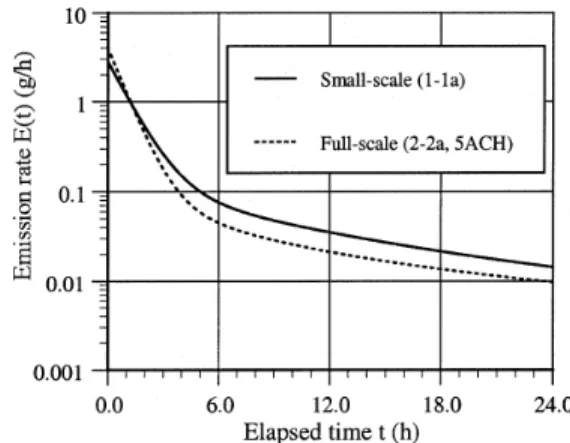
Similar phenomena also occurred to decane. Figure 8 shows the emission rates of decane in the small-scale (case 1-1a) and the full-scale chamber (case 2-2a). The initial emission rate was 2.82 g/h in the small-scale chamber, and 4.06 g/h in the full-scale chamber. From 0-1.2 h, the emis-sion rates in the full-scale chamber were larger than those in the small-scale one. After then the trend reversed.
Simulation Results of VOC Emission Rate
Material Properties Used in the Numerical Model. Table 3 lists the physical properties needed by the numerical model. Most of the parameters are the properties of the
mate-rial or compounds. Among others, the partition coefficient for wood stain was obtained from headspace analysis by analyz-ing the air phase TVOC concentration of the wood stain. The liquid expansion factor (α) was introduced to represent the absorptivity of the substrate. Physically, α means that once a “wet” material is applied onto an absorptive substrate, the volume of the liquid film absorbed by the substrate will be expanded by a factor of α to the initial volume, and the initial VOC concentration in the film will decrease by a factor of α. The α value was obtained by fitting the simulated emission
Figure 8 Measured emission rates of decane in different chambers.
TABLE 3
Physical Properties of Decane and Wood Stain Applied on Oak Substrates (23.5ºC)
Property Symbol (unit) Decane Wood Stain
Liquid density (initial) ρl (mg/m3) 7.3×10⁸ a 8.18×10⁸ b Initial VOC concentration in liquid Cl,0 (mg/m3) 7.3×10⁸ 6.9092×10⁸ c VOC vapor pressure Ca,0 (mg/m3) 12466 d 17131.7 e
Partition coefficient Kma (-) f 58559.3 40330
Liquid expansion factor in substrate α (-) g 1.2 1.33 Initial VOC concentration in film Cm,0 (mg/m3) h 6.083×10⁸ 5.195×10⁸
VOC Schmidt number Sc (-) d 2.6 2.6
Initial VOC diffusivity in film Dm,0 (m3/s) i 1×10-11 1×10-11 VOC diffusivity in substrate Dms (m3/s) i 1×10-14 1×10-14
a Lide 1995 b Lab measurement
c Lab measurement using glass substrates d Chang et al. 1992
e Headspace analysis f K
ma = Cl,0/Ca,0
g Obtained by fitting the simulated initial emission rates (0-0.2 h) with the small-scale chamber data
(case1-1a for decane and case 1-1b for wood stain)
h C
m,0 = Cl,0/α
i Obtained by fitting the simulated emission rates (>0.2 h) with the small-scale chamber data
AT-01-13-2 9 rates with the data during the initial period, when the
emis-sions are dominated by evaporation and initial conditions. The properties most difficult to determine are the diffusivities of VOCs in the material film and in the substrate. The values listed in Table 3 were obtained by fitting the predicted VOC emission rates to the small-scale experimental (reference) data. Special attention had been paid to avoiding the estima-tion errors due to inter-dependency of the two parameters (Dm,0 and Dms) in the regression analysis (Yang 1999).
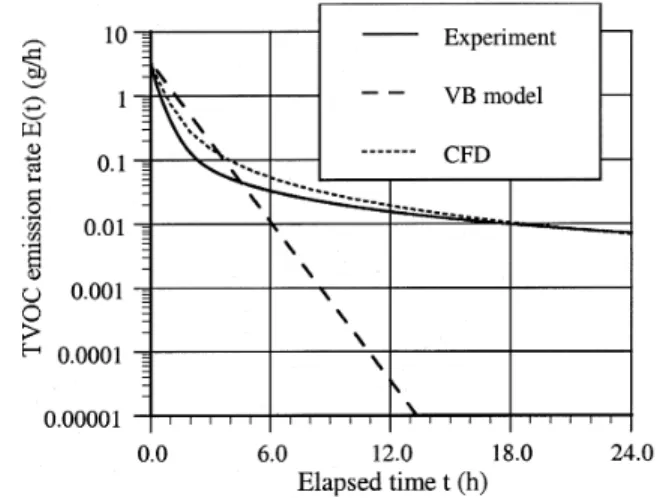
Comparison of Simulated Results with the Measured Data. Figure 9 compares the measured and simulated VOC emission rates of wood stain in the small-scale chamber (case 1-1b) using both the numerical model and the VB model. The average air phase mass transfer coefficient used in the VB model was 4.03 m/h (V = 0.15 m/s). The value was obtained by CFD simulation and confirmed by using the mass transfer correlation for laminar flow (Yang et al. 1998a). Since the VB model assumes no internal diffusion in the material film and the substrate, it only applies to the period when the emissions are dominated by surface evaporation. The difference in the emission rates was predicted by the VB model, and the numer-ical model indicated the effects of diffusion. The results show that evaporation dominated the emission process during the first two hours for decane but only the first 0.2 hour for the wood stain. After that, emissions gradually became internal diffusion controlled. The above confirmed that emissions from “wet” materials applied to an absorptive substrate are dominated by evaporation at the beginning and internal diffu-sion afterward, which had been speculated based on previous experimental data.
Figure 9 also shows that the simulated VOC emission rates agree with the small-scale chamber data. This is expected because the agreement was achieved by adjusting the material properties (diffusivities in the material film and substrate) and
fitting the simulated emission rates to the data. The model needs to be further validated. This was done by applying the model and the material properties obtained from the small-scale chamber to full-small-scale chamber cases, as demonstrated below.
Figure 10 shows the comparison of the simulated VOC emission rates from the wood stain with the measured data for 5 ACH in the full-scale chamber (case 2-2b). Comparison of the wood stain emissions at other ventilation rates (1 ACH and 9 ACH) and decane (5 ACH) between the simulated and measured results follows similar trends. Again, the numerical model performed better than the VB model, especially during the diffusion-controlled period. The full-scale chamber simu-lation used the same material properties obtained from the small-scale chamber. The relatively large discrepancy during 0.25-7 hours may be attributed to the simulation error caused by inaccurate estimation of material properties and the simu-lation error of velocity and turbulence distributions. In addi-tion, the electronic balance also experienced fluctuations due to the turbulent flow in the full-scale chamber, so the measured weight decay data could also have some error. Taking these combined factors into consideration, the simulated emission rates agreed reasonably with the measured data.
The above results indicate that the numerical model is capable of predicting “wet” material emissions in both small-scale (laminar flow) and full-small-scale (turbulent flow). The emis-sion characteristics of a “wet” material will change when the environmental conditions change. The model can physically address the effects of the environmental conditions (velocity, turbulence, etc.) on emissions, provided that the material properties are known. With the property values, the model can be used to study “wet” material emissions in actual building environments without resorting to highly expensive full-scale environmental chamber tests.
Figure 9 Comparison of measured and simulated VOC
emission rates of wood stain in the small-scale chamber (case 1-1b).
Figure 10 Comparison of measured and simulated VOC
emission rates in the full-scale chamber (case 2-2b, 5 ACH).
CONCLUSIONS
The effects of airflow on emission characteristics of “wet” materials, including a single compound (decane) and a commercial oil-based wood stain applied on oak boards, were investigated using a small-scale (0.4 m3) and a full-scale (55 m3) environmental chamber. A numerical model has been developed to simulate the “wet” material emissions. This model considers VOC mass transfer in the air and mate-rial-air interface, diffusion in the material film, and diffusion in the substrate. The study led to the following conclusions: 1. The results from the experimental measurements indicate
that the emission characteristics of “wet” materials can be affected by local airflow. The emission data measured from a small-scale chamber may not be applied directly to a building due to different airflow conditions between a small-scale chamber and a building.
2. The emission model developed can predict emissions under different flow conditions (laminar flow in a small-scale chamber and turbulent flow in a full-scale chamber) with reasonable accuracy. The numerical studies also confirm that the emissions from the “wet” materials applied to an absorptive substrate are dominated by evaporation at the beginning and internal diffusion afterward, which had been speculated based on previous experimental data.
3. The use of this numerical model requires material proper-ties, such as the VOC diffusivities in the material film and the substrate. With these property values, the model can be used to study “wet” material emissions in actual building environments.
ACKNOWLEDGMENTS
The investigation was supported by the U.S. National Science Foundation (Grant CMS- 9623864) and the National Research Council of Canada. We would also like to thank Dr. Jiping Zhu, Mr. Bob Magee, and Ms. Ewa Lusztyk of IRC/ NRC for their assistance in conducting the experiments.
REFERENCES
ASTM. 1990. Standard guide for small-scale environmental
chamber determinations of organic emissions from indoor materials/products, ASTM, D5116. Philadelphia:
American Society of Testing and Materials.
Bodalal, A., J.S. Zhang, and E.G. Plett. 1999. A method for measuring internal diffusion and partition coefficients of volatile organic compounds for building materials.
Building and Environment 35(2): 101-110.
CHAM. 1996. PHOENICS Version 2.1. CHAM Ltd., U.K. Chang, J.C.S., and Z. Guo. 1992. Characterization of organic
emissions from a wood finishing productWood stain.
Indoor Air 2: 146-153.
Chang, J.C.S., B.A. Tichenor, Z. Guo, and K. Kreb. 1997. Substrate effects on VOC emissions from a latex paint.
Indoor Air 7: 241-247.
Chen, Q. 1995. Comparison of different k-ε models for indoor airflow computations. Numerical Heat Transfer,
Part B 28: 353-369.
Chen, Q. 1996. Prediction of room air motion by Reynolds-stress models. Building and Environment 31(3): 233-244.
Chen, P., and C.T. Pei. 1989. A mathematical model of dry-ing processes. International Journal of Heat and Mass
Transfer 32(2): 297-310.
Guo, Z., and B.A. Tichenor. 1992. Fundamental mass trans-fer models applied to evaluating the emissions of vapor-phase organics from interior architectural coatings.
Pro-ceedings of EPA/AWMA Symposium, Durham, N.C.
Haghighat, F., Z. Jiang, and Y. Zhang. 1994. The impact of ventilation rate and partition layout on the VOC emis-sion rate: Time-dependent contaminant removal. Indoor
Air 4: 276-283.
Haghighat, F., and L. De Bellis. 1998. Material emission rates: Literature review and the impact of indoor air temperature and relative humidity. Building and
Envi-ronment 33(5): 261-277.
Lide, D.R. (editor-in-chief). 1995. Handbook of Chemistry
and Physics, 76th ed. CRC Press.
Schwope, A.D., W.J. Lyman, and R.C. Reid. 1989. Methods for assessing exposure to chemical substances. In
Meth-odology for estimating the migration of additives and impurities from polymetric materials, vol. 11.
Washing-ton, D.C.: U.S. Environmental Protection Agency, Office of Toxic Substances, EPA/560/5-85-015.
Sparks, L.E., B.A. Tichenor, J.C.S. Chang, and Z. Guo. 1996. Gas-phase mass transfer model for predicting vol-atile organic compound (VOC) emission rates from indoor pollutant sources. Indoor Air 6: 31-40.
Topp, C., P.V. Nielsen, and P. Heiselberg. 1997. Evaporation controlled emission in ventilated rooms. Proceedings of
Healthy Buildings/IAQ’97, Washington D.C.
Wilkes, C., M. Koontz, M. Ryan, and C. Cinalli. 1996. Esti-mation of emission profiles for interior latex paints.
Pro-ceedings of Indoor Air’96, Nagoya, Japan.
Yakhot, V., S.A. Orzag, S. Thangam, T.B. Gatski, and C.G. Speziale. 1992. Development of turbulence models for shear flows by a double expansion technique. Phys.
Flu-ids A 4(7): 1510-1520.
Yang, X., Q. Chen, and J.S. Zhang. 1997. Study of VOC emissions from building materials using computational fluid dynamics. Proceedings of Healthy Buildings/
IAQ’97, Washington D.C., pp. 587-592.
Yang, X., Q. Chen, and J.S. Zhang. 1998a. Impact of early stage incomplete mixing on estimating VOC emissions in small test chambers. Indoor Air 8: 180-189.
Yang, X., Q. Chen, and P.M. Bluyssen. 1998b. Prediction of short-term and long-term volatile organic compound emissions from SBR bitumen-backed carpet under dif-ferent temperatures. ASHRAE Transactions 104(2): 1297-1308.
AT-01-13-2 11 Yang, X., and Q. Chen. 1999. A model for numerical
simula-tion of VOC sorpsimula-tion by building materials.
Proceed-ings of the 8th International Conference on Indoor Air Quality & Climate, Indoor Air ’99, Edinburgh, Scotland.
Yang, X. 1999. Study of building material emissions and indoor air quality. Ph.D. thesis, Massachusetts Institute of Technology, Cambridge, Massachusetts.
Yuan, X., Q. Chen, L.R. Glicksman, Y. Hu, and X. Yang. 1999. Measurements and computations of room airflow with displacement ventilation. ASHRAE Transactions 105(1): 340-352.
Zeng, J., X. Yang, J.S. Zhang, Q. Chen, and G. Nong. 1999. Effects of temperature on VOC emissions from “wet” coating materials. Proceedings of the 8th International
Conference on Indoor Air Quality & Climate, Indoor Air ’99, Edinburgh, Scotland.
Zhang, J.S., C.Y. Shaw, J.M. Kanabus-Kaminska, et al. 1996a. Study of air velocity and turbulence effects on organic compound emissions from building materials/ furnishings using a new small test chamber.
Character-izing Sources of Indoor Air Pollution and Related Sink Effects, ASTM STP 1287, Bruce A. Tichenor (ed.),
ASTM, 184-199.
Zhang, J.S., J.M. Kanabus-Kaminska, and C.Y. Shaw. 1996b. A full-scale test chamber for material emission studies and indoor air quality modeling. Characterizing
Sources of Indoor Air Pollution and Related Sink Effects, ASTM STP 1287, Bruce A. Tichenor (ed.),
ASTM, 58-66.
Zhang, J.S., G. Nong, C.Y. Shaw, and J.M. Wang. 1999. Measurements of volatile organic compound (VOC) emissions from wood stains by using an electronic bal-ance. ASHRAE Transactions 105(1): 279-288.