Center of mass energy and system-size dependence
of photon production at forward rapidity at RHIC
The MIT Faculty has made this article openly available. Please sharehow this access benefits you. Your story matters.
Citation STAR Collaboration et al. "Center of mass energy and system-size dependence of photon production at forward rapidity at RHIC." Nuclear Physics A 832, 1-2 (January 2010): 134-147 © 2009 Elsevier B.V.
As Published http://dx.doi.org/10.1016/j.nuclphysa.2009.11.011
Publisher Elsevier BV
Version Author's final manuscript
Citable link https://hdl.handle.net/1721.1/121380
Terms of Use Creative Commons Attribution-Noncommercial-Share Alike Detailed Terms http://creativecommons.org/licenses/by-nc-sa/4.0/
arXiv:0906.2260v2 [nucl-ex] 23 Nov 2009
Center of mass energy and system-size
dependence of photon production at forward
rapidity at RHIC
B. I. Abelev
h, M. M. Aggarwal
ad, Z. Ahammed
au,
A. V. Alakhverdyants
q, B. D. Anderson
r, D. Arkhipkin
c,
G. S. Averichev
q, S. K. Badyal
p, J. Balewski
v,
O. Barannikova
h, L. S. Barnby
b, J. Baudot
o, S. Baumgart
ba,
D. R. Beavis
c, R. Bellwied
ay, F. Benedosso
aa,
M. J. Betancourt
v, R. R. Betts
h, A. Bhasin
p, A. K. Bhati
ad,
H. Bichsel
aw, J. Bielcik
j, J. Bielcikova
k, B. Biritz
f,
L. C. Bland
c, I. Bnzarov
q, M. Bombara
b, B. E. Bonner
aj,
J. Bouchet
r, E. Braidot
aa, A. V. Brandin
y, E. Bruna
ba,
S. Bueltmann
ac, T. P. Burton
bM. Bystersky
k, X. Z. Cai
an,
H. Caines
ba, M. Calder´on
e, O. Catu
ba, D. Cebra
e,
R. Cendejas
f, M. C. Cervantes
ap, Z. Chajecki
ab,
P. Chaloupka
k, S. Chattopadhyay
au, H. F. Chen
aℓ,
J. H. Chen
r, J. Y. Chen
az, J. Cheng
ar, M. Cherney
i,
A. Chikanian
ba, K. E. Choi
ah, W. Christie
c, R. F. Clarke
ap,
M. J. M. Codrington
ap, R. Corliss
v, T. M. Cormier
ay,
M. R. Cosentino
ak, J. G. Cramer
aw, H. J. Crawford
d, D. Das
e,
S. Das
au, S. Dash
ℓ, M. Daugherity
aq, L. C. De Silva
ay,
T.G. Dedovich
q, M. DePhillips
c, A. A. Derevschikov
af,
R. Derradi de Souza
g, L. Didenko
c, P. Djawotho
ap,
S. M. Dogra
p, X. Dong
u, J. L. Drachenberg
ap, J. E. Draper
e,
J. C. Dunlop
c, M. R. Dutta Mazumdar
au, L. G. Efimov
q,
E. Elhalhuli
b, M. Elnimr
ay, J. Engelage
d, G. Eppley
aj,
B. Erazmus
ao, M. Estienne
ao, L. Eun
ae, P. Fachini
c,
R. Fatemi
s, J. Fedorisin
q, A. Feng
az, P. Filip
q, E. Finch
ba,
V. Fine
c, Y. Fisyak
c, C. A. Gagliardi
ap, L. Gaillard
b,
D. R. Gangadharan
f, M. S. Ganti
au, E.J. Garcia-Solis
h,
A. Geromitsos
ao, F. Geurts
aj, V. Ghazikhanian
f, P. Ghosh
au,
B. Grube
ah, S.M. Guertin
f, K. S. F. F. Guimaraes
ak,
A. Gupta
p, N. Gupta
p, W. Guryn
c, B. Haag
e, T. J. Hallman
c,
A. Hamed
ap, J. W. Harris
ba, W. He
n, M. Heinz
ba,
S. Hepplemann
ae, B. Hippolyte
o, A. Hirsch
ag, E. Hjort
u,
A. M. Hoffman
v, G. W. Hoffmann
aq, D. J. Hofman
h,
R. S. Hollis
h, H. Z. Huang
f, T. J. Humanic
ab, L. Huo
ap,
G. Igo
f, A. Iordanova
h, P. Jacobs
u, W. W. Jacobs
n, P. Jakl
k,
C. Jena
ℓ, F. Jin
an, C. L. Jones
v, P. G. Jones
b, J. Joseph
r,
E. G. Judd
d, S. Kabana
ao, K. Kajimoto
aq, K. Kang
ar,
J. Kapitan
k, K. Kauder
h, D. Keane
r, A. Kechechyan
q,
D. Kettler
aw, V. Yu. Khodyrev
af, D. P. Kikola
u, J. Kiryluk
u,
A. Kisiel
av, S. R. Klein
u, A. G. Knospe
ba, A. Kocoloski
v,
D. D. Koetke
at, J. Konzer
ag, M. Kopytine
r, I. Koralt
ac,
W. Korsch
s, L. Kotchenda
y, V. Kouchpil
k, P. Kravtsov
y,
V. I. Kravtsov
af, K. Krueger
a, M. Krus
j, C. Kuhn
o,
L. Kumar
ad, P. Kurnadi
f, M. A. C. Lamont
c, J. M. Landgraf
c,
S. LaPointe
ay, J. Lauret
c, A. Lebedev
c, R. Lednicky
q,
C-H. Lee
ah, J. H. Lee
c, W. Leight
v, M. J. LeVine
c, C. Li
aℓ,
N. Li
az, Y. Li
ar, G. Lin
ba, S. J. Lindenbaum
z, M. A. Lisa
ab,
F. Liu
az, H. Liu
e, J. Liu
aj, L. Liu
az, T. Ljubicic
c,
W. J. Llope
aj, R. S. Longacre
c, W. A. Love
c, Y. Lu
aℓ,
T. Ludlam
c, G. L. Ma
an, Y. G. Ma
an, D. P. Mahapatra
ℓ,
R. Majka
ba, O. I. Mall
e, L. K. Mangotra
p, R. Manweiler
at,
S. Margetis
r, C. Markert
aq, H. Masui
u, H. S. Matis
u,
Yu. A. Matulenko
af, D. McDonald
aj, T. S. McShane
i,
A. Meschanin
af, R. Millner
v, N. G. Minaev
af,
S. Mioduszewski
ap, A. Mischke
aa, B. Mohanty
au,
M.M. Mondal
au, D. A. Morozov
af, M. G. Munhoz
ak,
B. K. Nandi
m, C. Nattrass
ba, T. K. Nayak
au, J. M. Nelson
b,
P. K. Netrakanti
ag, M. J. Ng
d, L. V. Nogach
af,
S. B. Nurushev
af, G. Odyniec
u, A. Ogawa
c, H. Okada
c,
V. Okorokov
y, D. Olson
u, M. Pachr
j, B. S. Page
n, S. K. Pal
au,
Y. Pandit
r, Y. Panebratsev
q, T. Pawlak
av, T. Peitzmann
aa,
V. Perevoztchikov
c, C. Perkins
d, W. Peryt
av, S. C. Phatak
ℓ,
D. Plyku
ac, N. Poljak
bb, A. M. Poskanzer
u,
B. V. K. S. Potukuchi
p, D. Prindle
aw, C. Pruneau
ay,
N. K. Pruthi
ad, P. R. Pujahari
m, J. Putschke
ba, R. Raniwala
ai,
S. Raniwala
ai, R. L. Ray
aq, R. Redwine
v, R. Reed
e,
A. Ridiger
y, H. G. Ritter
u, J. B. Roberts
aj,
O. V. Rogachevskiy
q, J. L. Romero
e, A. Rose
u, C. Roy
ao,
L. Ruan
c, M. J. Russcher
aa, R. Sahoo
ao, S. Sakai
f,
I. Sakrejda
u, T. Sakuma
v, S. Salur
u, J. Sandweiss
ba,
M. Sarsour
ap, J. Schambach
aq, R. P. Scharenberg
ag,
N. Schmitz
w, J. Seger
i, I. Selyuzhenkov
n, P. Seyboth
w,
A. Shabetai
o, E. Shahaliev
q, M. Shao
aℓ, M. Sharma
ay,
S. S. Shi
az, X-H. Shi
an, E. P. Sichtermann
u, F. Simon
w,
R. N. Singaraju
au, M.J. Skoby
ag, N. Smirnov
ba, P. Sorensen
c,
J. Sowinski
n, H. M. Spinka
a, B. Srivastava
ag,
T. D. S. Stanislaus
at, D. Staszak
f, M. Strikhanov
y,
B. Stringfellow
ag, A. A. P. Suaide
ak, M. C. Suarez
h,
N. L. Subba
r, M. Sumbera
k, X. M. Sun
u, Y. Sun
aℓ, Z. Sun
t,
B. Surrow
v, T. J. M. Symons
u, A. Szanto de Toledo
ak,
J. Takahashi
g, A. H. Tang
c, Z. Tang
aℓ, L. H. Tarini
ay,
T. Tarnowsky
x, D. Thein
aq, J. H. Thomas
u, J. Tian
an,
A. R. Timmins
ay, S. Timoshenko
y, D. Tlusty
k, M. Tokarev
q,
T. A. Trainor
aw, V.N. Tram
u, A. L. Trattner
d, S. Trentalange
f,
R. E. Tribble
ap, O. D. Tsai
f, J. Ulery
ag, T. Ullrich
c,
D. G. Underwood
a, G. Van Buren
c, M. van Leeuwen
aa,
G. van Nieuwenhuizen
v, J.A. Vanfossen,Jr.
r, R. Varma
m,
G. M. S. Vasconcelos
g, A. N. Vasiliev
af, F. Videbaek
c,
S. E. Vigdor
n, Y.P. Viyogi
ℓ, S. Vokal
q, S. A. Voloshin
ay,
M. Wada
aq, M. Walker
v, F. Wang
ag, G. Wang
f, H. Wang
x,
J. S. Wang
t, Q. Wang
ag, X. Wang
ar, X. L. Wang
aℓ, Y. Wang
ar,
G. Webb
s, J. C. Webb
at, G. D. Westfall
x, C. Whitten Jr.
f,
H. Wieman
u, S. W. Wissink
n, R. Witt
as, Y. Wu
az, W. Xie
ag,
N. Xu
u, Q. H. Xu
am, Y. Xu
aℓ, Z. Xu
c, Y. Yang
t, P. Yepes
aj,
K. Yip
c, I-K. Yoo
ah, Q. Yue
ar, M. Zawisza
av, H. Zbroszczyk
av,
W. Zhan
t, S. Zhang
an, W. M. Zhang
r, X.P. Zhang
u,
Y. Zhang
u, Z. P. Zhang
aℓ, Y. Zhao
aℓ, C. Zhong
an, J. Zhou
aj,
X. Zhu
ar, R. Zoulkarneev
q, Y. Zoulkarneeva
q, and J. X. Zuo
an,
(STAR Collaboration)
aArgonne National Laboratory, Argonne, Illinois 60439 bUniversity of Birmingham, Birmingham, United Kingdom cBrookhaven National Laboratory, Upton, New York 11973
dUniversity of California, Berkeley, California 94720 eUniversity of California, Davis, California 95616 fUniversity of California, Los Angeles, California 90095 gUniversidade Estadual de Campinas, Sao Paulo, Brazil hUniversity of Illinois at Chicago, Chicago, Illinois 60607
iCreighton University, Omaha, Nebraska 68178
jCzech Technical University in Prague, FNSPE, Prague, 115 19, Czech Republic kNuclear Physics Institute AS CR, 250 68 ˇReˇz/Prague, Czech Republic
ℓInstitute of Physics, Bhubaneswar 751005, India mIndian Institute of Technology, Mumbai, India nIndiana University, Bloomington, Indiana 47408 oInstitut de Recherches Subatomiques, Strasbourg, France
pUniversity of Jammu, Jammu 180001, India
qJoint Institute for Nuclear Research, Dubna, 141 980, Russia rKent State University, Kent, Ohio 44242
sUniversity of Kentucky, Lexington, Kentucky, 40506-0055 tInstitute of Modern Physics, Lanzhou, China
uLawrence Berkeley National Laboratory, Berkeley, California 94720 vMassachusetts Institute of Technology, Cambridge, MA 02139-4307
wMax-Planck-Institut f¨ur Physik, Munich, Germany xMichigan State University, East Lansing, Michigan 48824
yMoscow Engineering Physics Institute, Moscow Russia zCity College of New York, New York City, New York 10031 aaNIKHEF and Utrecht University, Amsterdam, The Netherlands
abOhio State University, Columbus, Ohio 43210 acOld Dominion University, Norfolk, VA, 23529 adPanjab University, Chandigarh 160014, India
aePennsylvania State University, University Park, Pennsylvania 16802 afInstitute of High Energy Physics, Protvino, Russia
agPurdue University, West Lafayette, Indiana 47907 ahPusan National University, Pusan, Republic of Korea
aiUniversity of Rajasthan, Jaipur 302004, India ajRice University, Houston, Texas 77251 akUniversidade de Sao Paulo, Sao Paulo, Brazil
aℓUniversity of Science & Technology of China, Hefei 230026, China amShandong University, Jinan, Shandong 250100, China anShanghai Institute of Applied Physics, Shanghai 201800, China
aoSUBATECH, Nantes, France
apTexas A&M University, College Station, Texas 77843 aqUniversity of Texas, Austin, Texas 78712 arTsinghua University, Beijing 100084, China asUnited States Naval Academy, Annapolis, MD 21402
atValparaiso University, Valparaiso, Indiana 46383 auVariable Energy Cyclotron Centre, Kolkata 700064, India
avWarsaw University of Technology, Warsaw, Poland awUniversity of Washington, Seattle, Washington 98195
ayWayne State University, Detroit, Michigan 48201
azInstitute of Particle Physics, CCNU (HZNU), Wuhan 430079, China baYale University, New Haven, Connecticut 06520
bbUniversity of Zagreb, Zagreb, HR-10002, Croatia
Abstract
We present the multiplicity and pseudorapidity distributions of photons produced in Au+Au and Cu+Cu collisions at √sNN = 62.4 and 200 GeV. The photons are
measured in the region −3.7 < η < −2.3 using the photon multiplicity detector in the STAR experiment at RHIC. The number of photons produced per average number of participating nucleon pairs increases with the beam energy and is in-dependent of the collision centrality. For collisions with similar average numbers of participating nucleons the photon multiplicities are observed to be similar for Au+Au and Cu+Cu collisions at a given beam energy. The ratios of the number of charged particles to photons in the measured pseudorapidity range are found to be 1.4 ± 0.1 and 1.2 ± 0.1 for √sNN = 62.4 GeV and 200 GeV, respectively. The
energy dependence of this ratio could reflect varying contributions from baryons to charged particles, while mesons are the dominant contributors to photon production in the given kinematic region. The photon pseudorapidity distributions normalized by average number of participating nucleon pairs, when plotted as a function of η − ybeam, are found to follow a longitudinal scaling independent of centrality and
colliding ion species at both beam energies.
1 Introduction
For high energy heavy-ion collisions, measurements of particle multiplicity provide information on particle production mechanisms [1]. Event-by-event fluctuations in the multiplicity of produced particles within a thermodynamic picture could be related to matter compressibility [2]. The event-by-event cor-relation between photon and charged particle multiplicities can be used to test the predictions of formation of disoriented chiral condensates [3]. The varia-tion of particle density in pseudorapidity (η) with collision centrality can shed light on the relative contribution of soft and hard (perturbative QCD jets) processes in particle production [4]. Multiplicity measurements can provide tests of ideas on initial conditions in heavy-ion collisions based on parton sat-uration [5] and color glass condensates [6]. Under certain model assumptions, the particle density in pseudorapidity can provide information on the initial temperature and velocity of sound in the medium [7]. The pseudorapidity dis-tributions are found to be sensitive to the effects of re-scattering, hadronic final-state interactions, and longitudinal flow [8].
Several interesting features of the dependence of particle density in pseudo-rapidity have been observed in Au+Au collisions from the experiments at the Relativistic Heavy-Ion Collider (RHIC). Particle production is found to follow a unique, collision energy independent, longitudinal scaling [9] in p+p and d+Au, as well as in heavy-ion collisions [10,11]. Such longitudinal scal-ing is also found to be independent of collision centrality for photons [12,13]. The total charged particle multiplicity (integrated over the full pseudorapidity range) per average number of participating nucleon (hNparti) pair is found to
be independent of collision centrality [10]. However, at mid-rapidity (|η| < 1), charged particle multiplicity per hNparti is observed to increase from peripheral
to central collisions [10]. This clearly indicates that the mechanism of particle production could be different in different pseudorapidity regions. In the year 2005, a unique opportunity to investigate the system-size dependence of global observables occurred when Cu+Cu collisions were produced at RHIC. In light of the earlier results of photon multiplicity scaling with hNparti [12,13] at
for-ward rapidity, one could make direct comparison of the observables (Nγ and
dNγ/dη) for Cu+Cu and Au+Au collisions for systems having similar values
of hNparti.
In this paper we present the first measurements of photon multiplicity distri-butions at forward rapidities in Cu+Cu collisions at √sNN = 62.4 and 200 GeV
and Au+Au collisions at √sNN = 200 GeV from the STAR experiment [14]
re-ported in Refs. [12,13]. The photon multiplicity measurements are presented for various collision centrality classes and are compared to corresponding re-sults for charged particles. The photon production is dominated by those from the decay of π0s [12]. hijing [15] calculations indicate that about 93–96% of
photons are from inclusive π0 decays for the √s
NN and η range studied.
2 Experiment and Analysis
The STAR detector contains several subsystems which measure hadronic and electromagnetic observables at forward rapidity [14]. The main subsystem used in the present analysis is the Photon Multiplicity Detector (PMD) [17]. Pho-tons are detected using a highly granular preshower PMD located −5.4 m from the center of the Time Projection Chamber (TPC), the nominal colli-sion point, along the beam axis. The measurements are carried out within the pseudorapidity region of −3.7 to −2.3 at √sNN = 62.4 and 200 GeV for
Au+Au and Cu+Cu collisions. A minimum bias trigger is obtained using the charged particle hits from the Central Trigger Barrel (CTB), an array of scin-tillator slats arranged in a barrel around the TPC, two Zero Degree Hadronic Calorimeters (ZDCs) located ±18 m from the center of the TPC, and two Beam-Beam Counters (BBCs) [18]. A total of 307k, 334k, 289k and 330k min-imum bias events for Au+Au 200, Au+Au 62.4, Cu+Cu 200 and Cu+Cu 62.4 GeV collisions, respectively, were analyzed. These events have a collision ver-tex position less than 30 cm from the center of the TPC along the beam axis. The centrality determination in this analysis uses the uncorrected multiplicity of charged particles in the region |η| < 0.5, as measured in the TPC. The av-erage number of participating nucleons is obtained from Monte Carlo Glauber calculations [19]. The hNparti values corresponding to various percentages of
the cross section for Au+Au and Cu+Cu collisions at √sNN = 62.4 and 200
GeV are given in the Table 1.
The PMD consists of two planes (charged particle veto and preshower) of ar-rays of cellular gas proportional counters. A lead plate (3 radiation lengths thickness) is placed between the two planes and serves as a photon converter. The sensitive medium is a gas mixture of Ar and CO2 in the ratio 70:30 by
weight. There are 41,472 hexagonal cells in each plane, which are located in-side 12 high voltage insulated and gas-tight chambers called supermodules. To each supermodule is applied a negative voltage of 1400 V as the operat-ing voltage. A photon traversoperat-ing the converter produces an electromagnetic shower in the preshower plane, leading to a large signal, spread over several cells. In contrast, a charged particle’s signal is essentially confined to a single cell. The photon conversion efficiency studied from simulations is found to increase with increasing photon energy (Eγ) up to 1 GeV and then saturate
Table 1
Average number of participating nucleons (hNparti) for various collision centralities
for Au+Au and Cu+Cu collisions at √sNN = 62.4 and 200 GeV.
% cross section hNpartAuAui hNpartAuAui hNpartCuCui hNpartCuCui
200 GeV 62.4 GeV 200 GeV 62.4 GeV 0-5 352.4+3.4 −4.0 347.3 +4.3 −3.7 – – 0-10 325.9+5.5−4.3 – 99.0+1.5−1.2 96.4+1.1−2.6 5-10 299.3+6.6 −6.7 293.3 +7.3 −5.6 — – 10-20 234.5+9.1−7.8 229.0+9.2−7.7 74.6+1.3−1.0 72.2+0.6−1.9 20-30 166.6+10.1 −9.6 162.0 +10.0 −9.5 53.7 +1.0 −0.7 51.8 +0.5 −1.2 30-40 115.5+9.6−9.6 112.0+9.6−9.1 37.8+0.7−0.5 36.2+0.4−0.8 40-50 76.7+9.0 −9.1 74.2 +9.0 −8.5 26.2 +0.5 −0.4 24.9 +0.4 −0.6 50-60 47.3+7.6−8.1 45.8+7.0−7.1 17.2+0.4−0.2 16.3+0.4−0.3 60-70 26.9+5.5 −6.5 25.9 +5.6 −5.6 – – 70-80 14.1+3.6 −4.0 13.0 +3.4 −4.6 – –
are observed to be around 70% for Eγ = 0.2 GeV and 95% for Eγ = 1 GeV. In
the present analysis, only the data from the preshower plane are used. Further details of the design and characteristics of the PMD are found in Ref. [17]. The analysis of the data from the PMD involves the following: (a) event se-lection, (b) cell-to-cell gain calibration, and (c) reconstruction or extraction of the photon multiplicity. The cell-to-cell gain calibration is done using the ADC distributions of isolated cells (cells with six neighbouring cells having zero ADC). The ADC distribution of an isolated cell is treated as the re-sponse of the cell to charged particles, corresponding to a minimum ionizing particle (MIP) [17]. For most of the cells this response follows a Landau dis-tribution. We use the mean of the ADC distribution of isolated cells to esti-mate and correct the relative gains of all cells within each supermodule. The cell-to-cell gain variation is between 10–25% for different supermodules. The extraction of the photon multiplicity proceeds in two steps involving clustering of hits and photon-hadron discrimination. Hit clusters consist of contiguous cell signals. Photons are separated from charged particles using the following conditions: (a) the number of cells in a cluster is > 1, and (b) the cluster signal is larger than 3 times the average MIP response of all isolated cells in a supermodule. The choice of the conditions is based on results of detailed simulations [12,13,17]. The number of selected clusters, called γ−like clus-ters (Nγ−like), in different supermodules for the same η coverage are used to evaluate the effect of possible non-uniformity in the response of the detector.
η
-3.5
-3
-2.5
(%)
0
20
40
60
80
100
Efficiency Purity Efficiency PurityAu+Au 200 GeV Cu+Cu 200 GeV
η
-3.5
-3
-2.5
(%)
0
20
40
60
80
100
AMPT HIJING Efficiency Purity Efficiency Purity Au+Au 62.4 GeVFig. 1. (color online) Top panel: Photon reconstruction efficiency (ǫγ) (solid
sym-bols) and purity of photon sample (fp) (open symbols) for PMD as a function of
pseudorapidity (η) for minimum bias Au+Au and Cu+Cu at √sNN = 200 GeV.
Bottom panel: Comparison between estimated ǫγand fp for PMD as a function of η
for minimum bias Au+Au at √sNN = 62.4 GeV using HIJING and AMPT models.
The error bars on the AMPT data are statistical and those for HIJING are within the symbol size.
To estimate the number of photons (Nγ) from the detected Nγ−like
clus-ters, we use the photon reconstruction efficiency (ǫγ) and purity (fp) of the
γ−like sample defined [12,20] as ǫγ = Nclsγ,th/Nγ and fp = Nclsγ,th/Nγ−like,
re-spectively. Nclsγ,th is the number of photon clusters above the photon-hadron
discriminator threshold. The photon multiplicity in data is then obtained as Nγ = (fp/ǫγ)Nγ−like [12,17,20], where the ratio fp/ǫγ is estimated from
simu-lations as described below. Both ǫγ and fp are obtained from a detailed Monte
Carlo simulation using hijing version 1.382 [15] with default parameter set-tings and the detector simulation package geant [21], which incorporates the full STAR detector framework. In our previous work [13] it has been shown that HIJING reproduces the Nch/Nγratio in Au+Au collisions at √sNN = 62.4
GeV. For estimation of ǫγ in simulations it may be important to know the
in-clusive photon pT distribution. Due to lack of experimental measurement of
the inclusive photon pT distribution at forward rapidity it assumed that they
are similar to those from HIJING model. In order to investigate the possible differences, ǫγ and fp are also obtained from a detailed Monte Carlo
simu-lation using AMPT model [16] with default parameter settings. The AMPT model is a multiphase transport model which includes both initial partonic and final hadronic interactions. The differences between the ǫγ and fp values
estimated using the two models are less than 5%. This difference is attributed to systematic errors on Nγ. Both ǫγ and fp can vary with pseudorapidity and
centrality. The ǫγ and fp for minimum bias Au+Au and Cu+Cu at 200 GeV
are shown in top panel of Fig. 1. The photon reconstruction efficiency (which includes the detector acceptance corrections) varies from 30% at η = −2.3 to 60% at η = −3.7 for all collision centralities obtained from simulations for Au+Au and Cu+Cu collisions at 62.4 [12,13] and 200 GeV. The purity of the photon sample is nearly constant as a function of η and varies between 40% and 60% for Au+Au and Cu+Cu collisions at 62.4 [12,13] and 200 GeV. Both ǫγ and fp show slight variation with system-size. The η dependence of
the ǫγ reflects mainly the varying detector acceptance between η = −2.0 and
η = −3.0. There is also a small effect on the η on ǫγ due to varying particle
density as a function of η. This is effect is already reflected in the compar-ison of ǫγ values between Au+Au and Cu+Cu. The fp values by definition
are not affected by detector acceptance. The bottom panel of Fig. 1 shows a typical comparison of estimated ǫγ and fp using HIJING and AMPT models
for Au+Au minimum bias collisions at 62.4 GeV. The differences are within 5% level. The systematic errors are discussed below. The lower limit of photon pT acceptance in the PMD is estimated from detector simulations to be 20
MeV/c.
The systematic errors for photon multiplicity (Nγ) are due to [12,13] (a)
un-certainty in estimates of ǫγ and fp values arising from splitting of clusters,
the choice of photon-hadron discriminator threshold and choice of different event generators for their estimation and (b) uncertainty in Nγ arising from
0
200
400
600
Number of events
210
310
410
Au+Au 200 GeV0
50
100 150 200
Cu+Cu 200 GeV γN
0 100 200 300Number of events
1 10 2 10 3 10 4 10 Au+Au 62.4 GeV γN
0 20 40 60 80 100 120 Cu+Cu 62.4 GeVFig. 2. (color online) Event-by-event photon multiplicity distributions (solid circles) for Au+Au and Cu+Cu at √sNN = 62.4 and 200 GeV. The distributions for top
0–5% central Au+Au collisions and top 0–10% central Cu+Cu collisions are also shown (open circles). The photon multiplicity distributions for central collisions are observed to be Gaussian (solid line). Only statistical errors are shown.
variation). The error in Nγ due to (a) is estimated from Monte Carlo
sim-ulations to be ≤ 16% for all systems and beam energies studied. It is fairly independent of collision centrality. The error on Nγ due to (b) is estimated
using average gains for normalization and by studying the azimuthal depen-dence of the photon density, in an η window in the detector, and is found to be ∼ 10%. The total systematic error in Nγ is ∼19% for both central and
peripheral collisions and is similar for Au+Au and Cu+Cu at 62.4 and 200 GeV. The statistical errors are small and within the symbol size for the results shown in the figures.
Table 2
Gaussian fit parameters for photon multiplicity distributions for −3.7 < η < −2.3 for central Au+Au (0–5%) and Cu+Cu (0–10%) at √sNN = 62.4 and 200 GeV.
Collision Type hNparti hNγi σγ
Au+Au 62.4 GeV 347.3 252 30 Au+Au 200 GeV 352.4 582 52 Cu+Cu 62.4 GeV 96.4 73 13 Cu+Cu 200 GeV 99.0 140 26
3 Multiplicity Distributions
Figure 2 shows the photon multiplicity distributions for minimum bias Au+Au and Cu+Cu collisions at 62.4 and 200 GeV. The distributions for both ener-gies and colliding ion species show a characteristic shape with a rise at small multiplicity owing to peripheral events. This indicates the probability of occur-rence of peripheral collisions is higher. This rise is followed by a near plateau region with increasing photon multiplicity. This region is more prominent for Au+Au than Cu+Cu. It corresponds to mid-central collisions. There is a fall-off region in the distributions for the most central collisions. The shape of the distribution in the fall-off region is governed by intrinsic fluctuations in the measured quantity and on the limited acceptance. Also shown in Fig. 2 are event-by-event photon multiplicity distributions for central Au+Au (0– 5%) and Cu+Cu (0–10%) at √sNN = 62.4 and 200 GeV. The solid lines are
Gaussian fits to the data. The fit parameters are given in Table 2.
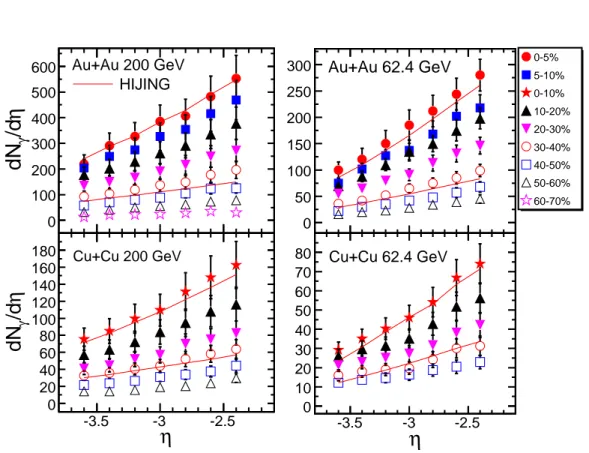
Figure 3 shows the pseudorapidity distributions of photons measured in the PMD for various collision centralities in Au+Au and Cu+Cu at √sNN = 62.4
and 200 GeV. As expected, the photon yield increases with decreasing |η|. The photon multiplicity is found to increase from peripheral to central collisions. Comparisons to HIJING calculations for central (0–5% for Au+Au and 0– 10% for Cu+Cu) and 30–40% mid-central collisions are also shown in the figure (solid curves). The HIJING results are in reasonable agreement with the data for both beam energies and colliding ion species. Similar conclusions are drawn for other centrality classes as well.
-3.5 -3 -2.5
η
/d
γdN
0 100 200 300 400 500 600 Au+Au 200 GeV HIJING -3.5 -3 -2.5 0 50 100 150 200 250 300 0-5% 5-10% 0-10% 10-20% 20-30% 30-40% 40-50% 50-60% 60-70% Au+Au 62.4 GeVη
-3.5 -3 -2.5η
/d
γdN
0 20 40 60 80 100 120 140 160 180 Cu+Cu 200 GeVη
-3.5 -3 -2.5 0 10 20 30 40 50 60 70 80 Cu+Cu 62.4 GeVFig. 3. (color online) Photon pseudorapidity distributions for Au+Au and Cu+Cu at √sNN = 62.4 and 200 GeV. The results for several centrality classes are shown.
The solid curves are results of HIJING simulations for central (0–5% for Au+Au and 0–10% for Cu+Cu) and 30–40% mid-central collisions. The errors shown are systematic, statistical errors are negligible in comparison.
4 Scaling of Photon Production
4.1 Scaling with hNparti
The scaling of particle multiplicity with hNparti indicates the dominance of soft
processes in particle production at RHIC, whereas scaling with average num-ber of binary collisions (hNbini) indicates the onset of hard processes (pQCD
jets). The PHENIX experiment first showed that at mid-rapidity, the charged particle production scales with a combination of hNparti and hNbini [4],
indi-cating significant contribution of hard processes in particle production. The PHOBOS experiment showed that such scaling has a pseudorapidity depen-dence [10]. At mid-rapidity (|η| < 1) particle production scales with a combi-nation of hNparti and hNbini; for the range 3 < |η| < 3.4 it scales with hNparti;
and for the region 5 < |η| < 5.4, the particle production per average number of participating nucleon pair decreases with increasing hNparti.
〉
part
N
〈
0
100
200
300
)
〉
part
N
〈
/ ( 0.5
γ
N
0
1
2
3
4
5
6
Au+Au 200 GeV Au+Au 62.4 GeV Cu+Cu 200 GeV Cu+Cu 62.4 GeV HIJING HIJING〉
part
N
〈
0
100
200
300
)
〉
part
N
〈
N / ( 0.5
0
1
2
3
4
5
6
7
8
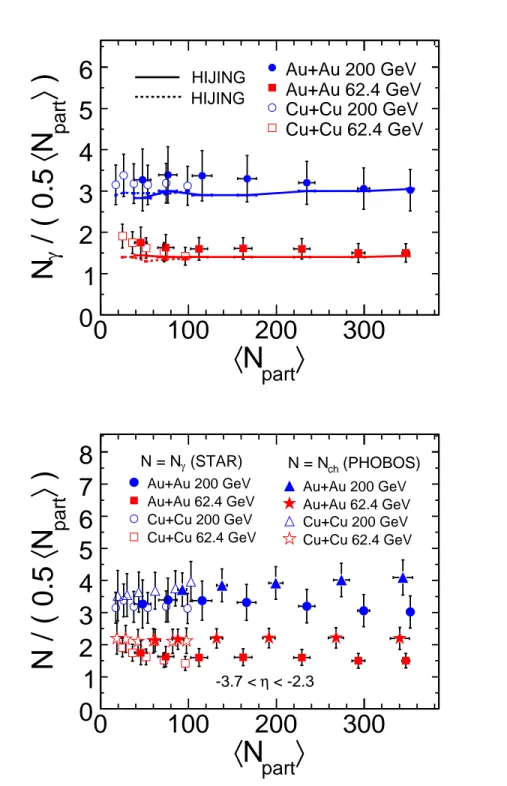
Au+Au 200 GeV Au+Au 62.4 GeV Cu+Cu 200 GeV Cu+Cu 62.4 GeV Au+Au 200 GeV Au+Au 62.4 GeV Cu+Cu 200 GeV Cu+Cu 62.4 GeV (STAR) γ N = N N = Nch (PHOBOS) < -2.3 η -3.7 <Fig. 4. (color online) Top panel: The number of photons divided by hNparti/2 as
a function of average number of participating nucleons for Au+Au and Cu+Cu at √s
NN = 62.4 and 200 GeV for −3.7 < η < −2.3 . Errors shown are systematic only
and include those for hNparti. Results from HIJING are shown as lines (solid for
Au+Au and dashed for Cu+Cu). Bottom panel: Same as above, for both photons and charged particles from PHOBOS [10].
Figure 4 (top panel) shows the variation of photon multiplicity per average number of participating nucleon pair with hNparti for Au+Au and Cu+Cu at
62.4 and 200 GeV within the range −3.7 < η < −2.3. We observe that within the systematic errors, the photon multiplicity scales with hNparti at forward
rapidities. This indicates that the photon production at forward rapidities is due to soft processes. For collisions with similar hNparti, the photon
multiplic-ity is similar for Au+Au and Cu+Cu at a given beam energy. Also shown in the figure are results from HIJING (solid lines for Au+Au and dashed lines for Cu+Cu). Considering the systematic errors shown, the HIJING results compare well with the data for most of the collision centralities studied. Figure 4 (bottom panel) shows the comparison of photon multiplicity per average number of participating nucleon pair vs. hNparti and the corresponding
data for charged particles from the PHOBOS experiment for the range −3.7 < η < −2.3. Like photon production, the charged particle multiplicity at forward rapidities is found to scale with hNparti. For similar hNparti, the charged particle
production in the region −3.7 < η < −2.3 is also found to be similar for Au+Au and Cu+Cu at a given beam energy. The photon production per average number of participating nucleon pair is slightly lower compared to that for charged particles. A constant straight line combined fit to the charged particle results for Au+Au and Cu+Cu in Fig. 4 at √sNN = 200 GeV gives 3.8
± 0.2, while that for photons yields 3.2 ± 0.1. For√sNN = 62.4 GeV the values
are 2.2 ± 0.1 and 1.6 ± 0.05 for charged particles and photons, respectively. The difference may be due to the contribution of protons to charged particles at forward rapidity. The measurements (−3.7 < η < −2.3) are carried out close to the fragmentation region, where protons play an increasingly larger role [13,22]. The ratio of the number of charged particles to photons in the range −3.7 < η < −2.3 is found to be 1.4 ± 0.1 and 1.2 ± 0.1 for √sNN =
62.4 GeV and 200 GeV, respectively.
4.2 Longitudinal Scaling
Previously it was reported that both charged particle [10,11] and photon pseu-dorapidity density [12,13], normalized by the average number of participating nucleon pairs as a function of η − ybeam, where ybeam is the beam rapidity, is
independent of beam energy. Further, it was observed that such longitudinal scaling was centrality dependent for charged particles, but was centrality inde-pendent for photons [12,13]. Figure 5 shows the photon pseudorapidity density normalized by the average number of participating nucleon pairs as a function of η − ybeam, for selected centralities (for the sake of clarity) for Au+Au and
Cu+Cu at √sNN = 62.4 and 200 GeV. The ybeam values for 62.4 and 200 GeV
are −4.19 and −5.36, respectively. The Cu+Cu results are shifted by 0.1 units in η for sake of clarity. The solid line is a second order polynomial of the form
beam
- y
η
0
1
2
3
)
〉
partN
〈
/ ( 0.5
η
/ d
γdN
0
1
2
3
4
5
Au+Au 10-20% Au+Au 20-30% Cu+Cu 10-20% Cu+Cu 20-30% 62.4 GeV 200 GeVbeam
- y
η
0
1
2
3
)
〉
partN
〈
/ ( 0.5
η
/ d
γdN
0
1
2
3
4
5
Au+Au 30-40% Au+Au 40-50% Cu+Cu 30-40% Cu+Cu 40-50% 62.4 GeV 200 GeVFig. 5. (color online) Photon pseudorapidity distributions normalized by the average number of participating nucleon pairs for different collision centralities are plotted as a function of pseudorapidity shifted by the beam rapidity (−5.36 for 200 GeV and −4.19 for 62.4 GeV) for Au+Au and Cu+Cu collisions at √sNN = 62.4 and
200 GeV. Errors are systematic only, statistical errors are negligible in comparison. For clarity of presentation, results for only four centralities are shown. The Cu+Cu data are shifted by 0.1 unit in η − y . The solid line is a second order polynomial
0.54 + 0.22(η − ybeam) + 0.23(η − ybeam)2, fitted to all the data of Fig. 5.
A fit to the ratio of data to this function for the results in the upper panel yields a value of 0.96 ± 0.01 and those on the lower panel yields 1.03 ± 0.01. The results demonstrate that the longitudinal scaling for produced photons is independent of colliding ion species. In addition we re-confirm that such scaling for photons is independent of beam energy and collision centrality as reported earlier [12,13].
5 Summary
Photon multiplicity distributions are measured at forward rapidity (−3.7 < η < −2.3) for Au+Au and Cu+Cu collisions at √sNN = 62.4 and 200 GeV
using the photon multiplicity detector in the STAR experiment at RHIC. As expected, the photon yield increases with decreasing |η| (towards mid-rapidity), and is larger for collisions at higher energies. The photon multiplic-ity per participating nucleon pair is observed to be independent of collision centrality indicating that photon production is dominated by soft processes. A similar observation is made for charged particles, although their production is slightly higher. This slightly higher production of charged particles than photons could be due to the contribution of baryons to the charged particles, which may come from baryon transport and contribution from beam protons. On the other hand, photons are mainly from the decay of mesons (π0). For
collisions with similar average number of participating nucleons, the photon yields are similar for Au+Au and Cu+Cu for a given colliding beam energy. The photon production per unit rapidity per average number of participating nucleon pair vs. η − ybeam shows longitudinal scaling which is independent of
beam energy, collision centrality and colliding ion species.
We thank the RHIC Operations Group and RCF at BNL, the NERSC Center at LBNL and the Open Science Grid consortium for providing resources and support. This work was supported in part by the Offices of NP and HEP within the U.S. DOE Office of Science, the U.S. NSF, the Sloan Foundation, the DFG cluster of excellence ‘Origin and Structure of the Universe’, CNRS/IN2P3, STFC and EPSRC of the United Kingdom, FAPESP CNPq of Brazil, Ministry of Ed. and Sci. of the Russian Federation, NNSFC, CAS, MoST, and MoE of China, GA and MSMT of the Czech Republic, FOM and NWO of the Netherlands, DAE, DST, and CSIR of India, Polish Ministry of Sci. and Higher Ed., Korea Research Foundation, Ministry of Sci., Ed. and Sports of the Rep. Of Croatia, Russian Ministry of Sci. and Tech, and RosAtom of Russia.
References
[1] BRAHMS Collaboration, I. Arsene et al., Nucl. Phys. A 757 (2005) 1; PHOBOS Collaboration, B. B. Back et al., Nucl. Phys. A 757 (2005) 28; STAR Collaboration, J. Adams et al., Nucl. Phys. A 757 (2005) 102; PHENIX Collaboration, K. Adcox et al., Nucl. Phys. A 757 (2005) 184.
[2] H. Heiselberg, Phys. Rep. 351 (2001) 161; WA98 Collaboration, M. M. Aggarwal
et al., Phys. Rev. C 65 (2002) 054912.
[3] B. Mohanty and J. Serreau, Phys. Rep. 414 (2005) 263; WA98 Collaboration, M. M. Aggarwal et al., Phys. Rev. C 64 (2001) 011901(R).
[4] PHENIX Collaboration, K. Adcox et al., Phys. Rev. Lett. 86 (2001) 3500.
[5] L. V. Gribov, E. M. Levin and M. G. Ryskin, Phys. Rep. 100 (1983) 1; J. P. Blaizot and A. H. Mueller, Nucl. Phys. B 289 (1987) 847.
[6] L. McLerran and R. Venugopalan, Phys. Rev. D 49 (1994) 2233; L. McLerran and R. Venugopalan, Phys. Rev. D 50 (1994) 2225; Y. V. Kovchegov, Phys. Rev. D 54 (1996) 5463; E. Iancu and L. McLerran, Phys. Lett. B 510 (2001) 145; A. Krasnitz and R. Venugopalan, Phys. Rev. Lett. 84 (2000) 4309.
[7] J. D. Bjorken, Phys. Rev. D 27 (1983) 140; L. D. Landau, Izv. Akad. Nauk Ser. Fiz. 17 (1953) 51; S. Belenkij and L. D. Landau, Usp. Fiz. Nauk. 56 (1955) 309; Nuovo Cim. Suppl. 3S10 (1956) 15; R. C. Hwa and K. Kajantie, Phys. Rev. D 32 (1985) 1109; J. Alam et al., Annals of Phys. 286 (2000) 159; B. Mohanty and J. Alam, Phys. Rev. C 68 (2003) 064903.
[8] P. K. Netrakanti and B. Mohanty, Phys. Rev. C 71 (2005) 047901; J. Aichelin and K. Werner, Phys. Lett. B 300 (1993) 158.
[9] J. Benecke et al., Phys. Rev. 188 (1969) 2159.
[10] PHOBOS Collaboration, B.B. Back et al., Phys. Rev. Lett. 87 (2001) 102303. PHOBOS Collaboration, B. B. Back et al., Phys. Rev. Lett. 91 (2003) 052303.
[11] BRAHMS Collaboration, I. G. Bearden et al., Phys. Lett. B 523 (2001) 227; BRAHMS Collaboration, I. G. Bearden et al., Phys. Rev. Lett. 88 (2002) 202301.
[12] STAR Collaboration, J. Adams et al., Phys. Rev. Lett. 95 (2005) 062301; P. K. Netrakanti, Ph. D. Thesis, Jadavpur University (2008); M. Sharma, Ph. D. Thesis, Panjab University (2008); N. Gupta, Ph. D. Thesis, Jammu University (2008); D. Das, Ph. D. Thesis, Jadavpur University (2008); and S. M. Dogra, Ph. D. Thesis, Jammu University (2009). http://drupal.star.bnl.gov/STAR/theses. [13] STAR Collaboration, J. Adams et al., Phys. Rev. C 73 (2006) 034906.
[14] K. H. Ackermann et al., Nucl. Instr. Meth. A 499 (2003) 624. [15] X-N. Wang and M. Gyulassy, Phys. Rev. D 44 (1991) 3501.
[16] B. Zhang, C. M. Ko, B. A. Li, and Z. Lin, Phys. Rev. C 61 (2000) 067901. [17] M. M. Aggarwal et al., Nucl. Instr. Meth. A 499 (2003) 751; M. M. Aggarwal
et al., Nucl. Instr. Meth. A 488 (2002) 131.
[18] F. S. Bieser et al., Nucl. Instr. Meth. A 499 (2003) 766.
[19] STAR Collaboration, B. I. Abelev et al., Phys. Rev. C 79 (2009) 034909. [20] WA98 Collaboration, M. M. Aggarwal et al., Phys. Lett. B 458 (1999) 422.
[21] V. Fine and P. Nevski, in Proceedings of CHEP-2000, Padova, Italy.
[22] BRAHMS Collaboration, I. G. Bearden et al., Phys. Rev. Lett. 93 (2004) 102301; BRAHMS Collaboration, I. C. Arsene et al., arXiv: 0901.0872v1 [nucl-ex].