HAL Id: hal-01512004
https://hal.archives-ouvertes.fr/hal-01512004
Submitted on 21 Apr 2017
HAL is a multi-disciplinary open access
archive for the deposit and dissemination of
sci-entific research documents, whether they are
pub-lished or not. The documents may come from
teaching and research institutions in France or
abroad, or from public or private research centers.
L’archive ouverte pluridisciplinaire HAL, est
destinée au dépôt et à la diffusion de documents
scientifiques de niveau recherche, publiés ou non,
émanant des établissements d’enseignement et de
recherche français ou étrangers, des laboratoires
publics ou privés.
Kieffer in France
Stéphanie Jacquet, Karine Huber, Hélène Guis, Marie-Laure Setier-Rio, Maria
Goffredo, Xavier Allène, Ignace Rakotoarivony, Christine Chevillon, Jérémy
Bouyer, Thierry Baldet, et al.
To cite this version:
Stéphanie Jacquet, Karine Huber, Hélène Guis, Marie-Laure Setier-Rio, Maria Goffredo, et al..
Spatio-temporal genetic variation of the biting midge vector species Culicoides imicola (Ceratopogonidae)
Kieffer in France. Parasites and Vectors, BioMed Central, 2016, 9 (1), 12 p.
�10.1186/s13071-016-1426-4�. �hal-01512004�
R E S E A R C H
Open Access
Spatio-temporal genetic variation of the
biting midge vector species Culicoides
imicola (Ceratopogonidae) Kieffer in France
Stéphanie Jacquet
1,2,3*, Karine Huber
1,4, Hélène Guis
1, Marie-Laure Setier-Rio
5, Maria Goffredo
6, Xavier Allène
1,
Ignace Rakotoarivony
1, Christine Chevillon
2,3, Jérémy Bouyer
1, Thierry Baldet
1, Thomas Balenghien
1and Claire Garros
1Abstract
Background: Introduction of vector species into new areas represents a main driver for the emergence and worldwide spread of vector-borne diseases. This poses a substantial threat to livestock economies and public health. Culicoides imicola Kieffer, a major vector species of economically important animal viruses, is described with an apparent range expansion in Europe where it has been recorded in south-eastern continental France, its known northern distribution edge. This questioned on further C. imicola population extension and establishment into new territories. Studying the spatio-temporal genetic variation of expanding populations can provide valuable information for the design of reliable models of future spread.
Methods: Entomological surveys and population genetic approaches were used to assess the spatio-temporal population dynamics of C. imicola in France. Entomological surveys (2–3 consecutive years) were used to evaluate population abundances and local spread in continental France (28 sites in the Var department) and in Corsica (4 sites). We also genotyped at nine microsatellite loci insects from 3 locations in the Var department over 3 years (2008, 2010 and 2012) and from 6 locations in Corsica over 4 years (2002, 2008, 2010 and 2012).
Results: Entomological surveys confirmed the establishment of C. imicola populations in Var department, but indicated low abundances and no apparent expansion there within the studied period. Higher population abundances were recorded in Corsica. Our genetic data suggested the absence of spatio-temporal genetic changes within each region but a significant increase of the genetic differentiation between Corsican and Var populations through time. The lack of intra-region population structure may result from strong gene flow among populations. We discussed the observed temporal variation between Corsica and Var as being the result of genetic drift following introduction, and/or the genetic characteristics of populations at their range edge.
Conclusions: Our results suggest that local range expansion of C. imicola in continental France may be slowed by the low population abundances and unsuitable climatic and environmental conditions.
Keywords: Culicoides, Distribution range, Spatio-temporal, Population genetics, Entomological survey, Mediterranean basin
* Correspondence:stephanie.jacquet@cirad.fr
1
Cirad, UMR15 Contrôle des Maladies Animales Exotiques et Emergentes, Campus International de Baillarguet, TA-A15/G, 34398 Montpellier, France
2UMR 5290 Maladies Infectieuses & Vecteurs-Ecologie, Génétique, Ecologie,
Contrôle (MIVEGEC), CNRS, Université de Montpellier, Montpellier, France Full list of author information is available at the end of the article
© 2016 Jacquet et al. Open Access This article is distributed under the terms of the Creative Commons Attribution 4.0 International License (http://creativecommons.org/licenses/by/4.0/), which permits unrestricted use, distribution, and reproduction in any medium, provided you give appropriate credit to the original author(s) and the source, provide a link to the Creative Commons license, and indicate if changes were made. The Creative Commons Public Domain Dedication waiver (http://creativecommons.org/publicdomain/zero/1.0/) applies to the data made available in this article, unless otherwise stated.
Background
Range expansions are increasingly frequent in the history of many, if not most, species [1]. The growing rate of such phenomena and the associated consequences could be ter-ribly alarming when concerning arthropod vector species. Introduction of vector species into new areas can lead to the emergence and spread of human and animal vector-borne pathogens, posing substantial threat to public health and livestock economy. Although most range expansions are linked to anthropogenic influences such as intercontin-ental commerce and travel (e.g. ship, boat, aircraft, high-ways), species introductions can also occur by natural dispersal of the organisms or passive transport by winds (e.g. [2–4]). The dynamics of range expansion results from the interaction of ecological and evolutionary factors. These factors are most often analysed at a spatial scale while the temporal scale is overlooked. Assessing the drivers involved in range expansion can help in designing reliable predictive models of future spread. In particular, the study of spatio-temporal genetic variation of expanding populations can yield insights into their dispersion rates and patterns of spread, which in turn can prompt the processes underlying their establishment and persistence [5].
In this study, we investigated the spatio-temporal popu-lation dynamics of the biting midge Culicoides imicola Kieffer (Diptera: Ceratopogonidae) at its northern distri-butional edge in France. This species is known as the main afrotropical vector of Orbiviruses including bluetongue virus (BTV) and African horse sickness virus (AHSV) in Africa and the Middle-East [6]. Culicoides imicola was de-scribed as expanding its range northward in the Mediter-ranean basin, however, recent genetic studies suggest that the species has been present and established for a long time in the Mediterranean region [7, 8]. Nevertheless, if the settlement of C. imicola populations in most parts of the Mediterranean region is an old story [7], extensive en-tomological surveillance performed in continental France since 2002 following BTV emergence in Corsica Island suggests a recent northward expansion of the species at the northern edge of its distribution [9].
Following the record of C. imicola in the island of Sar-dinia (Italy), the species was collected for the first time in the French island of Corsica in 2000 [10]. These findings were confirmed by subsequent extensive entomological surveys undertaken from 2002 onwards [9, 11, 12]. Popu-lations are found to be widely distributed throughout Cor-sica notably on the littoral zone, with high abundances (reaching 12,000 captured individuals per night during the first observations) [9], suggesting that C. imicola is well established in the island. Given the short distance between continental France and Corsica (180 km), a wide entomo-logical surveillance network was implemented in 2002 in continental France along the Mediterranean coast to in-vestigate the spread from Corsica. In 2003, the first C.
imicola individuals were captured (two individuals) in south-eastern continental France, in Var and Alpes-Maritimes departments [9]. Despite subsequent add-itional surveys around the two positive sites, settled populations of C. imicola were not recorded [9]. In 2004, five more individuals were collected in the Var department; the next years witnessed records of other established pop-ulations of C. imicola [9]. The status of established popula-tion was based on the number of positive sites for at least two consecutive years with more than ten captured parous and/or blood-fed females [9]. The first collected individ-uals of C. imicola in the Var department coincided with a year of high abundance of the species in the north-eastern part of Corsica [9]. The authors hypothesized that Cor-sican emigrants of the species had most likely colonized the Var department through its high passive wind-mediated dispersal capacity. This was supported by genetic analyses based on microsatellite and mitochondrial markers which indicated strong genealogical relationships between populations of C. imicola from the Var depart-ment and Corsica [Jacquet S et al. Range expansion of the Bluetongue vector Culicoides imicola in continental France thanks to meteorological events (submitted)].
To date, the species distribution has reached its most northern distribution edge in the south-east of the Var de-partment. Since the first records, population abundance is low in this zone (maximum catch < 200 individuals col-lected per night) [9]. In 2008, a new record of C. imicola in south-western continental France, in the littoral zone of the Pyrénées-Orientales department, confirmed the ability of this species to continue expanding its range and colonize new habitats [Jacquet S et al. Range expansion of the Bluetongue vector Culicoides imicola in continental France thanks to meteorological events (submitted)]. A combination of high population abundances and suitable wind dispersal capacity has been shown to contribute to the successful range expansion of this species [Jacquet S et al. Range expansion of the Bluetongue vector Culicoides imicola in continental France thanks to meteorological events (submitted)]. Besides, an ecoclimatic niche model predicted new suitable habitats under climate change for C. imicola populations in Europe [13].
In this paper, we further investigated the processes underlying the range expansion of C. imicola at a local scale in France. We updated the distribution and abundance of C. imicola in Corsica and Var department. We described the fine scale spatio-temporal genetic structuring of the populations of this vector species. Particularly, we focused on the levels of genetic diversity and differentiation between the range margin (Var department) and a more central distribution (Corsica and Sardinia) of C. imicola. The results were jointly interpreted to describe C. imicola population dynamics in these regions.
Methods
Entomological surveys
To carry on the evaluation of settlement (presence/absence in sampled sites) and spatial expansion of C. imicola in Var and Alpes Maritimes departments, we continued the yearly surveillance network presented in [9]. Entomological sur-veys were carried out in twenty-eight and twenty-nine sites respectively in 2011 and 2012 (Fig. 1, Additional file 1: Table S2). Population abundance in the Var department was assessed for the period 2003–2014. Moreover, four sites were sampled in Corsica in 2010 and 2012 (Fig. 2, Additional file 1: Table S3) in order to survey population abundances. Most of these sites have been surveyed be-tween 2003–2010 and 2002–2008 in the Var department and Corsica, respectively, in [9]. All sites in the Var depart-ment were sampled once a year during the end of sum-mer/early autumn (September/October) to match the abundance peak of C. imicola [9]. In Corsica, sites were surveyed weekly (February-April, November-December) and monthly (January, May-October) with a single night collection.
Population genetics collection
For genetic analyses, C. imicola samples collected from six sites over four years in Corsica (2002, 2008, 2010 and 2012), and from three sites over four years in the Var de-partment (2006, 2008, 2010 and 2012) were selected (Fig. 3, Table 1). Genetic comparisons between Corsican and Var populations were conducted for the paired years. One loca-tion sampled in 2012 from Sardinia was also included (Table 1). Adult midges were caught using black-light suc-tion traps (Onderstepoort design) placed near or inside ani-mal shelters containing sheep, cattle or horses. Specimens were stored in 90 % ethanol and C. imicola individuals were identified and sexed under a binocular microscope using morphological determination keys [10].
Microsatellite genotyping
Genomic DNA was extracted from each single midge using the NucleoSpin96 Tissue Kit (Macherey-Nagel, Duren, Germany), according to the manufacturer’s instructions, starting with an additional step where each individual midge was ground in 200μL of 1X PBS buffer. Each insect (~32 individuals per site) was genotyped at nine microsatellite markers previously developed for C. imicola [8] (Additional file 1: Table S1) following the protocol described in [7].
Microsatellite analyses
Genetic diversity and equilibrium testing
Linkage disequilibrium between all pairs of loci and devia-tions from Hardy-Weinberg, i.e. significant deviation of the inbreeding coefficient FIS from zero, were tested with
FSTAT v2.9.3.2 [14]. The significance of FISwas assessed by
randomizing alleles among individuals within samples (10,000 permutations). Level of genetic diversity within samples per year was quantified by computing the allelic richness (AR) and the mean observed heterozygosity (HO)
[15] with FSTAT v2.9.3.2 [14]. We used a non-parametric Mann-Whitney-Wilcoxon statistical test in R software v.3.1.2 [16] to check for any differences in levels of allelic richness between Corsican and Var populations.
To test whether populations are in mutation-equilibrium, we performed tests of heterozygosity excess [17] imple-mented in BOTTLENECK v.1.2.02 [18]. It has been shown that past bottleneck events will be detected with a high de-gree of sensitivity using the Infinite Allele Mutation (IAM) model, moderately with the Two-phase Model (TMM) and dimly with the Stepwise Mutation Model (SMM) [17]. Het-erozygosity excess was tested under all three mutation models. For the TPM model the proportion of SMM was set to 70 % and the variance to 30 (default values). The significance was assessed by performing 10,000 replicates. The Wilcoxon’s signed-rank statistics were used to evaluate
any deviation of the observed heterozygosity from the expectation under mutation-drift equilibrium.
Population structure
Genetic relationships between samples were visualized by a neighbor-joining tree (NJ) tree [19] based on the pairwise genetic distances of Cavalli-Sforza and Edwards [20] using the software POPULATIONS v.1.2.30 (http:// bioinformatics.org/~tryphon/populations/). The robust-ness of the tree topology was evaluated by bootstrapping 10,000 times over loci.
Genetic variation and population structuring was also in-vestigated by undertaking a Principal Component Analysis (PCA) using PCA-GEN v.1.2.1 software [21]. This analysis correlates genotypes and allele frequencies among individ-uals, without any assumption of equilibrium within popula-tions, to define variables (components) that can characterize the neutral genetic variation among populations. The statis-tical significance associated with each axis was evaluated after 10,000 randomizations.
The genetic structure of C. imicola was then assessed using the Bayesian clustering method implemented in
STRUCTURE v.2.3.3 software [22] which ascertains popu-lation membership of individuals according to their geno-types. We assumed an admixture model and correlated allele frequencies and used the sampling location as prior information. Each run consisted of a burn-in of 105Markov chain Monte Carlo (MCMC) iterations, followed by 106 it-erations. Ten replicates were carried out for each number K of genetic clusters set between 1 and 9. The accurate number of clusters was inferred with theΔK method [23]. The relative importance of the genetic clusters previously inferred by STRUCTURE and the population differenti-ation was assessed with the multi-locus hierarchical F-statistics. We tested if the genetic patterns were explained by the geography and/or the collection dates by grouping hierarchically the samples according to their origin (Corsica vs Var department), then their collection year. We then per-formed the test separately within Corsica and Var depart-ments: samples were grouped hierarchically according to their collection year to assess any genetic significant differ-entiation during the time studied. This analysis was per-formed with Hierfstat package [24]. These tests were based on 10,000 permutations of either Culicoides genotypes
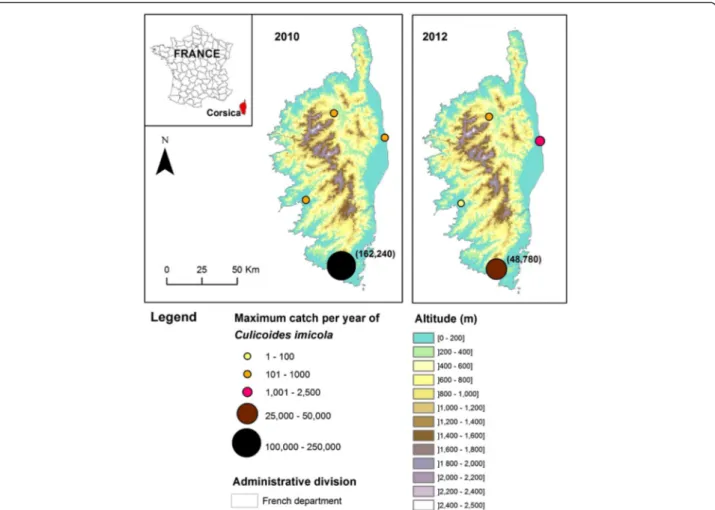
Fig. 2 Collection sites in Corsica with maximum catches of Culicoides imicola per year in 2010 and 2012. Population abundance maps from 2003 to 2009 were previously published in [9]
among populations, within groups (i.e. collection dates) and within clusters (i.e. Corsica and Var department; H0: ‘Fpo-pulations-cluster = 0’), or populations among clusters (H0: ‘Fclusters-total = 0’).
The software FSTAT v2.9.3.2 was used for assessing the level of genetic differentiation among populations through the Weir and Cockerham [25]’s unbiased estimates of FST.
These analyses were performed per year over the total sampling set available (encompassing thus Corsica and
Var). A significant deviation of FSTfrom zero was tested
using the exact G test over 10,000 permutations of geno-types among samples. Global FSTvalue was estimated over
all sampled sites (Corsica and Var) in either 2008 or 2012 (i.e., two years when the sampling sets included the exact same sampled sites). A statistical non-parametric Wilcoxon signed test with continuity correction implemented in R software v.3.1.2 [16] was used to test whether the genetic differentiation between Corsican and Var populations has
Fig. 3 Sampled sites of C. imicola used for population genetic analyses
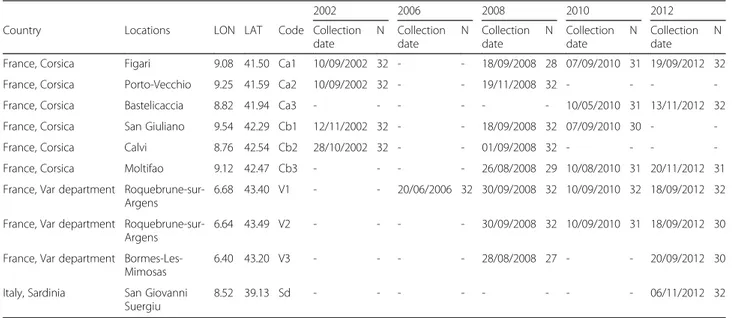
Table 1 Geographical location of C. imicola sampled sites for the population genetics study
2002 2006 2008 2010 2012
Country Locations LON LAT Code Collection
date N Collection date N Collection date N Collection date N Collection date N
France, Corsica Figari 9.08 41.50 Ca1 10/09/2002 32 - - 18/09/2008 28 07/09/2010 31 19/09/2012 32
France, Corsica Porto-Vecchio 9.25 41.59 Ca2 10/09/2002 32 - - 19/11/2008 32 - - -
-France, Corsica Bastelicaccia 8.82 41.94 Ca3 - - - 10/05/2010 31 13/11/2012 32
France, Corsica San Giuliano 9.54 42.29 Cb1 12/11/2002 32 - - 18/09/2008 32 07/09/2010 30 -
-France, Corsica Calvi 8.76 42.54 Cb2 28/10/2002 32 - - 01/09/2008 32 - - -
-France, Corsica Moltifao 9.12 42.47 Cb3 - - - - 26/08/2008 29 10/08/2010 31 20/11/2012 31
France, Var department Roquebrune-sur-Argens
6.68 43.40 V1 - - 20/06/2006 32 30/09/2008 32 10/09/2010 32 18/09/2012 32 France, Var department
Roquebrune-sur-Argens
6.64 43.49 V2 - - - - 30/09/2008 32 10/09/2010 31 18/09/2012 30
France, Var department Bormes-Les-Mimosas
6.40 43.20 V3 - - - - 28/08/2008 27 - - 20/09/2012 30
Italy, Sardinia San Giovanni Suergiu
8.52 39.13 Sd - - - 06/11/2012 32
N is the number of individuals typed for microsatellite analyses The dashes indicate the absence of data
significantly increased over time. Specifically we tested if the genetic differentiation (based on FST values) in 2012
was significantly higher than in 2008.
Isolation by distance
To test whether patterns of neutral genetic structure of C. imicola Corsican and Var populations were related to geographic distance, we performed partial Mantel tests implemented in the online program GENEPOP v.4.2 [26, 27]. These tests were conducted separately for the years 2008 and 2012. The significance of the regression between the logarithmic geographic distances and the pairwise values of FST/ (1 - FST) was assessed with 100,000
permutations.
Results
Entomological surveys
A total of twenty-eight and twenty-nine sites were surveyed in 2011 and 2012 respectively (Additional file 1: Table S2). In 2011, three out of the twenty-eight sites studied were previously recorded positive in [9] and were positive for a second consecutive year (Fig. 1). In 2012, eight new positive sites were recorded (Fig. 1). The compiled maximum catch per year of C. imicola between 2003 and 2014 showed low abundances in the Var department since the maximum did not exceed 4,500 individuals per site and night (Fig. 4). In Corsica, C. imicola population abundances were always high in the most southern site, as it was recorded before in [9], reaching a maximum of about 160,000 C. imicola caught per night in 2010. The three other sites exhibited
relatively low abundance, never exceeding 2,500 individuals caught per night for the three studied years (Fig. 2).
For genetic analyses, a total of 809 individuals from six sites sampled over four years (2002, 2008, 2010 and 2012) in Corsica and from three sites collected over four years (2006, 2008, 2010 and 2012) in the Var department were ge-notyped and analysed (27–32 individuals per site; Table 1).
Microsatellite analyses
Within population genetic diversity through time
Pairwise allelic tests of linkage disequilibrium indicated that loci were physically unlinked and statistically independent within populations (P-value > 0.0013 after Bonferroni cor-rection). Fisher’s exact test revealed that genotypic frequen-cies were in accordance with Hardy-Weinberg equilibrium for all populations (P-value > 0.0002 after Bonferroni cor-rection), FISvalues ranged from−0.075 to 0.140 (Table 2).
Levels of genetic diversity remained stable over popula-tions and over years (Table 2). In Corsica, the allelic rich-ness (AR) varied from 4.188 to 4.725 and the mean
heterozygosity (HO) ranged from 0.523 to 0.616. Both
measures were comparable in Sardinia with an allelic richness equal to 4.512 and a mean heterozygosity of 0.560. In the Var department, the allelic richness extended from 3.481 to 4.214 and the mean observed heterozygosity varied from 0.515 to 0.609. Interestingly, the allelic richness was statistically lower in the Var department than in Corsica (P < 0.0001).
Spatio-temporal genetic changes in population structure
A spatial genetic structure was detected between, on the one hand, the group formed of Corsican and Sardinian populations, and on the other hand, the continental popu-lations from the Var department. The Bayesian clustering
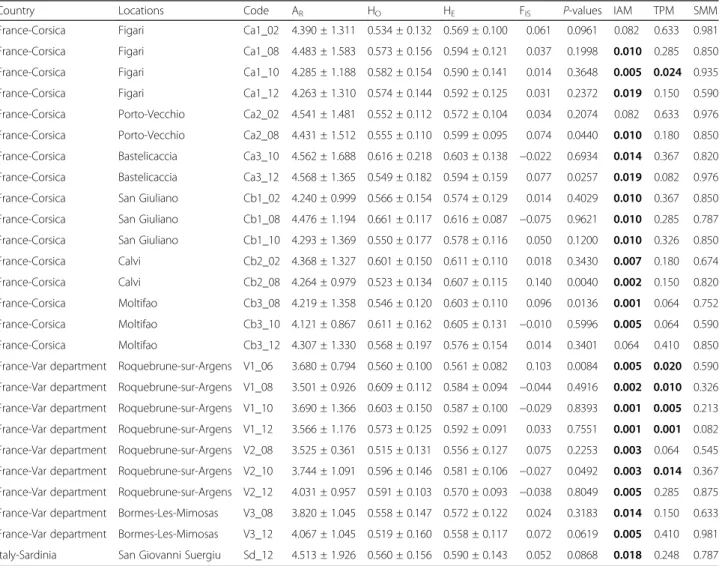
Table 2 Genetic diversity and bottleneck results based on microsatellite data for each sampled site
Country Locations Code AR HO HE FIS P-values IAM TPM SMM
France-Corsica Figari Ca1_02 4.390 ± 1.311 0.534 ± 0.132 0.569 ± 0.100 0.061 0.0961 0.082 0.633 0.981 France-Corsica Figari Ca1_08 4.483 ± 1.583 0.573 ± 0.156 0.594 ± 0.121 0.037 0.1998 0.010 0.285 0.850 France-Corsica Figari Ca1_10 4.285 ± 1.188 0.582 ± 0.154 0.590 ± 0.141 0.014 0.3648 0.005 0.024 0.935 France-Corsica Figari Ca1_12 4.263 ± 1.310 0.574 ± 0.144 0.592 ± 0.125 0.031 0.2372 0.019 0.150 0.590 France-Corsica Porto-Vecchio Ca2_02 4.541 ± 1.481 0.552 ± 0.112 0.572 ± 0.104 0.034 0.2074 0.082 0.633 0.976 France-Corsica Porto-Vecchio Ca2_08 4.431 ± 1.512 0.555 ± 0.110 0.599 ± 0.095 0.074 0.0440 0.010 0.180 0.850 France-Corsica Bastelicaccia Ca3_10 4.562 ± 1.688 0.616 ± 0.218 0.603 ± 0.138 −0.022 0.6934 0.014 0.367 0.820 France-Corsica Bastelicaccia Ca3_12 4.568 ± 1.365 0.549 ± 0.182 0.594 ± 0.159 0.077 0.0257 0.019 0.082 0.976 France-Corsica San Giuliano Cb1_02 4.240 ± 0.999 0.566 ± 0.154 0.574 ± 0.129 0.014 0.4029 0.010 0.367 0.850 France-Corsica San Giuliano Cb1_08 4.476 ± 1.194 0.661 ± 0.117 0.616 ± 0.087 −0.075 0.9621 0.010 0.285 0.787 France-Corsica San Giuliano Cb1_10 4.293 ± 1.369 0.550 ± 0.177 0.578 ± 0.116 0.050 0.1200 0.010 0.326 0.850 France-Corsica Calvi Cb2_02 4.368 ± 1.327 0.601 ± 0.150 0.611 ± 0.110 0.018 0.3430 0.007 0.180 0.674 France-Corsica Calvi Cb2_08 4.264 ± 0.979 0.523 ± 0.134 0.607 ± 0.115 0.140 0.0040 0.002 0.150 0.820 France-Corsica Moltifao Cb3_08 4.219 ± 1.358 0.546 ± 0.120 0.603 ± 0.110 0.096 0.0136 0.001 0.064 0.752 France-Corsica Moltifao Cb3_10 4.121 ± 0.867 0.611 ± 0.162 0.605 ± 0.131 −0.010 0.5996 0.005 0.064 0.590 France-Corsica Moltifao Cb3_12 4.307 ± 1.330 0.568 ± 0.197 0.576 ± 0.154 0.014 0.3401 0.064 0.410 0.850 France-Var department Roquebrune-sur-Argens V1_06 3.680 ± 0.794 0.560 ± 0.100 0.561 ± 0.082 0.103 0.0084 0.005 0.020 0.590 France-Var department Roquebrune-sur-Argens V1_08 3.501 ± 0.926 0.609 ± 0.112 0.584 ± 0.094 −0.044 0.4916 0.002 0.010 0.326 France-Var department Roquebrune-sur-Argens V1_10 3.690 ± 1.366 0.603 ± 0.150 0.587 ± 0.100 −0.029 0.8393 0.001 0.005 0.213 France-Var department Roquebrune-sur-Argens V1_12 3.566 ± 1.176 0.573 ± 0.125 0.592 ± 0.091 0.033 0.7551 0.001 0.001 0.082 France-Var department Roquebrune-sur-Argens V2_08 3.525 ± 0.361 0.515 ± 0.131 0.556 ± 0.127 0.075 0.2253 0.003 0.064 0.545 France-Var department Roquebrune-sur-Argens V2_10 3.744 ± 1.091 0.596 ± 0.146 0.581 ± 0.106 −0.027 0.0492 0.003 0.014 0.367 France-Var department Roquebrune-sur-Argens V2_12 4.031 ± 0.957 0.591 ± 0.103 0.570 ± 0.093 −0.038 0.8049 0.005 0.285 0.875 France-Var department Bormes-Les-Mimosas V3_08 3.820 ± 1.045 0.558 ± 0.147 0.572 ± 0.122 0.024 0.3183 0.014 0.150 0.633 France-Var department Bormes-Les-Mimosas V3_12 4.067 ± 1.045 0.519 ± 0.160 0.558 ± 0.117 0.072 0.0619 0.005 0.410 0.981 Italy-Sardinia San Giovanni Suergiu Sd_12 4.513 ± 1.926 0.560 ± 0.156 0.590 ± 0.143 0.052 0.0868 0.018 0.248 0.787
The allelic richness (AR), observed (HO) and expected (HE) heterozygosity and FISare presented for each population. ARis based on the minimum sample size of 27
diploid individuals. FISP-value adjusted at the nominal level (5 %) is 0.0002 after Bonferroni correction. Results of bottleneck tests (P-values) are presented for the
Infinite Allele Model (IAM), Two-phase Model (TPM) and Stepwise Mutation Model (SMM) The number at the end of each sample code corresponds to the collection year Significant results of bottleneck tests are indicated in bold
analysis defined these two geographical groups (ΔK max-imum for K = 2) (Fig. 5a). The same pattern was also evi-denced in the neighbor-joining tree and the Principal Component Analysis (PCA) which grouped the sampled sites according to their geographical origin, without any ef-fect of the collection year (Fig. 5b and c). The PCA showed a significant overall FSTvalue of 0.034, and indicated that
the first two axes were significant and explained 55.81 % of the total inertia: axis 1 accounted for 45.10 % of the vari-ance (FST= 0.016, P-value = 0) and axis 2 accounted for
10.71 % of the variance (FST= 0.004, P-value = 0).
Considering the hierarchy of sampling, significant differentiation was detected for all levels: between the two genetic clusters Corsica and Var (Fclusters-total = 0.0021; P = 0.0085), within clusters (i.e. between collection years; Fyears-clusters = 0.0024; P = 0.0001) and within group (i.e. between samples collected at the same year; Fpopulations-years = 0.0247; P = 0.0022). When performing the analysis within Corsica, the collection year did not significantly account for the observed pattern (i.e. no significant differ-ence between collection year; Fyears-total = 0.0032; P = 0.9755), however, significant differentiation was de-tected among samples for each year (Fpopulations-years = 0.0343; P = 0.0002). The same results were obtained for Var department (Fyears-total = 0.0079; P = 0.6877 and Fpopulations-years = 0.0071; P = 0.0021).
These results are globally consistent with the genetic differentiation tests, which indicated significant genetic differentiation between island and continental populations (Additional file 1: Table S4). Such differentiation is likely to have increased over time as indicated by the FSTvalues
which are twice as high in 2012 compared to 2008 (Table 3) and the significant Wilcoxon signed rank test
(P = 0.0122). This was also evident in the estimates of global FST over all populations per year: values were
higher in 2012 (FST= 0.032, P -value = 0.0002) than 2008
(FST= 0.014, P -value = 0.0001). Interestingly, populations
from Sardinia were significantly differentiated to those from the Var department but were not differentiated to the Corsican populations (3 significant values over 16 comparisons; Additional file 1: Table S4).
Fig. 5 Population genetic structure results of Culicoides imicola. a Genetic clustering of C. imicola samples. Each vertical line represents an individual and each colour represents a cluster. b Microsatellite neighbor-joining tree based on genetic distance of Cavalli-Sforza & Edwards (1967). Bootstrap values are calculated over 1,000 replicates (only values > 50 % are shown). c Principal Component Analysis based on microsatellite allelic frequencies
Table 3 Pairwise FSTvalues between Corsican and Var C. imicola
population samples Cb3_08 V1_08 V2_08 V3_08 Ca1_08 −0.0076 (0.785) 0.0247 (0.005) 0.0251 (0.005) 0.0259 (0.005) Cb3_08 0.0240 (0.005) 0.0138 (0.005) 0.0144 (0.005) V1_08 0.0034 (0.670) 0.0089 (0.010) V2_08 0.0047 (0.320) Cb3_12 V1_12 V2_12 V3_12 Ca1_12 0.0027 (0.030) 0.0506 (0.005) 0.0400 (0.005) 0.0431 (0.005) Cb3_12 0.0501 (0.005) 0.0457 (0.005) 0.0385 (0.005) V1_12 0.0139 (0.005) 0.0206 (0.035) V2_12 −0.0004 (0.095)
Pairwise FSTvalues were computed for 2008 (atop) and 2012 (below).
Significant FSTare represented in bold. P-values are indicated in brackets,
indicative adjusted nominal level (5 %) for multiple comparisons after Bonferroni correction is 0.005
Assessing the levels of genetic differentiation over all col-lected years within regions indicated that sampled popula-tions within Corsica and the Var department were not markedly structured. Indeed, the computed FSTvalues were
relatively low, ranging respectively from−0.0104 to 0.0290 in Corsica and −0.0029 to 0.0261, in the Var department (Additional file 1: Table S4). None of the pairwise compari-sons was significant within Corsica (P -value > 0.0042), and only four out of the thirty-six comparisons within the Var department were significant (P -value < 0.0014, after Bonferonni correction). These results did not support any evident changes in genetic differentiation within each region during the time period studied.
Equilibrium testing
While tests based on the IAM mutation model suggested potential signatures of past genetic bottlenecks in nearly all sampled sites over years, those based on the most realistic TPM and SMM mutation models were only significant for one Corsican site sampled in 2010 (Figari) and two sites in the Var department, including Roquebrune-sur-Argens (V1, over the four collection years and V2 in 2010) (Table 2).
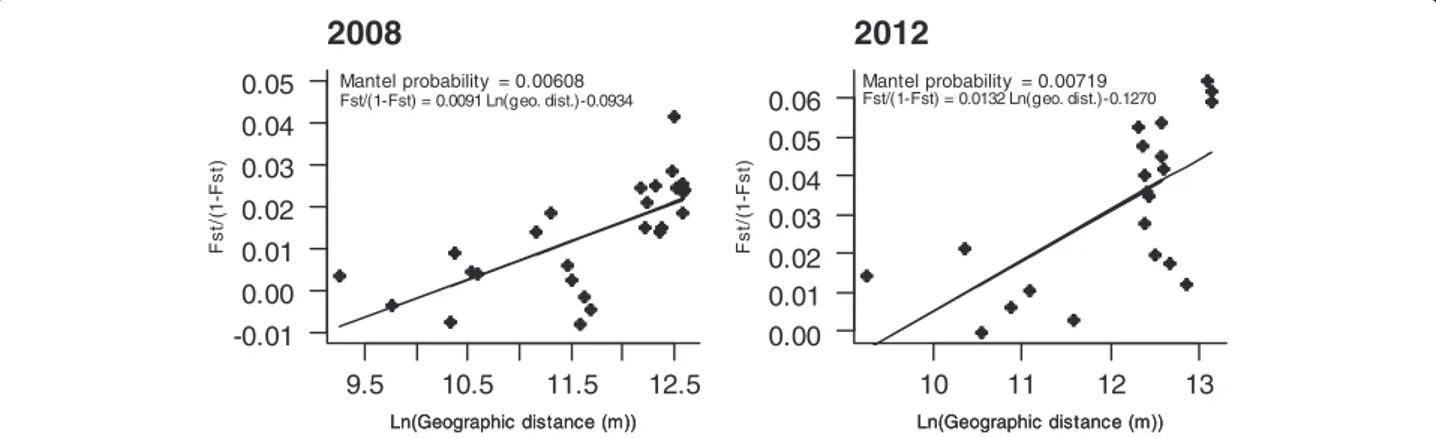
Isolation by distance
Patterns of isolation by distance among C. imicola sam-pled populations were observed both in 2008 and in 2012 (P -value = 0.00608 and 0.00719, respectively; Fig. 6).
Discussion
While a recent study claims the historical presence of C. imicola populations in the Mediterranean region [7], con-tinuous northward expansion of this vector species has been predicted as a result of projected climate change in the future [13]. Climate changes during the Pleistocene would have opened new suitable habitats and allowed the northward expansion of the species from northern sub-Saharan Africa to the North African coast [7]. Nevertheless, if C. imicola is historically present in these regions, entomo-logical surveys suggest recent expansion of settled
populations at the northern edge of the species distribution. Particularly, introduction of the species in the Var depart-ment in continental France, through wind-mediated disper-sal from Corsica, highlights the potential of C. imicola to continue expanding its range and colonize new habitats. In this study, we investigated the spatio-temporal patterns of genetic variation and population dynamics of C. imicola at a local scale in a recent colonized area a priori, i.e. the Var department, and a region where the species has been estab-lished for a longer time, i.e. Corsica. Using nine highly poly-morphic markers, two main conclusions can be drawn from our results: (i) the genetic composition and diversity within region did not significantly change in the time period studied and (ii) the genetic differentiation among Var and Corsican populations has significantly increased when considering the years when sampling had been paired between the two regions.
Our results suggest that the genetic diversity as well as the genetic structure within Corsica and the Var depart-ment have remained relatively stable during the time period studied. Indeed, the principal component analysis indicated that virtually none of the variation could be attributed to temporal samples within regions, but was explained by spatial differentiation between regions. The observed low population structure within regions is an expected response to considerable gene flow between populations. Species from the genus of Culicoides are described as weak active flyers because of their small size. The daily flight distance for European Culicoides species in the Palearctic region has been estimated to be up to 2.21 km [28, 29], but is still un-known for C. imicola. In the Var department, the average spread of C. imicola has been estimated to be 14.5 km/year, suggesting a limited local expansion of the species [9]. The limited density of C. imicola, the presence of physical bar-riers and potential unsuitable environmental conditions probably impair its ability to successfully disperse [9]. In contrast, our findings indicate that C. imicola may passively and/or actively disperse at the local scale, allowing relatively high gene flow among populations. It is worth noting that
9.5 10.5 11.5 12.5 -0.01 0.00 0.01 0.02 0.03 0.04 0.05
2008
Ln(Geographic distance (m)) Mantel probability = 0.00608 Fst/(1-Fst) = 0.0091 Ln(geo. dist.)-0.0934 Ln(Geographic distance (m)) Fst/( 1 -Fst) 10 11 12 13 0.00 0.01 0.02 0.03 0.04 0.05 0.062012
Ln(Geographic distance (m)) Mantel probability = 0.00719 Fst/(1-Fst) = 0.0132 Ln(geo. dist.)-0.1270 Ln(Geographic distance (m)) Fst/( 1 -Fst)the number of sampled sites in the Var department was small and that the sites were geographically close to each other, and thus may not allow an accurate determination of the genetic structuring. However, despite the hilly topog-raphy of Corsica and the geographical distances between the sampled sites, low genetic differentiation was also ob-served among Corsican populations supporting the exist-ence of gene flow among them. Nevertheless, it is possible that our set of markers have failed to assess the population structure at this scale. It would thus be interesting to fur-ther investigate the fine-scale spatio-temporal population variation with more markers or by performing genomic analysis based on highly polymorphic markers such as sin-gle nucleotide polymorphisms (SNPs). This would allow for assessing the impact of landscape on population structur-ing. It would also be interesting to estimate the spread of C. imicola Corsican populations that are more abundant, using direct methods in order to evaluate the dispersal abil-ity of the species in the landscape.
A significant increase in the genetic differentiation be-tween Var and Corsican populations was observed through time. This genetic pattern could be explained by two hy-potheses. First, it could reflect the genetic changes in popu-lation structuring due to founder effects following introduction. Indeed, incursion of species in novel environ-ments is often associated with a loss of genetic diversity when the gene pool in the new habitat is provided by a small number of founding individuals [30]. The newly founded population may then experience strong genetic drift resulting in genetic differentiation among populations [30]. Our results support this scenario since signatures of demographic bottlenecks were detected in two Var popula-tions and one Corsican population. In addition, the levels of allelic richness were significantly lower in the Var depart-ment, while the mean heterozygosity was comparable among all populations. These results are consistent with the loss of genetic diversity associated with founder effects, as allelic richness is expected to be more sensitive to the ef-fects of bottlenecks than is heterozygosity [30–32]. Thus, a limited number of emigrant midges carried by the wind from Corsica Island into the Var department could have been the target of genetic drift, leading to the observed gen-etic differentiation.
Complementarily, the observed patterns could result from the processes operating at the distributional edge of C. imicola populations. Indeed, it is widely appreciated that towards the range edge, habitats and ecological factors can influence the demography of populations, leading to habitat fragmentation and low population abundance and density [1, 33]. As a result, genetic diversity is likely to decrease while genetic differentiation is expected to increase in mar-ginal populations compared with central populations [33]. Such patterns have been reported for many taxa including plants (e.g. [34, 35]), insects (e.g. [36]) and reptiles (e.g.
[37]). Despite regular entomological surveys, C. imicola populations have not been found in neighbouring areas of the south-east coastal region of the Var department, its present consensually admitted northern edge [9]. In addition, levels of C. imicola abundance in this region have remained very low since its first records (maximum of 4,500 individuals caught per night over 2003–2014). Using similar trapping protocols (i.e. black-light suction traps placed in the near vicinity of animal shelters containing sheep, cattle or horses), other reported local abundance such as in Corsica (maximum catch of ~ 160,000 in 2010) [9] and Sardinia (10,000-65,000 maximum catch/night) [38] were about ten to forty times higher. Interestingly, lower levels of C. imicola abundance have also been reported in northern Spain, i.e. Catalonia, Basque country (<1,000 max-imum catch/night) [39, 40] and northern continental Italy, i.e. north of Tuscany (<100 maximum catch/night) [38], marking respectively the north-western and north-eastern limits of the species distribution in the western Mediterra-nean area (the population recorded in south-western Con-tinental France in the Pyrénées-Orientales department is still under investigation to assess the establishment of the population [Jacquet S et al.: Range expansion of the Blue-tongue vector Culicoides imicola in continental France thanks to meteorological events (submitted)]). Although different types of trap have been used in these studies (i.e. Mini CDC trap in Spain and Onderstepoort trap in the Var department and Italy), previous trap comparison experi-ments have showed relatively small abundance differences between these traps [41, 42]. It thus appears that the ob-served low abundance levels at the northern edge of the species distribution are unlikely due to trapping method-ology, but instead may reflect the role of abiotic and/or bi-otic factors in C. imicola distribution. The patchy distribution and low population abundance of C. imicola populations are most likely driven by local habitat condi-tions including climate, topography, soil (type and mois-ture) and host availability [6, 43, 44], of which the species is highly dependent. Thus, environmental conditions in the Var department may be less suitable for C. imicola than in southern Corsica for example. As a consequence, the resulting low population size in the Var department may be more subject to demographic stochastic events and genetic drift. This may explain the observed genetic differentiation between Corsican and Var populations; however, we would also expect higher genetic differentiation between Var populations compared with Corsican populations. Yet, our results indicate low levels of genetic differentiation within Var. These low levels of differentiation could simply result from a recent introduction of C. imicola there; if the incursion of the species has occurred in 2004, populations may not have had enough time for a significant differen-tiation. In this context, the observed genetic patterns (i.e. signature of genetic bottleneck and lower genetic
diversity and genetic differentiation in the Var depart-ment) and population abundances may support the hypothesis of a recent introduction in the Var department as suggested by entomological surveys [9], but a longtime presence of C. imicola in Corsica as highlighted by [7].
Interestingly, Corsican and Sardinian populations were genetically similar. The high capacity of C. imicola to pas-sively disperse by winds may allow high gene flow among these two nearby islands, as it has been evidenced on longer distances in the Mediterranean region [Jacquet S et al.: Range expansion of the Bluetongue vector Culicoides imi-cola in continental France thanks to meteorological events (submitted)]. In contrast, the increase of genetic differenti-ation between Var and Corsican populdifferenti-ations could indicate that despite the high dispersal ability of the species, migra-tions between Corsica and the Var department, if there are at all, may not be sufficient to homogenize the genetic com-position of the continental populations. Nonetheless, these findings should be further investigated and confirmed by increasing the time period studied.
Conclusion
Our study highlights the processes underlying contempor-ary range expansions and driving population dynamics at a local scale. Our results suggest that local range expansion of C. imicola in continental France may be slowed by low population abundances and unsuitable environmental con-ditions. Despite the high ability of C. imicola to passively disperse through winds, our results indicate that the pres-ence of large water bodies may restrict this process allowing the genetic differentiation between Corsican and Var popu-lations. Further analyses based on a wider temporal scale would help for a better understanding of the mechanisms shaping C. imicola distribution and therefore assessing local C. imicola-borne disease epidemiology. Nevertheless, our findings yield information for the design of predictive models of future spread.
Additional file
Additional file 1: Table S1. Primers used for the amplification of the microsatellite loci in C. imicola (Mardulyn et al. 2013). Table S2. Details of the entomological surveys realized in Var department in 2011 and 2012. Table S3. Details of the entomological surveys realized in Corsica in 2010 and 2012. Table S4. Pairwise FSTvalues between Corsican and Var populations of
C. imicola for all collected years. (DOCX 58 kb)
Competing interests
The authors declare that they have no competing interests Authors’ contributions
SJ, KH, CG designed the study. SJ genotyped the samples. SJ, KH, and CG analysed the data. MLSR, MG, XA, IR, ThB collected C. imicola samples. CC, JB, ThB, TB and HG, contributed to the manuscript firstly written by SJ, KH and CG. All authors read and commented on the final manuscript.
Acknowledgement
The authors are grateful to all the people who gave assistance in operating traps and thank the French Ministry of Agriculture for allowing the population surveillance since 2002.
Funding
This work was granted by the Chercheur d’Avenir 2011 call from the Languedoc-Roussillon region, France and the Ministère de l’Agriculture. This study was partially funded by the DGAL, as well as the EU grant FP7-613996 VMERGE and is catalo-gued by the VMERGE Steering Committee as VMERGE012 (http://www.vmerge.eu). The contents of this publication are the sole responsibility of the authors and do not necessarily reflect the views of the European Commission.
Author details
1
Cirad, UMR15 Contrôle des Maladies Animales Exotiques et Emergentes, Campus International de Baillarguet, TA-A15/G, 34398 Montpellier, France.
2UMR 5290 Maladies Infectieuses & Vecteurs-Ecologie, Génétique, Ecologie,
Contrôle (MIVEGEC), CNRS, Université de Montpellier, Montpellier, France.
3
IRD, UR 224 MIVEGEC, Agropolis, BP 64501, 34 394 Montpellier cedex 5, France.4INRA, UMR1309 CMAEE, 34398 Montpellier, France.5EID
Méditérranée, 34184 Montpellier, France.6Istituto Zooprofilattico
Sperimentale dell’Abruzzo e del Molise ‘G. Caporale’, 64100 Teramo, Italy.
Received: 21 December 2015 Accepted: 4 March 2016
References
1. Excoffier L, Foll M, Petit RJ. Genetic consequences of range expansions. Annu Rev Ecol Evol Syst. 2009;40:481–501.
2. Tatem AJ, Hay SI, Rogers DJ. Global traffic and disease vector dispersal. Proc Natl Acad Sci U S A. 2006;103(16):6242–7.
3. Harrington LC, Scott TW, Lerdthusnee K, Coleman RC, Costero A, Clark GG, Jones JJ, Kitthawee S, Kittayapong P, Sithiprasasna R. Dispersal of the dengue vector Aedes aegypti within and between rural communities. AmJTrop Med Hyg. 2005;72(2):209–20.
4. Bishop AL, Spohr LJ, Barchia IM. Effects of altitude, distance and waves of movement on the dispersal in Australia of the arbovirus vector, Culicoides brevitarsis Kieffer (Diptera: Ceratopogonidae). Prev Vet Med. 2004;65(3–4):135–45. 5. Peterson AT, Vieglais DA. Predicting Species Invasions Using Ecological
Niche Modeling: New Approaches from Bioinformatics Attack a Pressing Problem A new approach to ecological niche modeling, based on new tools drawn from biodiversity informatics, is applied to the challenge of predicting potential species' invasions. Bioscience. 2001;51(5):363–71. 6. Mellor PS, Boorman J, Baylis M. Culicoides biting midges: their role as
arbovirus vectors. Annu Rev Entomol. 2000;45:307–40.
7. Jacquet S, Garros C, Lombaert E, Walton C, Restrepo J, Allene X, Baldet T, Cetre-Sossah C, Chaskopoulou A, et al. Colonization of the Mediterranean Basin by the vector biting midge species Culicoides imicola: an old story. Mol Ecol. 2015;24(22):5707–25.
8. Mardulyn P, Goffredo M, Conte A, Hendrickx G, Meiswinkel R, Balenghien T, Sghaier S, Lohr Y, Gilbert M. Climate change and the spread of vector-borne diseases: using approximate Bayesian computation to compare invasion scenarios for the bluetongue virus vector Culicoides imicola in Italy. Mol Ecol. 2013;22(9):2456–66.
9. Venail R, Balenghien T, Guis H, Tran A, Setier-Rio ML, Delécolle JC, Mathieu B, Cetre-Sossah C, Martinez D, Languille J, et al. Assessing diversity and abundance of vector populations at a national scale: example of Culicoides surveillance in France after bluetongue virus emergence. In: Arthropods as vectors of emerging diseases. Edited by Mehlhorn H. Berlin Springer-Verlag; 2012. p. 77–103.
10. Delécolle J-C, De La Rocque S. Contribution à l'étude des Culicoides de Corse. Liste des espèces recensées en 2000/2001 et redescription du principal vecteur de la fièvre catarrhale ovine: C. imicola Kieffer, 1913 (Diptera, Ceratopogonidae). Bull Soc Entomol Fr. 2002;107(4):371–9. 11. Balenghien T, Delécolle J-C, Setier-Rio M-L, Rakotoarivony I, Allène X, Venail
R, Delécolle D, Lhoir J, Mathieu B, Chavernac D. Vecteurs du virus de la fièvre catarrhale ovine: suivi des populations de Culicoides en 2011 en France. Bull Epidémiologique Santé Animale Alimentation. 2012;54:35–40. 12. Balenghien T, Rakotoarivony I, Allène X, Perrin JB, Garros C. L’activité des
populations de Culicoides en Corse en 2013. Santé animale-alimentation. 2014;64:41.
13. Guichard S, Guis H, Tran A, Garros C, Balenghien T, Kriticos DJ. Worldwide niche and future potential distribution of Culicoides imicola, a major vector of bluetongue and African horse sickness viruses. PLoS One. 2014;9(11), e112491. 14. Goudet J. FSTAT (Version 1.2): A computer program to calculate F-statistics.
J Hered. 1995;86(6):485–6.
15. Nei M. Molecular evolutionary genetics. New York: Columbia University Press; 1987.
16. R Development Core Team. R: A language and environment for statistical computing. Vienna, Austria: R Foundation for Statistical Computing; 2013. 17. Cornuet JM, Luikart G. Description and power analysis of two tests for
detecting recent population bottlenecks from allele frequency data. Genetics. 1996;144(4):2001–14.
18. Piry S, Luikart G, Cornuet JM. BOTTLENECK: A computer program for detecting recent reductions in the effective population size using allele frequency data. J Hered. 1999;90(4):502–3.
19. Takezaki N, Nei M. Genetic distances and reconstruction of phylogenetic trees from microsatellite DNA. Genetics. 1996;144(1):389–99.
20. Cavalli-Sforza LL, Edwards AW. Phylogenetic analysis. Models and estimation procedures. Am J Hum Genet. 1967;19(3 Pt 1):233–57.
21. Goudet J. PCA-GEN (Version 1.2) a Program to Perform Principal Component Analysis (PCA) on Gene Frequency Data. Switzerland: Institute of Ecology, University of Lausanne; 1999.
22. Pritchard JK, Stephens M, Donnelly P. Inference of population structure using multilocus genotype data. Genetics. 2000;155(2):945–59.
23. Evanno G, Regnaut S, Goudet J. Detecting the number of clusters of individuals using the software STRUCTURE: a simulation study. Mol Ecol. 2005;14(8):2611–20. 24. Goudet J. Hierfstat, a package for R to compute and test hierarchical F‐statistics.
Mol Ecol Notes. 2005;5(1):184–6.
25. Weir BS, Cockerham CC. Estimating F-Statistics for the Analysis of Population-Structure. Evolution. 1984;38(6):1358–70.
26. Raymond M, Rousset F. An exact test for population differentiation. Evolution. 1995;49(6):1280–3.
27. Rousset F. genepop’007: a complete re‐implementation of the genepop software for Windows and Linux. Mol Ecol Resour. 2008;8(1):103–6. 28. Kluiters G, Swales H, Baylis M. Local dispersal of Palaearctic Culicoides biting
midges estimated by mark-release-recapture. Parasit Vectors. 2015;8:86. 29. Kirkeby C, Bodker R, Stockmarr A, Lind P, Heegaard PM. Quantifying dispersal
of european Culicoides (Diptera: Ceratopogonidae) vectors between farms using a novel mark-release-recapture technique. PLoS One. 2013;8(4), e61269. 30. Nei M, Maruyama T, Chakraborty R. The bottleneck effect and genetic
variability in populations. Evolution. 1975;29(1):1–10.
31. Leberg PL. Effects of population bottlenecks on genetic diversity as measured by allozyme electrophoresis. Evolution. 1992;46(2):477–94. 32. Spencer C, Neigel J, Leberg P. Experimental evaluation of the usefulness of
microsatellite DNA for detecting demographic bottlenecks. Mol Ecol. 2000;9(10):1517–28.
33. Sexton JP, McIntyre PJ, Angert AL, Rice KJ. Evolution and ecology of species range limits. Ecol Evol Syst. 2009;40:415–36.
34. Diekmann OE, Serrao EA. Range‐edge genetic diversity: locally poor extant southern patches maintain a regionally diverse hotspot in the seagrass Zostera marina. Mol Ecol. 2012;21(7):1647–57.
35. Faugeron S, Martínez EA, Correa JA, Cardenas L, Destombe C, Valero M. Reduced genetic diversity and increased population differentiation in peripheral and overharvested populations of Gigartina skottsbergii (Rhodophyta, Gigartinales) in southern Chile. J Phycol. 2004;40(3):454–62. 36. Krauss J, Schmitt T, Seitz A, Steffan‐Dewenter I, Tscharntke T. Effects of
habitat fragmentation on the genetic structure of the monophagous butterfly Polyommatus coridon along its northern range margin. Mol Ecol. 2004;13(2):311–20.
37. Böhme MU, Schneeweiß N, Fritz U, Schlegel M, Berendonk TU. Small edge populations at risk: genetic diversity of the green lizard (Lacerta viridis viridis) in Germany and implications for conservation management. Conserv Genet. 2007;8(3):555–63.
38. Goffredo M, Conte A, Cocciolito R, Meiswinkel R. The distribution and abundance of Culicoides imicola in Italy. Vet Ital. 2003;47:22–32. 39. Goldarazena A, Romón P, Aduriz G, Balenghien T, Baldet T, Delécolle JC.
First record of Culicoides imicola, the main vector of bluetongue virus in Europe, in the Basque Country (northern Spain). Vet Rec. 2008;162(25):820–1. 40. Sarto i Monteys V, Ventura D, Pagès N, Aranda C, Escosa R. Expansion of
Culicoides imicola, the main bluetongue virus vector in Europe, into Catalonia, Spain. Vet Rec. 2005;156:415–7.
41. del Rio R, Monerris M, Miquel M, Borràs D, Calvete C, Estrada R, Lucientes J, Miranda MA. Collection of Culicoides spp. with four light trap models during different seasons in the Balearic Islands. Vet Parasitol. 2013;195(1–2):150–6.
42. Venter G, Labuschagne K, Hermanides KG, Boikanyo SNB, Majatladi DM, Morey L. Comparison of the efficiency of five suction light traps under field conditions in South Africa for the collection of Culicoides species. Vet Parasitol. 2009;166(3–4):299–307.
43. Acevedo P, Ruiz-Fons F, Estrada R, Marquez AL, Miranda MA, Gortazar C, Lucientes J. A broad assessment of factors determining Culicoides imicola abundance: modelling the present and forecasting its future in climate change scenarios. PLoS One. 2010;5(12), e14236.
44. Conte A, Ippoliti C, Savini L, Goffredo M, Meiswinkel R. Novel environmental factors influencing the distribution and abundance of Culicoides imicola and the Obsoletus Complex in Italy. Vet Ital. 2007;43(3):571–80.
• We accept pre-submission inquiries
• Our selector tool helps you to find the most relevant journal
• We provide round the clock customer support
• Convenient online submission
• Thorough peer review
• Inclusion in PubMed and all major indexing services
• Maximum visibility for your research Submit your manuscript at
www.biomedcentral.com/submit