arXiv:1301.5358v1 [hep-ex] 22 Jan 2013
Search for a Higgs boson in diphoton final states with the D0 detector in 9.6 fb
−1of
p¯
p collisions at
√
s = 1.96 TeV
V.M. Abazov,32 B. Abbott,67 B.S. Acharya,26M. Adams,46 T. Adams,44 G.D. Alexeev,32 G. Alkhazov,36
A. Altona,56 A. Askew,44 S. Atkins,54 K. Augsten,7 C. Avila,5 F. Badaud,10 L. Bagby,45 B. Baldin,45
D.V. Bandurin,44S. Banerjee,26 E. Barberis,55 P. Baringer,53 J.F. Bartlett,45 U. Bassler,15V. Bazterra,46
A. Bean,53 M. Begalli,2L. Bellantoni,45S.B. Beri,24 G. Bernardi,14 R. Bernhard,19I. Bertram,39 M. Besan¸con,15
R. Beuselinck,40P.C. Bhat,45S. Bhatia,58V. Bhatnagar,24G. Blazey,47S. Blessing,44 K. Bloom,59 A. Boehnlein,45
D. Boline,64 E.E. Boos,34 G. Borissov,39 A. Brandt,70 O. Brandt,20 R. Brock,57 A. Bross,45 D. Brown,14
X.B. Bu,45 M. Buehler,45 V. Buescher,21 V. Bunichev,34 S. Burdinb,39 C.P. Buszello,38E. Camacho-P´erez,29
B.C.K. Casey,45H. Castilla-Valdez,29 S. Caughron,57S. Chakrabarti,64 D. Chakraborty,47 K.M. Chan,51
A. Chandra,72 E. Chapon,15G. Chen,53 S.W. Cho,28 S. Choi,28 B. Choudhary,25 S. Cihangir,45 D. Claes,59
J. Clutter,53 M. Cooke,45W.E. Cooper,45 M. Corcoran,72F. Couderc,15M.-C. Cousinou,12 D. Cutts,69 A. Das,42
G. Davies,40S.J. de Jong,30, 31 E. De La Cruz-Burelo,29 F. D´eliot,15R. Demina,63 D. Denisov,45 S.P. Denisov,35
S. Desai,45 C. Deterred,20 K. DeVaughan,59 H.T. Diehl,45 M. Diesburg,45 P.F. Ding,41 A. Dominguez,59
A. Dubey,25 L.V. Dudko,34 A. Duperrin,12 S. Dutt,24 A. Dyshkant,47M. Eads,47D. Edmunds,57 J. Ellison,43
V.D. Elvira,45 Y. Enari,14H. Evans,49 V.N. Evdokimov,35 L. Feng,47 T. Ferbel,63 F. Fiedler,21 F. Filthaut,30, 31
W. Fisher,57 H.E. Fisk,45 M. Fortner,47 H. Fox,39 S. Fuess,45 A. Garcia-Bellido,63 J.A. Garc´ıa-Gonz´alez,29
G.A. Garc´ıa-Guerrac,29 V. Gavrilov,33 W. Geng,12, 57 C.E. Gerber,46 Y. Gershtein,60 G. Ginther,45, 63
G. Golovanov,32 P.D. Grannis,64 S. Greder,16 H. Greenlee,45 G. Grenier,17 Ph. Gris,10 J.-F. Grivaz,13
A. Grohsjeand,15S. Gr¨unendahl,45 M.W. Gr¨unewald,27T. Guillemin,13 G. Gutierrez,45 P. Gutierrez,67J. Haley,55
L. Han,4 K. Harder,41 A. Harel,63J.M. Hauptman,52 J. Hays,40 T. Head,41T. Hebbeker,18D. Hedin,47 H. Hegab,68
A.P. Heinson,43 U. Heintz,69 C. Hensel,20I. Heredia-De La Cruz,29 K. Herner,56 G. Heskethf,41 M.D. Hildreth,51
R. Hirosky,73T. Hoang,44 J.D. Hobbs,64B. Hoeneisen,9 J. Hogan,72 M. Hohlfeld,21 I. Howley,70 Z. Hubacek,7, 15
V. Hynek,7 I. Iashvili,62 Y. Ilchenko,71 R. Illingworth,45A.S. Ito,45 S. Jabeen,69 M. Jaffr´e,13 A. Jayasinghe,67
M.S. Jeong,28R. Jesik,40 P. Jiang,4K. Johns,42 E. Johnson,57 M. Johnson,45 A. Jonckheere,45P. Jonsson,40
J. Joshi,43 A.W. Jung,45 A. Juste,37 E. Kajfasz,12D. Karmanov,34I. Katsanos,59 R. Kehoe,71S. Kermiche,12
N. Khalatyan,45A. Khanov,68 A. Kharchilava,62 Y.N. Kharzheev,32 I. Kiselevich,33 J.M. Kohli,24A.V. Kozelov,35
J. Kraus,58A. Kumar,62 A. Kupco,8 T. Kurˇca,17 V.A. Kuzmin,34 S. Lammers,49P. Lebrun,17 H.S. Lee,28
S.W. Lee,52 W.M. Lee,44 X. Lei,42 J. Lellouch,14D. Li,14 H. Li,73 L. Li,43 Q.Z. Li,45J.K. Lim,28 D. Lincoln,45
J. Linnemann,57V.V. Lipaev,35 R. Lipton,45 H. Liu,71 Y. Liu,4A. Lobodenko,36M. Lokajicek,8 R. Lopes de Sa,64
R. Luna-Garciag,29A.L. Lyon,45A.K.A. Maciel,1R. Maga˜na-Villalba,29S. Malik,59V.L. Malyshev,32 J. Mansour,20
J. Mart´ınez-Ortega,29 R. McCarthy,64 C.L. McGivern,41 M.M. Meijer,30, 31 A. Melnitchouk,45 D. Menezes,47
P.G. Mercadante,3 M. Merkin,34 A. Meyer,18J. Meyerj,20 F. Miconi,16 N.K. Mondal,26M. Mulhearn,73 E. Nagy,12
M. Naimuddin,25 M. Narain,69 R. Nayyar,42H.A. Neal,56 J.P. Negret,5 P. Neustroev,36 H.T. Nguyen,73 T. Nunnemann,22 J. Orduna,72N. Osman,12 J. Osta,51 M. Padilla,43A. Pal,70N. Parashar,50V. Parihar,69
S.K. Park,28R. Partridgee,69 N. Parua,49A. Patwak,65 B. Penning,45 M. Perfilov,34Y. Peters,20K. Petridis,41
G. Petrillo,63 P. P´etroff,13 M.-A. Pleier,65 P.L.M. Podesta-Lermah,29 V.M. Podstavkov,45A.V. Popov,35
M. Prewitt,72 D. Price,49 N. Prokopenko,35 J. Qian,56 A. Quadt,20 B. Quinn,58 M.S. Rangel,1 P.N. Ratoff,39
I. Razumov,35 I. Ripp-Baudot,16 F. Rizatdinova,68 M. Rominsky,45 A. Ross,39 C. Royon,15 P. Rubinov,45
R. Ruchti,51 G. Sajot,11 P. Salcido,47 A. S´anchez-Hern´andez,29 M.P. Sanders,22 A.S. Santosi,1 G. Savage,45
L. Sawyer,54 T. Scanlon,40 R.D. Schamberger,64 Y. Scheglov,36 H. Schellman,48 C. Schwanenberger,41
R. Schwienhorst,57J. Sekaric,53 H. Severini,67E. Shabalina,20 V. Shary,15 S. Shaw,57 A.A. Shchukin,35
R.K. Shivpuri,25V. Simak,7 P. Skubic,67 P. Slattery,63D. Smirnov,51K.J. Smith,62 G.R. Snow,59 J. Snow,66
S. Snyder,65 S. S¨oldner-Rembold,41L. Sonnenschein,18K. Soustruznik,6 J. Stark,11 D.A. Stoyanova,35M. Strauss,67
L. Suter,41 P. Svoisky,67 M. Titov,15 V.V. Tokmenin,32 Y.-T. Tsai,63D. Tsybychev,64B. Tuchming,15 C. Tully,61
L. Uvarov,36 S. Uvarov,36 S. Uzunyan,47 R. Van Kooten,49 W.M. van Leeuwen,30 N. Varelas,46 E.W. Varnes,42
I.A. Vasilyev,35A.Y. Verkheev,32 L.S. Vertogradov,32M. Verzocchi,45 M. Vesterinen,41 D. Vilanova,15 P. Vokac,7
H.D. Wahl,44 M.H.L.S. Wang,45 J. Warchol,51 G. Watts,74 M. Wayne,51 J. Weichert,21 L. Welty-Rieger,48
R. Yamada,45S. Yang,4 T. Yasuda,45 Y.A. Yatsunenko,32W. Ye,64 Z. Ye,45H. Yin,45 K. Yip,65 S.W. Youn,45
J.M. Yu,56 J. Zennamo,62 T.G. Zhao,41B. Zhou,56J. Zhu,56 M. Zielinski,63 D. Zieminska,49 and L. Zivkovic14
(The D0 Collaboration∗)
1LAFEX, Centro Brasileiro de Pesquisas F´ısicas, Rio de Janeiro, Brazil 2Universidade do Estado do Rio de Janeiro, Rio de Janeiro, Brazil
3Universidade Federal do ABC, Santo Andr´e, Brazil
4University of Science and Technology of China, Hefei, People’s Republic of China 5Universidad de los Andes, Bogot´a, Colombia
6Charles University, Faculty of Mathematics and Physics, Center for Particle Physics, Prague, Czech Republic 7Czech Technical University in Prague, Prague, Czech Republic
8Center for Particle Physics, Institute of Physics,
Academy of Sciences of the Czech Republic, Prague, Czech Republic 9Universidad San Francisco de Quito, Quito, Ecuador 10LPC, Universit´e Blaise Pascal, CNRS/IN2P3, Clermont, France
11LPSC, Universit´e Joseph Fourier Grenoble 1, CNRS/IN2P3, Institut National Polytechnique de Grenoble, Grenoble, France 12CPPM, Aix-Marseille Universit´e, CNRS/IN2P3, Marseille, France
13LAL, Universit´e Paris-Sud, CNRS/IN2P3, Orsay, France 14LPNHE, Universit´es Paris VI and VII, CNRS/IN2P3, Paris, France
15CEA, Irfu, SPP, Saclay, France
16IPHC, Universit´e de Strasbourg, CNRS/IN2P3, Strasbourg, France
17IPNL, Universit´e Lyon 1, CNRS/IN2P3, Villeurbanne, France and Universit´e de Lyon, Lyon, France 18III. Physikalisches Institut A, RWTH Aachen University, Aachen, Germany
19Physikalisches Institut, Universit¨at Freiburg, Freiburg, Germany
20II. Physikalisches Institut, Georg-August-Universit¨at G¨ottingen, G¨ottingen, Germany 21Institut f¨ur Physik, Universit¨at Mainz, Mainz, Germany
22Ludwig-Maximilians-Universit¨at M¨unchen, M¨unchen, Germany 23Fachbereich Physik, Bergische Universit¨at Wuppertal, Wuppertal, Germany
24Panjab University, Chandigarh, India 25Delhi University, Delhi, India
26Tata Institute of Fundamental Research, Mumbai, India 27University College Dublin, Dublin, Ireland
28Korea Detector Laboratory, Korea University, Seoul, Korea 29CINVESTAV, Mexico City, Mexico
30Nikhef, Science Park, Amsterdam, the Netherlands 31Radboud University Nijmegen, Nijmegen, the Netherlands
32Joint Institute for Nuclear Research, Dubna, Russia 33Institute for Theoretical and Experimental Physics, Moscow, Russia
34Moscow State University, Moscow, Russia 35Institute for High Energy Physics, Protvino, Russia 36Petersburg Nuclear Physics Institute, St. Petersburg, Russia
37Instituci´o Catalana de Recerca i Estudis Avan¸cats (ICREA) and Institut de F´ısica d’Altes Energies (IFAE), Barcelona, Spain 38Uppsala University, Uppsala, Sweden
39Lancaster University, Lancaster LA1 4YB, United Kingdom 40Imperial College London, London SW7 2AZ, United Kingdom 41The University of Manchester, Manchester M13 9PL, United Kingdom
42University of Arizona, Tucson, Arizona 85721, USA 43University of California Riverside, Riverside, California 92521, USA
44Florida State University, Tallahassee, Florida 32306, USA 45Fermi National Accelerator Laboratory, Batavia, Illinois 60510, USA
46University of Illinois at Chicago, Chicago, Illinois 60607, USA 47Northern Illinois University, DeKalb, Illinois 60115, USA
48Northwestern University, Evanston, Illinois 60208, USA 49Indiana University, Bloomington, Indiana 47405, USA 50Purdue University Calumet, Hammond, Indiana 46323, USA 51University of Notre Dame, Notre Dame, Indiana 46556, USA
52Iowa State University, Ames, Iowa 50011, USA 53University of Kansas, Lawrence, Kansas 66045, USA 54Louisiana Tech University, Ruston, Louisiana 71272, USA 55Northeastern University, Boston, Massachusetts 02115, USA
56University of Michigan, Ann Arbor, Michigan 48109, USA 57Michigan State University, East Lansing, Michigan 48824, USA
58University of Mississippi, University, Mississippi 38677, USA 59University of Nebraska, Lincoln, Nebraska 68588, USA 60Rutgers University, Piscataway, New Jersey 08855, USA 61Princeton University, Princeton, New Jersey 08544, USA 62State University of New York, Buffalo, New York 14260, USA
63University of Rochester, Rochester, New York 14627, USA 64State University of New York, Stony Brook, New York 11794, USA
65Brookhaven National Laboratory, Upton, New York 11973, USA 66Langston University, Langston, Oklahoma 73050, USA 67University of Oklahoma, Norman, Oklahoma 73019, USA 68Oklahoma State University, Stillwater, Oklahoma 74078, USA
69Brown University, Providence, Rhode Island 02912, USA 70University of Texas, Arlington, Texas 76019, USA 71Southern Methodist University, Dallas, Texas 75275, USA
72Rice University, Houston, Texas 77005, USA 73University of Virginia, Charlottesville, Virginia 22904, USA
74University of Washington, Seattle, Washington 98195, USA (Dated: January 22, 2013)
We present a search for a Higgs boson decaying into a pair of photons based on 9.6 fb−1 of p¯p collisions at√s = 1.96 TeV collected with the D0 detector at the Fermilab Tevatron Collider. The search employs multivariate techniques to discriminate signal from the non-resonant background and is separately optimized for a standard model and a fermiophobic Higgs boson. No significant excess of data above the background prediction is observed and upper limits on the product of the cross section and branching fraction are derived at the 95% confidence level as a function of Higgs boson mass. For a standard model Higgs boson with mass of 125 GeV, the observed (expected) upper limits are a factor of 12.8 (8.7) above the standard model prediction. The existence of a fermiophobic Higgs boson with mass in the 100–113 GeV range is excluded at the 95% confidence level.
PACS numbers: 14.80.Bn, 13.85.Rm, 14.80.Ec, 12.60.Fr
I. INTRODUCTION
Unraveling the mechanism for electroweak symmetry breaking and the generation of mass of elementary parti-cles has been a priority in experimental particle physics research during the last decades. In the standard model (SM) [1] this is accomplished by introducing a SU(2) doublet of self-interacting elementary scalars, the “Higgs field”, whose non-zero vacuum expectation value breaks the electroweak symmetry and generates the mass of the W and Z bosons [2]. The postulated Yukawa interactions between the fermions and the Higgs field also gives mass to fermions upon the breaking of the electroweak sym-metry. Furthermore, a physical scalar particle appears in the spectrum, the Higgs boson (H), whose mass is not predicted and must be determined experimentally.
Within the SM, indirect constraints from precision
∗with visitors from aAugustana College, Sioux Falls, SD, USA, bThe University of Liverpool, Liverpool, UK,cUPIITA-IPN, Mex-ico City, MexMex-ico, dDESY, Hamburg, Germany, eSLAC, Menlo Park, CA, USA,fUniversity College London, London, UK,gCentro de Investigacion en Computacion - IPN, Mexico City, Mexico, hECFM, Universidad Autonoma de Sinaloa, Culiac´an, Mexico, iUniversidade Estadual Paulista, S˜ao Paulo, Brazil, jKarlsruher Institut f¨ur Technologie (KIT) - Steinbuch Centre for Computing (SCC) andkOffice of Science, U.S. Department of Energy, Wash-ington, D.C. 20585, USA.
electroweak observables [3] limit the allowed range for the Higgs boson mass (MH) to MH < 152 GeV at the 95%
confidence level (CL). Direct searches at the CERN e+e−
Collider (LEP) [4] set a lower limit of MH > 114.4 GeV
at 95% CL. At hadron colliders the dominant production mechanisms for a SM Higgs boson are gluon fusion (GF) (gg → H), associated production with a W or Z boson (q ¯q′ → V H, V = W, Z), and vector boson fusion (VBF)
(V V → H). However, the search strategies for a light SM Higgs boson are different at the Fermilab Tevatron p¯p Collider and at CERN’s Large Hadron pp Collider (LHC).
At the Tevatron, the most sensitive SM Higgs boson searches for MH < 130 GeV rely on the V H production
mode, with H → b¯b, while for MH > 130 GeV the main
search mode is gg → H → W+W−. The combination
of searches at the Tevatron [5] have resulted in the mass ranges 100 < MH< 103 GeV and 147 < MH < 180 GeV
being excluded at the 95% CL. In the allowed inter-mediate mass range an excess is found with a maxi-mum local significance of 3.1 standard deviations (s.d.) at MH = 125 GeV, primarily originating from the VH
(H → b¯b) searches [6].
At the LHC, the search strategy for MH > 140 GeV
also capitalizes on the GF production mode, exploiting primarily the H → W+W− and H → ZZ decay modes
with leptonic W and Z boson decays. The H → γγ decay mode becomes one of the most promising discovery chan-nels at lower MH, despite its small branching fraction
of B(H → γγ) ≈ 0.2%, owing to its clean experimental signature of a narrow resonance on top of a smoothly-falling background in the diphoton mass (Mγγ) spectrum.
Searches for H → ZZ(∗) → ℓ+ℓ−ℓ′+ℓ′− (ℓ, ℓ′ = e, µ) are
also sensitive due to the small background and excellent four-lepton invariant mass resolution. The most recent searches for the SM Higgs boson at the LHC [7, 8] ex-clude a SM Higgs boson with MH ≤ 600 GeV, except
for the narrow mass range ≈ 122 − 127 GeV. In this mass range both the ATLAS and the CMS Collabora-tions observe a significant excess of events in data at MH ≈ 125 GeV with local significances of 5.9 and 5.0
s.d., respectively. These excesses are formed by smaller excesses observed in searches focused on H → γγ and H → ZZ(∗) decays, while no significant excesses have
been found in searches targeting fermionic decay modes (H → b¯b and H → τ+τ−) with the datasets analyzed so
far.
Searches for H → γγ are particularly sensitive to new particles beyond the SM contributing to the loop-mediated Hgg and/or Hγγ vertices, and to deviations in the couplings between the SM particles and the Higgs boson from those predicted by the SM. For example, al-ternative models of electroweak symmetry breaking [9] can involve suppressed couplings of the Higgs boson to fermions, with the extreme case being the fermiopho-bic Higgs boson (Hf) scenario, in which Hf has no
tree-level couplings to fermions but has SM coupling to weak gauge bosons. In this scenario the GF production mech-anism is absent, decays into fermions are heavily sup-pressed, and B(H → γγ) is significantly enhanced. The best-fit cross sections to the signal-like excesses in the H → γγ searches at the LHC show small deviations of about 1.5 s.d. above the SM prediction [7, 8]. A more detailed global fit to Higgs boson couplings [10] shows no significant deviations. Hence, the analysis of more data is needed for more definitive conclusions. Searches for a fermiophobic Higgs boson were performed by the LEP Collaborations [11], the CDF [12] and D0 [13] Col-laborations and, most recently, by the ATLAS [14] and CMS [15] Collaborations. The most restrictive limits re-sult from the combination of H → γγ, H → W+W− and
H → ZZ searches by the CMS Collaboration, excluding the mass range 110 < MHf < 194 GeV.
In this Article, we present the result from the search for a Higgs boson decaying into γγ using the complete dataset collected with the D0 detector in p¯p collisions at √s = 1.96 TeV during Run II of the Tevatron Col-lider. This search employs multivariate techniques to improve the signal-to-background discrimination, and is separately optimized for a SM Higgs boson and for a fermiophobic Higgs boson. Compared to the previous D0 publication [13], the sensitivity for the SM Higgs boson is improved by about 40%, resulting in the most restric-tive limits to date from the Tevatron in this decay mode. The search for a fermiophobic Higgs boson has compara-ble sensitivity with the most recent result from the CDF Collaboration [12]. This result constitutes an important
input for the upcoming publications on combinations of Higgs boson searches by the D0 experiment, as well as by both Tevatron experiments, using the complete Run II dataset.
II. D0 DETECTOR AND DATA SET
The D0 detector is described in detail elsewhere [16]. The subdetectors most relevant to this analysis are the central tracking system, composed of a silicon microstrip tracker (SMT) and a central fiber tracker (CFT) in a 2 T solenoidal magnetic field, the central preshower (CPS), and the liquid-argon and uranium sampling calorimeter. The SMT has about 800,000 individual strips, with typical pitch of 50–80 µm, and a design optimized for tracking and vertexing capability at pseudorapidities of |η| < 2.5 [17]. The system has a six-barrel longitudinal structure, each with a set of four layers arranged axially around the beam pipe, and interspersed with 16 radial disks. In the summer of 2006 an additional layer of silicon sensors was inserted at a radial distance of ≈ 16 mm from the beam axis, and the two outermost radial disks were removed. The CFT has eight thin coaxial barrels, each supporting two doublets of overlapping scintillating fibers of 0.835 mm diameter, one doublet being parallel to the collision axis, and the other alternating by ±3◦ relative
to the axis. Light signals are transferred via clear fibers to visible light photon counters (VLPC) that have about 80% quantum efficiency.
The CPS is located just outside of the superconducting magnet coil (in front of the calorimetry) and is formed by one radiation length of absorber followed by several layers of extruded triangular scintillator strips that are read out using wavelength-shifting fibers and VLPCs.
The calorimeter consists of three sections housed in separate cryostats: a central calorimeter covering up to |η| ≈ 1.1, and two end calorimeters extending the cov-erage up to |η| ≈ 4.2. Each section is divided into elec-tromagnetic (EM) layers on the inside and hadronic lay-ers on the outside. The EM part of the calorimeter is segmented into four longitudinal layers with transverse segmentation of ∆η × ∆φ = 0.1 × 0.1 [17], except in the third layer (EM3), where it is 0.05 × 0.05. The calorime-ter is well suited for a precise measurement of electron and photon energies, providing a resolution of ≈ 3.6% at energies of ≈ 50 GeV.
Luminosity is measured using plastic scintillator arrays located in front of the end calorimeter cryostats, cover-ing 2.7 < |η| < 4.4. Trigger and data acquisition systems are designed to accommodate the high luminosities of Run II. Based on preliminary information from tracking, calorimetry, and muon systems, the output of the first level of the trigger is used to limit the rate for accepted events to about 2 kHz. At the next trigger stage, with more refined information, the rate is reduced further to about 1 kHz. These first two levels of triggering rely mainly on hardware and firmware. The third and final
level of the trigger, with access to all the event infor-mation, uses software algorithms and a computing farm, and reduces the output rate to about 100 Hz, which is written to tape.
This analysis uses the complete dataset of p¯p collisions at √s = 1.96 TeV recorded with the D0 detector during Run II of the Tevatron Collider. The data are acquired using triggers requiring at least two clusters of energy in the EM calorimeter with loose shower shape require-ments and varying transverse momentum (pT)
thresh-olds between 15 GeV and 25 GeV. The trigger efficiency is close to 100% for final states containing two photon candidates with pT > 25 GeV. Only events for which
all subdetector systems are fully operational are consid-ered. The analyzed dataset corresponds to an integrated luminosity of 9.6 fb−1 [18].
III. EVENT SIMULATION
Monte Carlo (MC) samples of Higgs boson signal are generated separately for the GF, VH and VBF processes using the pythia [19] leading-order (LO) event gener-ator with the CTEQ6L1 [20] parton distribution func-tions (PDFs). Signal samples are generated for 100 ≤ MH≤ 150 GeV, in increments of 5 GeV. Signal samples
are normalized using the next-to-next-to-leading order (NNLO) plus next-to-next-to-leading-logarithm (NNLL) cross sections for GF [21] and NNLO for VH and VBF processes [22, 23], computed with the MSTW 2008 PDF set [24]. The Higgs boson’s branching fraction predic-tions are from hdecay [25]. To improve the signal mod-eling for the GF process, the pT of the Higgs boson is
corrected to match the prediction at NNLO+NNLL accu-racy by the hqt program [26]. In the case of the fermio-phobic model, where the GF process is absent, the VH and VBF cross sections are normalized to the SM pre-diction, while the modified H → γγ branching fractions are computed with hdecay.
The main background affecting this search is direct photon pair (DPP) production, where two isolated pho-tons with high transverse momenta are produced. The rest of the backgrounds are of instrumental origin and in-clude γ+jet (γj) and dijet (jj) production, where at least one jet is misidentified as a photon. A smaller instru-mental background originates from Z/γ∗ → e+e−
pro-duction, where both electrons are misidentified as pho-tons. The normalization and shape of the γj and jj backgrounds, as well as the overall normalization of the DPP background, are estimated from data, as discussed in Sect. V. The shape of the DPP background is modeled via a MC sample generated using sherpa [27] with the CTEQ6L1 PDF set. Recent measurements of DPP dif-ferential cross sections [28] have shown that sherpa pro-vides an adequate model of this process in the kinematic region of interest for this search. The Z/γ∗→ e+e−
pro-cess is modeled using alpgen [29] with the CTEQ6L1 PDF set, interfaced to pythia for parton showering and
hadronization, with a subsequent correction to the pT
spectrum of the Z boson to match measurements in data [30]. The Z/γ∗ → e+e− MC sample is normalized
to the NNLO theoretical cross section [31].
All MC samples are processed through a geant-based [32] simulation of the D0 detector. To accurately model the effects of multiple p¯p interactions and detector noise, data events from random p¯p crossings that have an in-stantaneous luminosity spectrum similar to the events in this analysis are overlaid on the MC events. These MC events are then processed using the same reconstruction algorithms as used on the data. Simulated events are cor-rected so that the physics object identification efficien-cies, energy scales and energy resolutions match those determined in data control samples.
IV. OBJECT IDENTIFICATION AND EVENT SELECTION
A. Photon reconstruction and energy scale
Photon candidates are formed from clusters of calorimeter cells within a cone of radius R = p(∆η)2+ (∆φ)2= 0.4 around a seed tower [16]. The
fi-nal cluster energy is then recalculated from the inner core with R = 0.2. The photon candidates are selected by re-quiring: (i) at least 95% of the cluster energy is deposited in the EM calorimeter layers, (ii) the calorimeter isola-tion I = [Etot(0.4) − EEM(0.2)]/EEM(0.2) < 0.1, where
Etot(0.4) is the total energy in a cone of radius R = 0.4
and EEM(0.2) is the EM energy in a cone of radius
R = 0.2, (iii) the scalar sum of the pTof all tracks (psumT,trk)
originating from the hard-scatter p¯p collision vertex (see Sect. IV B) in an annulus of 0.05 < R < 0.4 around the EM cluster is less than 2 GeV, and (iv) the energy-weighted EM shower width is required to be consistent with that expected for an electromagnetic shower. This analysis only considers photon candidates with pseudo-rapidity |ηγ| < 1.1.
To suppress electrons misidentified as photons, the EM clusters are required not to be spatially matched to sig-nificant tracker activity, either a track, or a pattern of hits in the SMT and CFT consistent with that of an electron or positron trajectory [33]. In the following, this requirement will be referred to as a “track-match” veto. To suppress jets misidentified as photons, an artificial neural network (NN) discriminant, which exploits dif-ferences in tracker activity and energy deposits in the calorimeter and CPS between photons and jets, is de-fined [34]. The photon NN is trained using diphoton and dijet MC samples generated using pythia, using the following discriminating variables: psum
T,trk, the
num-bers of cells above a certain threshold requirement in the first EM calorimeter layer within R < 0.2 and within 0.2 < R < 0.4 of the EM cluster, the number of asso-ciated CPS clusters within R < 0.1 of the EM cluster, and a measure of the width of the energy deposition in
NN
O
0 0.1 0.2 0.3 0.4 0.5 0.6 0.7 0.8 0.9 1Fraction of events / 0.05
0.05 0.1 0.15 0.2 0.25 0.3 0.35 0.4) data
µ
(l=e,
γ
-l
+l
→
Z
MC
γ
γ
Dijet MC
-1DØ, 9.6 fb
FIG. 1: Comparison of the normalized ONN spectra for pho-tons from DPP MC simulations and Z → ℓ+ℓ−γ data events (points with statistical error bars), and for misidentified jets from simulated dijet events.
the CPS. The performance of the photon NN is verified using a data event sample consisting of photons radiated from charged leptons in Z boson decays (Z → ℓ+ℓ−γ,
ℓ = e, µ) [35]. Figure 1 compares the NN output (ONN)
distributions of photons and jets. The shape of the ONN
distribution for photons is found to be in good agreement between data and the MC simulation and is significantly different from the shape for misidentified jets. The latter is validated using a sample enriched in jets misidentified as photons as discussed in Sect. V. Photon candidates are required to have a ONN value larger than 0.1, which
is close to 100% efficient for photons while rejecting ap-proximately 40% of the remaining misidentified jets.
The measured photon energies are calibrated using a two-step correction procedure. In the first step, the en-ergy response of the calorimeter to photons is calibrated using electrons from Z boson decays. The resulting cor-rections are then applied to all electromagnetic clusters. Since electrons and photons shower differently, with elec-trons suffering from a larger energy loss in material up-stream of the calorimeter, the application of this first set of corrections results in an overestimate of the photon en-ergy which depends on ηγ. In the second step, additional
corrections are derived for photons reconstructed in the central calorimeter using a detailed geant-based simu-lation of the D0 detector response. These corrections are derived as a function of photon transverse momentum (pγT) in seven intervals of ηγ: |ηγ| < 0.4, 0.4 ≤ |ηγ| < 0.6,
0.6 ≤ |ηγ| < 0.7, 0.7 ≤ |ηγ| < 0.8, 0.8 ≤ |ηγ| < 0.9,
0.9 ≤ |ηγ| < 1.0, and 1.0 ≤ |ηγ| < 1.1, and separately for
photons with and without a matched CPS cluster. The per-photon probability to have a matched CPS cluster is measured using photons radiated from charged leptons in Z boson decays (Z → ℓ+ℓ−γ, ℓ = e, µ) and is ≈ 73%.
The finer binning at higher η is motivated by the strong
dependence of the energy-loss corrections for electrons on η. The resulting corrections for photons with (without) a matched CPS cluster are largest at low pγT ≈ 20 GeV and range from about −1.5% in the |ηγ| < 0.4 interval,
to about −6% (−10%) in the |ηγ| ≥ 1.0 interval.
B. Primary vertex reconstruction
At the Tevatron the distribution of p¯p collision vertices has a Gaussian width of about 25 cm. The proper recon-struction of the event kinematics, in particular pγT and thus Mγγ, requires the reconstruction and then correct
selection of the hard-scatter p¯p collision primary vertex (PV) among the various candidate PVs originating from additional p¯p interactions.
The algorithm used for PV reconstruction is described in detail elsewhere [36]. In a first step, tracks with two or more associated SMT hits and pT> 0.5 GeV are
clus-tered along the z direction. This is followed by a Kalman Filter fit [37] to a common vertex of the tracks in each of the different vertices. Events are required to have at least one reconstructed PV with a z coordinate (zPV) within
60 cm from the center of detector, a requirement that is ≈ 98% efficient.
The selection of the hard-scatter PV from the list of PV candidates with |zPV| < 60 cm is based on an
algo-rithm exploiting both the track multiplicity of the differ-ent vertices and the transverse and longitudinal energy distributions in the EM calorimeter and the CPS. These energy distributions allow the estimation of the photon direction and thus the z coordinate of its production ver-tex along the beam direction. When one or both photons reconstructed in the EM calorimeter also deposit part of their energy in the CPS, the algorithm chooses the PV whose zPV is closest to the extrapolation of the photon
trajectory determined from the calorimeter and the CPS information [38], provided the distance between the co-ordinates of the vertex and of the photon trajectory is smaller than 3 s.d. The uncertainty on this distance is dominated by the uncertainty on the extrapolation of the photon direction, which ranges from ≈ 2.5 cm for photons with |ηγ| < 0.4 to ≈ 4.3 cm for photons with |ηγ| > 0.8.
Otherwise, the algorithm chooses the PV with the largest multiplicity of associated tracks.
This algorithm is optimized using Z/γ∗→ e+e− data
events, where the correct hard-scatter PV associated with the reconstructed tracks is treated as corresponding to a diphoton event by ignoring the track information from the e+e− pair, and added to the list of PV candidates
to which the selection algorithm will be applied. The fraction of Z/γ∗ → e+e− events for which the selected
PV agrees with the known hard-scatter PV is shown in Fig. 2 as a function of diphoton transverse momentum (pγγT) for two different hard-scatter PV selection
algo-rithms. For an algorithm selecting the hard-scatter PV as the one with the highest track multiplicity, the average selection probability is only ≈ 65% and shows a
(GeV)
γ γ Tp
0 10 20 30 40 50 60 70 80 90 100PV selection probability
0 0.2 0.4 0.6 0.8 1 PV) trk Data (max n PV) trk MC (max n pointing PV) γ + trk Data (max n pointing PV) γ + trk MC (max n -1 DØ, 9.6 fbFIG. 2: Probability to select the correct hard-scatter PV as a function of pγγ
T as measured in Z/γ∗→ e
+e−events excluding the electron and positron tracks from consideration. The two different algorithms discussed in the text are compared.
cant dependence on pγγT. The improved algorithm used in this analysis, including also photon pointing informa-tion, achieves an average selection probability of ≈ 95%, almost constant as a function of pγγT .
C. Event selection
At least two photon candidates satisfying the require-ments listed in Sect. IV A and having pγT> 25 GeV and
|ηγ| < 1.1 are required. If more than two photon
candi-dates are identified, only the two photon candicandi-dates with highest pγTare considered. At least one of the photon can-didates in each event is required to have a matched CPS cluster. The photon kinematic variables are computed with respect to the vertex selected using the algorithm described in Sect. IV B. A requirement of Mγγ > 60 GeV
is made to ensure a trigger efficiency close to 100%. The acceptance of the kinematic requirements is ≈ 42%, as estimated by applying the pγT and ηγ
require-ments to generated photons in a gg → H → γγ MC sam-ple assuming MH= 125 GeV. At the same assumed MH,
the overall event selection efficiency, taking into account acceptance and reconstruction, identification and selec-tion efficiencies, is ≈ 22%, almost independent on the signal production mechanism.
To improve the sensitivity to signal, events are cate-gorized into two statistically independent samples with different signal-to-background ratios. Events where both photon candidates satisfy ONN > 0.75
(“photon-enriched” sample) and events where at least one pho-ton candidate satisfies 0.1 < ONN< 0.75 (“jet-enriched”
sample) are analyzed separately. The corresponding sam-ple compositions are discussed in Sect. V.
(GeV)
γ γM
100 110 120 130 140 150)
-1(GeV
γγ1/N dN/dM
0 0.02 0.04 0.06 0.08 0.1 0.12 0.14 =125 GeV) H (M γ γ → H Fit DØ SimulationFIG. 3: Distribution of the reconstructed diphoton invariant mass distribution corresponding to a Higgs boson signal with MH = 125 GeV. The line shows the result of a fit to the distribution using the functional form described in Sect. IV D.
D. Invariant mass reconstruction
After the selection of the p¯p collision vertex and the photon energy scale corrections, the Mγγ distribution
for a Higgs boson signal follows a Gaussian distribution peaking at the generated Higgs boson mass, with small non-Gaussian tails. This distribution can be modeled by the sum of a Crystal Ball function [39], describing a narrow Gaussian core and a power-law tail toward lower masses, and a wider Gaussian distribution, describing tails from misvertexing or imperfect photon energy scale corrections. Figure 3 shows such a fit to the inclusive Mγγ spectrum for signal MC with MH = 125 GeV. The
resolution of the Gaussian core is found to be ≈ 3.1 GeV, and varies by ±13% when varying MH by ±25 GeV.
V. BACKGROUND MODELING AND SAMPLE COMPOSITION
The normalization and shape of the Z/γ∗ → e+e−
background are estimated using simulation. Electrons are misidentified as photons at a rate of about 2% due to track reconstruction inefficiencies. Such tracking in-efficiency is measured in data using a “tag-and-probe” method, where Z → e+e− events are selected with one
of the electrons (“tag”) passing all identification criteria, including matching of the track to the calorimeter clus-ter, while only calorimeter requirements are applied to the other electron (“probe”). The electron misidentifica-tion rate is computed as the fracmisidentifica-tion of events where the probe electron satisfies the “track-match” veto require-ment defined in Sect. IV A. The misidentification rate measured in data in this way is applied to the simulated
Z/γ∗→ e+e− sample.
The γj and jj yields are estimated using a data-driven method [40] (“matrix method”). For selected events, the two photons are separated into two types: those with ONN> 0.75 (well-identified photon, “p”) and those with
0.1 < ONN < 0.75 (likely fake photon, “f”). Events are
then classified in four categories: (i) two type-p photons, (ii) the higher pγT(leading) photon is type p and the lower pγT(trailing) photon is type f, (iii) the leading photon is type f and the trailing photon is type p, and (iv) two type-f photons. The corresponding numbers otype-f events, atype-fter subtracting the Z/γ∗→ e+e− contribution, are denoted
as Npp, Npf, Nfpand Nff. The different efficiencies of the
ONN > 0.75 requirement for photons (ǫγ) and jets (ǫj)
are used to estimate the sample composition by solving a system of linear equations:
(Nγγ, Nγj, Njγ, Njj) = (Npp, Npf, Nfp, Nff) × E−1, (1)
where Nγγ (Njj) is the number of γγ (jj) events and
Nγj (Njγ) is the number of γj events with the leading
(trailing) cluster as the photon. The 4×4 matrix E is con-structed with the efficiency terms ǫγ and ǫj,
parameter-ized as a function of |ηγ| for each photon candidate as
de-termined from photon and jet MC samples, respectively. The ǫγ and ǫj efficiencies averaged over |ηγ| are ≈ 76%
and ≈ 35%, respectively. The efficiency ǫγ is validated
with a data sample of photons radiated from charged lep-tons in Z boson decays (Z → ℓ+ℓ−γ, ℓ = e, µ). The
effi-ciency ǫjis validated using two independent control data
samples enriched in jets misidentified as photons, either by inverting the photon isolation variable (I > 0.1), or by requiring at least one track in a cone of R < 0.05 around the photon [41]. In the following, the sum of γj and jγ contributions will be denoted as γj for simplic-ity. The shapes of kinematic distributions for γj (jj) background are obtained from independent control sam-ples by requiring one (two) photon candidate(s) to sat-isfy ONN < 0.1. The ONN < 0.1 requirement leads to
a mis-modeling of the ηγ spectrum, due to the |ηγ|
de-pendence of ǫj. This is corrected by assigning a weight
factor defined as ǫj(|ηγ|)/(1-ǫj(|ηγ|)) for each of the
pho-ton candidates with ONN< 0.1.
As discussed in Sect. III, the kinematics of the DPP background are predicted using sherpa. Since the es-timated Nγγ from solving Eq. 1 could include a
con-tribution from signal events, it is only used as a prior normalization for the DPP background to compare be-tween data and background prediction. The normaliza-tion of the DPP background is ultimately determined from an unconstrained fit to the final discriminants used for hypothesis testing in both the photon-enriched and jet-enriched samples. For each of these samples, two distributions are considered: a multivariate discriminant (see Sect. VI) constructed to maximize the separation be-tween signal and background for events with Mγγ falling
in the interval MH± 30 GeV (”search region”), and the
Mγγ spectrum for events outside this interval
(”side-band region”) that provide a high-statistics
(GeV)
γ γM
60 80 100 120 140 160 180 200Events / 5 GeV
200 400 600 800 1000 1200 1400 1600 1800 Data γ γ +jet γ jet+jet ee → * γ Z/ =125 GeV) H 100 (M × Signal =125 GeV) Hf 100 (M × Signal -1 DØ, 9.6 fb (a)(GeV)
γ γM
60 80 100 120 140 160 180 200Events / 5 GeV
200 400 600 800 1000 1200 1400 1600 1800(GeV)
γ γM
60 80 100 120 140 160 180 200Events / 5 GeV
200 400 600 800 1000 1200 1400 1600 1800(GeV)
γ γM
60 80 100 120 140 160 180 200Events / 5 GeV
500 1000 1500 2000 2500 Data γ γ +jet γ jet+jet ee → * γ Z/ =125 GeV) H 100 (M × Signal =125 GeV) Hf 100 (M × Signal -1 DØ, 9.6 fb (b)(GeV)
γ γM
60 80 100 120 140 160 180 200Events / 5 GeV
500 1000 1500 2000 2500(GeV)
γ γM
60 80 100 120 140 160 180 200Events / 5 GeV
500 1000 1500 2000 2500FIG. 4: (color online). Distribution of Mγγ in (a) the photon-enriched sample and (b) the jet-photon-enriched sample. The data (points with statistical error bars) are compared to the back-ground prediction, broken down into its individual compo-nents. The expected distributions for a SM Higgs boson and a fermiophobic Higgs boson with MH = 125 GeV are also shown scaled by a factor of 100.
dominated sample. A comparison between data and the background prediction for the Mγγ spectrum, separately
in the photon-enriched and the jet-enriched samples, is shown in Fig. 4.
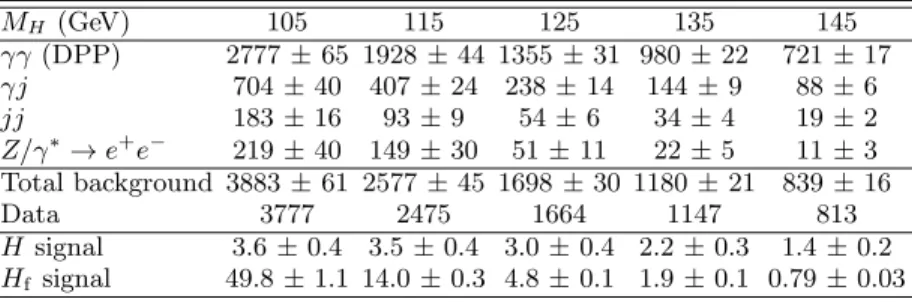
Tables I and II summarize the number of data events, expected backgrounds, and expected SM and fermio-phobic Higgs boson signals, resulting from the fit for five hypothesized Higgs boson masses, for the photon-enriched and jet-photon-enriched samples, respectively. For MH = 125 GeV, the estimated background composition
for the photon-enriched sample in the Mγγ interval of
[95 GeV, 155 GeV] is about 80% (DPP), 14% (γj), 3% (jj) and 3% (Z/γ∗ → e+e−). The corresponding
com-position for the jet-enriched sample is about 48% (DPP), 31% (γj), 18% (jj) and 3% (Z/γ∗→ e+e−).
MH (GeV) 105 115 125 135 145 γγ (DPP) 2777 ± 65 1928 ± 44 1355 ± 31 980 ± 22 721 ± 17 γj 704 ± 40 407 ± 24 238 ± 14 144 ± 9 88 ± 6 jj 183 ± 16 93 ± 9 54 ± 6 34 ± 4 19 ± 2 Z/γ∗ → e+e− 219 ± 40 149 ± 30 51 ± 11 22 ± 5 11 ± 3 Total background 3883 ± 61 2577 ± 45 1698 ± 30 1180 ± 21 839 ± 16 Data 3777 2475 1664 1147 813 H signal 3.6 ± 0.4 3.5 ± 0.4 3.0 ± 0.4 2.2 ± 0.3 1.4 ± 0.2 Hf signal 49.8 ± 1.1 14.0 ± 0.3 4.8 ± 0.1 1.9 ± 0.1 0.79 ± 0.03
TABLE I: Signal, backgrounds and data yields for the photon-enriched sample within the MH± 30 GeV mass window, for MH = 105 GeV to MH = 145 GeV in 10 GeV intervals. The background yields are from a fit to the data. The uncertainties include both statistical and systematic contributions added in quadrature and take into account correlations among processes. The uncertainty on the total background is smaller than the sum in quadrature of the uncertainties in the individual background sources due to the anti-correlation resulting from the fit.
MH (GeV) 105 115 125 135 145 γγ (DPP) 1969 ± 47 1406 ± 33 1012 ± 24 734 ± 17 545 ± 13 γj 1852 ± 100 1101 ± 60 653 ± 36 391 ± 22 251 ± 15 jj 1188 ± 94 647 ± 54 365 ± 31 219 ± 19 135 ± 12 Z/γ∗ → e+e− 227 ± 39 152 ± 28 61 ± 11 30 ± 7 20 ± 5 Total background 5236 ± 67 3307 ± 45 2091 ± 29 1374 ± 21 951 ± 17 Data 5287 3384 2156 1422 989 H signal 2.7 ± 0.3 2.6 ± 0.3 2.2 ± 0.3 1.7 ± 0.2 1.1 ± 0.1 Hf signal 34.8 ± 0.8 9.8 ± 0.3 3.4 ± 0.1 1.34 ± 0.04 0.56 ± 0.02
TABLE II: Signal, backgrounds and data yields for the jet-enriched sample within the MH± 30 GeV mass window, for MH= 105 GeV to MH = 145 GeV in 10 GeV intervals. The background yields are from a fit to the data. The uncertainties include both statistical and systematic contributions added in quadrature and take into account correlations among processes. The uncertainty on the total background is smaller than the sum in quadrature of the uncertainties in the individual background sources due to the anti-correlation resulting from the fit.
VI. SIGNAL-TO-BACKGROUND DISCRIMINATION
The diphoton mass Mγγ is the most effective
discrim-inating variable between the Higgs boson signal and the background. However, further discrimination can be achieved by exploiting additional kinematic variables as well as photon quality variables. A total of ten well-modeled discriminating variables are considered in this search. Two of these variables correspond to kinematic properties of the photons: leading photon transverse mo-mentum (pγ1T) and trailing photon transverse momentum
(pγ2T) which, as illustrated in Fig. 5, follow a harder spec-trum in signal than in background, as expected for the decay of a heavy resonance. Three of the variables are related to the kinematics of the diphoton system: Mγγ,
pγγT and azimuthal angle separation between the photons (∆φγγ). The two latter variables give discrimination due
to the large pTof the Higgs boson in VH and VBF
pro-duction. Therefore, as illustrated in Fig. 6, pγγT and ∆φγγ
are particularly sensitive variables in the search for a fermiophobic Higgs boson.
The scalar nature of the Higgs boson affects the an-gular distributions of the photons in the diphoton rest frame. To minimize uncertainties from the transverse momentum of the colliding partons, the Collins-Soper
frame [42] is used. In this frame, the z axis is defined as the bisector of the proton beam momentum and the negative of the antiproton beam momentum when they are boosted into the center-of-mass frame of the diphoton pair. The variable θ∗is defined as the angle between the
leading photon momentum and the z axis. The variable φ∗ is defined as the angle between the diphoton plane
and the p¯p plane. Due to the restriction to photons with |ηγ| < 1.1 in this analysis, the cos θ∗ distribution has
little discrimination between signal and background, al-though it is considered in the search. In contrast, the angle φ∗ provides useful discrimination between signal
and background, particularly for a fermiophobic Higgs boson, as illustrated in Fig. 7(a).
A significant fraction of W and Z boson decays in VH production involves neutrinos that result in large miss-ing transverse energy (E/T) in the final state. In con-trast, the E/T in background events is typically low, and mostly resulting from jet energy mismeasurements. The E/T distribution in the jet-enriched sample is shown in Figure 7(b). The E/T is reconstructed as the negative of the vectorial sum of the pT of calorimeter cells, and is
corrected for the pT of identified muons and the energy
corrections to reconstructed jets in the calorimeter [43]. Finally, the ONN distributions for the leading photon
(Oγ1NN) and the trailing photon (ONNγ2) show discrimina-tion between signal and the γj and jj backgrounds, in
(GeV)
1 γ Tp
20 30 40 50 60 70 80 90 100Events / 5 GeV
500 1000 1500 2000 2500 Data γ γ +jet γ jet+jet ee → * γ Z/ =125 GeV) H 1000 (M × Signal =125 GeV) Hf 1000 (M × Signal -1 DØ, 9.6 fb (a)(GeV)
1 γ Tp
20 30 40 50 60 70 80 90 100Events / 5 GeV
500 1000 1500 2000 2500(GeV)
1 γ Tp
20 30 40 50 60 70 80 90 100Events / 5 GeV
500 1000 1500 2000 2500(GeV)
1 γ Tp
20 30 40 50 60 70 80 90 100Events / 5 GeV
500 1000 1500 2000 2500(GeV)
1 γ Tp
20 30 40 50 60 70 80 90 100Events / 5 GeV
500 1000 1500 2000 2500(GeV)
1 γ Tp
20 30 40 50 60 70 80 90 100Events / 5 GeV
500 1000 1500 2000 2500(GeV)
1 γ Tp
20 30 40 50 60 70 80 90 100Events / 5 GeV
500 1000 1500 2000 2500(GeV)
2 γ Tp
20 30 40 50 60 70 80 90 100Events / 5 GeV
1000 2000 3000 4000 5000 Data γ γ +jet γ jet+jet ee → * γ Z/ =125 GeV) H 1000 (M × Signal =125 GeV) Hf 1000 (M × Signal -1 DØ, 9.6 fb (b)(GeV)
2 γ Tp
20 30 40 50 60 70 80 90 100Events / 5 GeV
1000 2000 3000 4000 5000(GeV)
2 γ Tp
20 30 40 50 60 70 80 90 100Events / 5 GeV
1000 2000 3000 4000 5000FIG. 5: (color online). Distribution of (a) pγ1T in the photon-enriched sample and (b) pγ2
T in the jet-enriched sample. The data (points with statistical error bars) are compared to the background prediction, broken down into its individual com-ponents. The expected distributions for a SM Higgs boson and a fermiophobic Higgs boson with MH = 125 GeV are also shown scaled by a factor of 1000. These two BDT input vari-ables are used in both the photon-enriched and jet-enriched samples, but are displayed here for only one of the samples for illustrative purposes.
particular in the jet-enriched sample, as illustrated in Fig. 8. The observed discrepancies between the data and the total prediction in the shape of the distribution are partly covered by the combination of statistical uncer-tainties on the templates and the systematic uncertain-ties, and they have been checked to have a negligible impact on the final result.
To improve the sensitivity of the search, a boosted-decision-tree (BDT) technique [44] is used to build a single discriminating variable combining the information from the ten variables. A different BDT is trained, for each MH hypothesis, for events selected in the search
(GeV)
γ γ Tp
0 10 20 30 40 50 60 70 80 90 100Events / 5 GeV
500 1000 1500 2000 2500 Data γ γ +jet γ jet+jet ee → * γ Z/ =125 GeV) H 1000 (M × Signal =125 GeV) Hf 1000 (M × Signal -1 DØ, 9.6 fb (a)(GeV)
γ γ Tp
0 10 20 30 40 50 60 70 80 90 100Events / 5 GeV
500 1000 1500 2000 2500(GeV)
γ γ Tp
0 10 20 30 40 50 60 70 80 90 100Events / 5 GeV
500 1000 1500 2000 2500(GeV)
γ γ Tp
0 10 20 30 40 50 60 70 80 90 100Events / 5 GeV
500 1000 1500 2000 2500(GeV)
γ γ Tp
0 10 20 30 40 50 60 70 80 90 100Events / 5 GeV
500 1000 1500 2000 2500(GeV)
γ γ Tp
0 10 20 30 40 50 60 70 80 90 100Events / 5 GeV
500 1000 1500 2000 2500(GeV)
γ γ Tp
0 10 20 30 40 50 60 70 80 90 100Events / 5 GeV
500 1000 1500 2000 2500 γ γφ
∆
0 0.5 1 1.5 2 2.5 3π
Events / 0.05
1 10 2 10 3 10 4 10 5 10 6 10 Data γ γ +jet γ jet+jet ee → * γ Z/ =125 GeV) H 1000 (M × Signal =125 GeV) Hf 1000 (M × Signal -1 DØ, 9.6 fb (b) γ γφ
∆
0 0.5 1 1.5 2 2.5 3π
Events / 0.05
1 10 2 10 3 10 4 10 5 10 6 10 γ γφ
∆
0 0.5 1 1.5 2 2.5 3π
Events / 0.05
1 10 2 10 3 10 4 10 5 10 6 10 γ γφ
∆
0 0.5 1 1.5 2 2.5 3π
Events / 0.05
1 10 2 10 3 10 4 10 5 10 6 10 γ γφ
∆
0 0.5 1 1.5 2 2.5 3π
Events / 0.05
1 10 2 10 3 10 4 10 5 10 6 10 γ γφ
∆
0 0.5 1 1.5 2 2.5 3π
Events / 0.05
1 10 2 10 3 10 4 10 5 10 6 10FIG. 6: (color online). Distribution of (a) pγγT in the photon-enriched sample and (b) ∆φγγ in the jet-enriched sample. The data (points with statistical error bars) are compared to the background prediction, broken down into its individ-ual components. The expected distributions for a SM Higgs boson and a fermiophobic Higgs boson with MH = 125 GeV are also shown scaled by a factor of 1000. These two BDT input variables are used in both the photon-enriched and jet-enriched samples, but are displayed here for only one of the samples for illustrative purposes.
region, corresponding to Mγγ falling in the interval of
MH ± 30 GeV. The training is performed separately
for the SM and the fermiophobic Higgs bosons models, considering in each case the sum of all relevant signals against the sum of all backgrounds. A separate BDT is trained in the photon-enriched and jet-enriched sam-ples, respectively. The resulting BDT output distribu-tions assuming a SM and a fermiophobic Higgs boson with MH = 125 GeV are shown in Figs. 9 and 10,
re-spectively. Prior to fitting the background yields to the data, these distributions are well modeled by the sim-ulation and no significant excess above the background
*
φ
0 0.2 0.4 0.6 0.8 1 1.2 1.4π
Events / 0.05
200 400 600 800 1000 1200 1400 1600 1800 2000 2200 Data γ γ +jet γ jet+jet ee → * γ Z/ =125 GeV) H 1000 (M × Signal =125 GeV) Hf 1000 (M × Signal -1 DØ, 9.6 fb (a) *φ
0 0.2 0.4 0.6 0.8 1 1.2 1.4π
Events / 0.05
200 400 600 800 1000 1200 1400 1600 1800 2000 2200 *φ
0 0.2 0.4 0.6 0.8 1 1.2 1.4π
Events / 0.05
200 400 600 800 1000 1200 1400 1600 1800 2000 2200 *φ
0 0.2 0.4 0.6 0.8 1 1.2 1.4π
Events / 0.05
200 400 600 800 1000 1200 1400 1600 1800 2000 2200 *φ
0 0.2 0.4 0.6 0.8 1 1.2 1.4π
Events / 0.05
200 400 600 800 1000 1200 1400 1600 1800 2000 2200(GeV)
TE
0 10 20 30 40 50 60 70 80 90 100Events / 5 GeV
1000 2000 3000 4000 5000 Data γ γ +jet γ jet+jet ee → * γ Z/ =125 GeV) H 1000 (M × Signal =125 GeV) Hf 1000 (M × Signal -1 DØ, 9.6 fb (b)(GeV)
TE
0 10 20 30 40 50 60 70 80 90 100Events / 5 GeV
1000 2000 3000 4000 5000(GeV)
TE
0 10 20 30 40 50 60 70 80 90 100Events / 5 GeV
1000 2000 3000 4000 5000FIG. 7: (color online). Distribution of (a) φ∗in the photon-enriched sample and (b) E/T in the jet-enriched sample. The data (points with statistical error bars) are compared to the background prediction, broken down into its individual com-ponents. The expected distributions for a SM Higgs boson and a fermiophobic Higgs boson with MH = 125 GeV are also shown scaled by a factor of 1000. These two BDT input vari-ables are used in both the photon-enriched and jet-enriched samples, but are displayed here for only one of the samples for illustrative purposes.
prediction is observed at high values of the BDT output.
VII. SYSTEMATIC UNCERTAINTIES
Systematic uncertainties affecting the normalization and shape of the BDT output distributions are estimated for both signal and backgrounds, taking into account cor-relations. Experimental uncertainties affecting the nor-malization of the signal and the Z/γ∗ → e+e−
back-ground include the integrated luminosity (6.1%), track-ing system live-time correction (2.0%), trigger efficiency
1 γ NN
O
0 0.1 0.2 0.3 0.4 0.5 0.6 0.7 0.8 0.9 1Events / 0.05
200 400 600 800 1000 1200 1400 1600 1800 Data γ γ +jet γ jet+jet ee → * γ Z/ =125 GeV) H 1000 (M × Signal =125 GeV) Hf 1000 (M × Signal -1 DØ, 9.6 fb (a) 1 γ NNO
0 0.1 0.2 0.3 0.4 0.5 0.6 0.7 0.8 0.9 1Events / 0.05
200 400 600 800 1000 1200 1400 1600 1800 1 γ NNO
0 0.1 0.2 0.3 0.4 0.5 0.6 0.7 0.8 0.9 1Events / 0.05
200 400 600 800 1000 1200 1400 1600 1800 1 γ NNO
0 0.1 0.2 0.3 0.4 0.5 0.6 0.7 0.8 0.9 1Events / 0.05
200 400 600 800 1000 1200 1400 1600 1800 1 γ NNO
0 0.1 0.2 0.3 0.4 0.5 0.6 0.7 0.8 0.9 1Events / 0.05
200 400 600 800 1000 1200 1400 1600 1800 1 γ NNO
0 0.1 0.2 0.3 0.4 0.5 0.6 0.7 0.8 0.9 1Events / 0.05
200 400 600 800 1000 1200 1400 1600 1800 1 γ NNO
0 0.1 0.2 0.3 0.4 0.5 0.6 0.7 0.8 0.9 1Events / 0.05
200 400 600 800 1000 1200 1400 1600 1800 2 γ NNO
0 0.1 0.2 0.3 0.4 0.5 0.6 0.7 0.8 0.9 1Events / 0.05
200 400 600 800 1000 1200 1400 1600 1800 Data γ γ +jet γ jet+jet ee → * γ Z/ =125 GeV) H 1000 (M × Signal =125 GeV) Hf 1000 (M × Signal -1 DØ, 9.6 fb (b) 2 γ NNO
0 0.1 0.2 0.3 0.4 0.5 0.6 0.7 0.8 0.9 1Events / 0.05
200 400 600 800 1000 1200 1400 1600 1800 2 γ NNO
0 0.1 0.2 0.3 0.4 0.5 0.6 0.7 0.8 0.9 1Events / 0.05
200 400 600 800 1000 1200 1400 1600 1800 2 γ NNO
0 0.1 0.2 0.3 0.4 0.5 0.6 0.7 0.8 0.9 1Events / 0.05
200 400 600 800 1000 1200 1400 1600 1800 2 γ NNO
0 0.1 0.2 0.3 0.4 0.5 0.6 0.7 0.8 0.9 1Events / 0.05
200 400 600 800 1000 1200 1400 1600 1800 2 γ NNO
0 0.1 0.2 0.3 0.4 0.5 0.6 0.7 0.8 0.9 1Events / 0.05
200 400 600 800 1000 1200 1400 1600 1800 2 γ NNO
0 0.1 0.2 0.3 0.4 0.5 0.6 0.7 0.8 0.9 1Events / 0.05
200 400 600 800 1000 1200 1400 1600 1800FIG. 8: (color online). Distribution of (a) Oγ1NN and (b) ONNγ2 in the jet-enriched sample. The data (points with statisti-cal error bars) are compared to the background prediction, broken down into its individual components. The expected distributions for a SM Higgs boson and a fermiophobic Higgs boson with MH = 125 GeV are also shown scaled by a fac-tor of 1000. These two BDT input variables are used as well in the photon-enriched sample, although their discrimination power is limited given the ONN > 0.75 requirement applied to both photons.
(0.1%), PV reconstruction efficiency (0.2%), and pho-ton identification efficiency for signal (3.9%) or electron misidentification rate for Z/γ∗→ e+e−(12.7%). The
im-pact from PDF uncertainties on the signal acceptance is 1.7%–2.2% depending on MH. Additional sources of
un-certainty affecting the normalization result from uncer-tainties on the theoretical cross section (including varia-tions of the renormalization and factorization scales [45] and the PDFs [46]) for signal (GF (14.1%), VH (6.2%) and VBF (4.9%)) and Z/γ∗→ e+e− (3.9%) production.
The normalization uncertainties affecting the γj and jj background predictions result from propagating the