HAL Id: hal-00296092
https://hal.archives-ouvertes.fr/hal-00296092
Submitted on 7 Dec 2006
HAL is a multi-disciplinary open access
archive for the deposit and dissemination of
sci-entific research documents, whether they are
pub-lished or not. The documents may come from
teaching and research institutions in France or
abroad, or from public or private research centers.
L’archive ouverte pluridisciplinaire HAL, est
destinée au dépôt et à la diffusion de documents
scientifiques de niveau recherche, publiés ou non,
émanant des établissements d’enseignement et de
recherche français ou étrangers, des laboratoires
publics ou privés.
hydroperoxides at Jungfraujoch Observatory,
Switzerland
S. J. Walker, M. J. Evans, A. V. Jackson, M. Steinbacher, C. Zellweger, J. B.
Mcquaid
To cite this version:
S. J. Walker, M. J. Evans, A. V. Jackson, M. Steinbacher, C. Zellweger, et al.. Processes controlling the
concentration of hydroperoxides at Jungfraujoch Observatory, Switzerland. Atmospheric Chemistry
and Physics, European Geosciences Union, 2006, 6 (12), pp.5525-5536. �hal-00296092�
© Author(s) 2006. This work is licensed under a Creative Commons License.
Chemistry
and Physics
Processes controlling the concentration of hydroperoxides at
Jungfraujoch Observatory, Switzerland
S. J. Walker1, M. J. Evans1, A. V. Jackson1, M. Steinbacher2, C. Zellweger2, and J. B. McQuaid1
1Institute for Atmospheric Science, School of the Earth and Environment, University of Leeds, Leeds, UK
2Swiss Federal Institute for Materials Science and Technology (Empa), Laboratory for Air Pollution/Environmental Technology, 8600 D¨ubendorf, Switzerland
Received: 6 June 2006 – Published in Atmos. Chem. Phys. Discuss.: 28 July 2006 Revised: 17 October 2006 – Accepted: 30 November 2006 – Published: 7 December 2006
Abstract. An automated, ground-based instrument was used
to measure gas-phase hydroperoxides at the Jungfraujoch High Altitude Research Station as part of the Free Tro-pospheric EXperiment (FREETEX) during February/March 2003. A nebulising reflux concentrator sampled ambient air twice hourly, prior to on-site analysis by HPLC speciation, coupled with post-column peroxidase derivatisation and flu-orescence detection. Hydrogen peroxide (H2O2) concentra-tions reached up to 1330 pptv over the 13-day period with a mean of 183±233 pptv (± one standard deviation). Methyl hydroperoxide (CH3OOH) reached up to 379 pptv with a mean of 51±55 pptv. No other organic hydroperoxides were detected. The lack of an explicit diurnal cycle suggests that hydroperoxide concentrations are chiefly influenced by trans-port processes rather than local photochemistry at this moun-tainous site. There was some evidence that elevated concen-trations of H2O2 existed in air-masses originating from the south-west, suggesting higher concentrations of HOxdue to more active photochemistry. Air which had been recently polluted exhibited low H2O2concentration due to a combi-nation of suppression of HO2by NOxand deposition. The concentrations of H2O2sampled here are consistent with pre-vious box modelling studies of hydroperoxides, except in pe-riods influenced by the boundary layer, where agreement re-quired a depositional sink.
1 Introduction
Hydroperoxides play an important role in gas-phase free radical chemistry of the atmosphere and in the aqueous-phase chemistry of acid precipitation. Hydroperoxides such as hydrogen peroxide (H2O2) and methyl hydroperoxide (CH3OOH) are produced through the self-reaction of
per-Correspondence to: A. V. Jackson
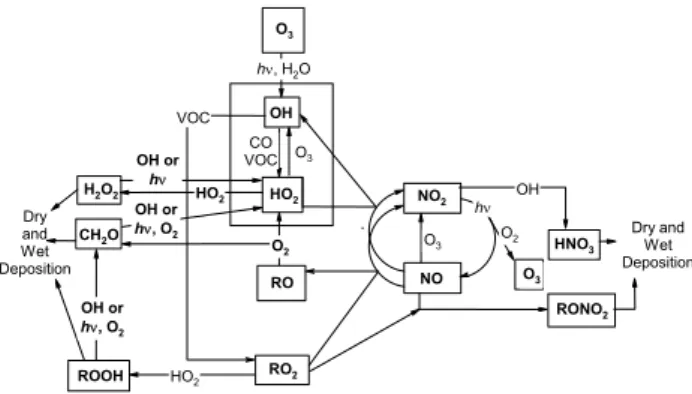
oxy radicals (hydroperoxy, HO2 and organic peroxy, RO2) (e.g. Lee et al., 2000). These peroxy radicals are intimately linked to ozone (O3) production and loss, leading to hy-droperoxides being a key diagnostic of the chemical state of the atmosphere. The chemistry of odd oxygen species (Ox), HOx(the hydroxyl radical, OH and HO2) and ROx(RO and RO2) is summarized in Fig. 1. H2O2is also a major oxidant of sulphur dioxide (SO2) in clouds (Penkett et al., 1979) so alongside O3 and OH, its measurement is needed to assess the oxidative capacity of the atmosphere.
Previous analyses of H2O2 and CH3OOH observations have identified key physical and chemical processes control-ling their concentration (e.g. Heikes et al., 1987). As shown in Fig. 1, the production of H2O2is controlled by the abun-dance of HO2, which shows sensitivity to HOx production, loss and recycling. Formation of peroxy radicals is predomi-nantly through the photo-oxidation of carbon monoxide (CO) and volatile organic compounds (VOC), by the OH radical (detailed in Lightfoot et al., 1992). A second significant source is from formaldehyde (CH2O), which undergoes pho-tolysis and reaction with OH to produce HO2.
Air-masses rich in nitrogen oxides, NOx (NO and NO2) tend to show lower H2O2concentrations as peroxy radicals oxidise NO to NO2 rather than self-reacting to form H2O2 (Tremmel et al., 1993; Penkett et al., 1995) and total radi-cal loadings are suppressed by nitric acid (HNO3) produc-tion through the reacproduc-tion of OH with NO2radicals (Poppe et al., 1993). According to Lee et al. (2000), substantial sup-pression of hydroperoxide production occurs at NO concen-trations exceeding 100 pptv. It is calculated that NO con-centrations below 3 to 20 pptv are needed for hydroperoxide production to dominate over the reaction between HO2and NO (Reeves and Penkett, 2003; Crutzen and Zimmermann, 1991; Finlayson-Pitts and Pitts, 1986). Such low concentra-tions of NO can only be found in very remote regions of the troposphere lacking NOxsources.
O3 RO2 hν, H2O OH or hν, O2 VOC RO O2 OH HO2 CO VOC O3 H2O2 ROOH NO2 O3 NO hν O3
O2 Dry and Wet
Deposition HNO3 OH HO2 HO2 CH2O RONO2 OH or hν Dry and Wet Deposition OH or hν, O2
Fig. 1. Tropospheric gas-phase reactions linked to hydroperoxides.
Lower concentrations of H2O2are observed in air-masses exposed to the ground or clouds due to dry and wet depo-sition (e.g. Kleinman, 1986; Heikes et al., 1987; Chandler et al., 1988; Gallagher et al., 1991). Rapid loss of gaseous H2O2into clouds is due to a high Henry’s law coefficient of H2O2(HH2O2 is 7.73×10
4M atm−1 at 298 K, Sander et al., 2003) and rapid oxidation of S(IV) species to S(VI) within the aqueous phase. Other important H2O2 and CH3OOH sinks are their reaction with OH radicals and photolysis at ultraviolet wavelengths.
The aim of this paper is to investigate the impact of these chemical and physical processes on the concentration of H2O2and CH3OOH at a remote mountainous site and to un-derstand the usefulness of H2O2observations as a diagnostic of the atmospheric compositional system.
2 Experimental
2.1 Site description
The observations are from the FREE Tropospheric EXper-iment (FREETEX) that took place in February to March 2003 at the Sphinx Observatory, Jungfraujoch High Alti-tude Research Station (7.98◦E, 46.55◦N) (subsequently re-ferred to as JFJ) situated at 3580 m above mean sea level (a.m.s.l.). There have been three previous FREETEX cam-paigns in 1996, 1998 and 2001 at this site (Zanis et al., 1999, 2000a, b, 2003; Carpenter et al., 2000). The Sphinx Observatory resides in a saddle between the two alpine summits, Jungfrau (4155 m a.m.s.l.) to the south-west and M¨onch (4099 m a.m.s.l.) to the north-east, in the Swiss Alps. This leads to mainly north-westerly and southerly air-masses reaching the station (see Fig. 2). The site characteristics are described in Zellweger et al. (2003). The observatory is usually thought to be located in the lower free troposphere (FT) in winter and early spring but can experience plane-tary boundary layer (PBL) air (Carpenter et al., 2000), es-pecially in the summer when convection is enhanced (Bal-tensperger et al., 1997; Lugauer et al., 1998, Zellweger et al.,
2003). The high altitude site is thought to experience few local emission sources, and therefore can offer ideal condi-tions for long-term sampling of free tropospheric air. The JFJ is incorporated in the Swiss National Air Pollution Mon-itoring Network (NABEL), which is maintained by EMPA D¨ubendorf on behalf of the Swiss Federal Office for the En-vironment (FOEN). Among other species, NO, NO2, O3and CO are measured routinely and are available with a time res-olution of 30 min. All meteorological parameters are mea-sured by the Federal Office of Meteorology and Climatol-ogy (MeteoSwiss). Due to the importance of monitoring long-term trends of gaseous and aerosol parameters in the free troposphere, the JFJ station has been incorporated into the Global Atmosphere Watch (GAW) program of the World Meteorological Organization (WMO) as a Global GAW Sta-tion.
2.2 Method for hydroperoxide sample collection and anal-ysis
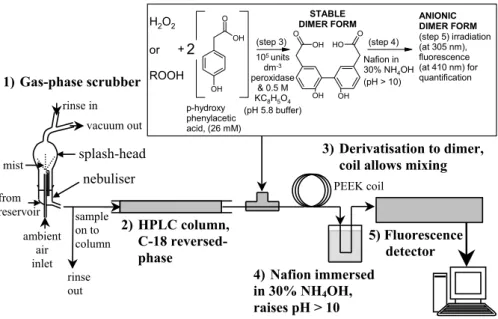
Sample collection took place at the Sphinx laboratory be-tween the 27 February and the 12 March 2003. Figure 3 shows a schematic diagram of the analytical system. Sam-ples were obtained from the gas-phase using an amber-glass nebulising reflux concentrator (Fig. 3) based on the design by Cofer et al. (1985). Atmospheric air was drawn by a vac-uum pump from the NABEL inlet (previously described in Zellweger et al., 2000), through ∼5 m 14′′ OD Teflon (per-fluoroalkoxy) tubing into the nebuliser, at a flow rate of 2.7 l min−1. The residence time in the inlet tubing was less than 4 sec. A sampling time of 25 min provided sufficient concentration of the solution for analysis. Collection effi-ciencies of 75±3% and 40±2% have been previously deter-mined experimentally for H2O2 and CH3OOH respectively and were assumed in this study (Jackson and Hewitt, 1996; Morgan, 2004).
Once collected, aqueous samples were injected through a 0.2 µm filter onto the HPLC where hydroperoxide spe-ciation was achieved using a C-18 reversed-phase column. Helium-degassed mobile phase was supplied at a flow rate of 0.6 ml min−1. Post-column, the hydroperoxide compo-nents were derivatised in a reaction coil in the presence of horseradish peroxidase to form a stable dimer, based on the technique developed by Lazrus et al. (1985, 1986). The derivatisation reagent was raised to pH 5.8 by the addition of potassium hydroxide (1 M) and buffered by potassium hydrogen phthalate (0.5 M). A peristaltic pump delivered the derivatisation reagent at constant rate of 0.25 ml min−1. The pH was then raised above 10 to produce the fluo-rescent anionic dimer form via a Nafion membrane sub-merged in 100 ml ammonium hydroxide (30%). Detection was achieved using a fluorescence spectrophotometer with excitation and emission wavelengths of 305 and 410 nm re-spectively, via a xenon short arc lamp. Calibration of the system was carried out daily. Further details of this method
Descending north-westerly (from 00:00) changing to ascending north-westerly (at
12:00)
Plot: 9 March
Level south-westerly (from 00:00) changing to
ascending south-westerly (at 12:00) Descending anti-cyclonic, south-westerly
Plot: 6 March Plot: 11 March
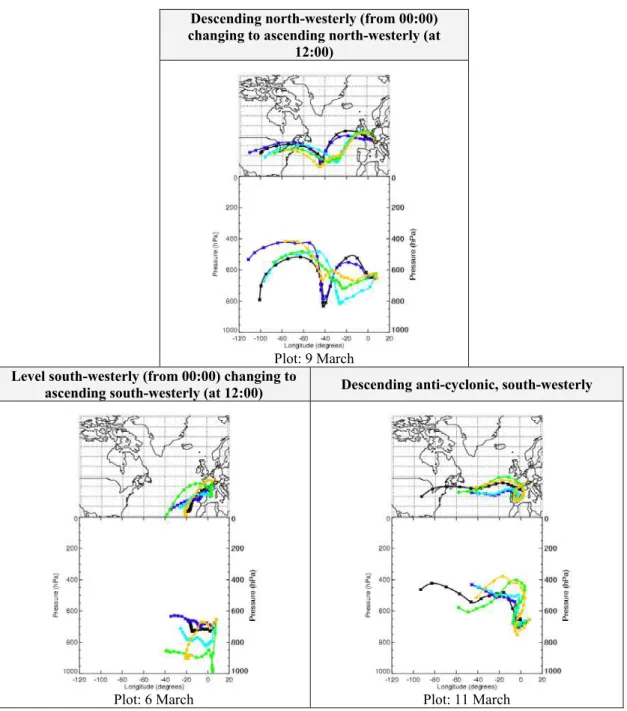
Fig. 2. Typical 5-day back-trajectories of air-masses sampled at JFJ (provided by the BADC Trajectory Server). Arrival dates of trajectories
are shown. Trajectory release times are 00:00 (black), 06:00 (dark blue), 12:00 (light blue), 18:00 (green) and 24:00 (orange) in GMT. Crosses are every 6 h along trajectory.
can be found in Morgan and Jackson (2002). Based on three and ten times the standard deviation of the base line noise, the instrument limit of detection and quantification at 95% confidence (Taylor, 1987) during the campaign was found to be 24 and 81 pptv respectively.
2.3 Other measurements
An overview of measurement techniques including detec-tion limits and uncertainties of O3, CO, NOx and reactive nitrogen species, NOy (NOx and all other species result-ing from the atmospheric oxidation of NOx) can be found in Zellweger et al. (2000) and for toluene and benzene in Reimann et al. (2004). A further suite of species, namely non-methane hydrocarbons (NMHCs), CO, O3, PAN
(perox-2) HPLC column, C-18 reversed-phase 4) Nafion immersed in 30% NH4OH, raises pH > 10 5) Fluorescence detector vacuum out rinse in sample on to column nebuliser splash-head mist 3) Derivatisation to dimer, coil allows mixing 1) Gas-phase scrubber from reservoir ambient air inlet rinse out PEEK coil OH O OH OH O OH O H O OH STABLE
DIMER FORM ANIONIC DIMER FORM
(step 5) irradiation (at 305 nm), fluorescence (at 410 nm) for quantification 105 units dm-3 peroxidase & 0.5 M KC8H5O4 (pH 5.8 buffer) H2O2 or ROOH + Nafion in 30% NH4OH (pH > 10) (step 3) p-hydroxy phenylacetic acid, (26 mM) 2 (step 4)
Fig. 3. Schematic diagram of gas-phase sampling and analysis of hydroperoxides using a nebulising reflux concentrator, HPLC and
post-column derivatisation.
yacetyl nitrate) and the photolysis rate coefficient, j (O1D), were measured throughout the campaign by the University of Leeds (School of Chemistry) and are described in Whalley et al. (2004).
3 Results and discussion
3.1 General observations
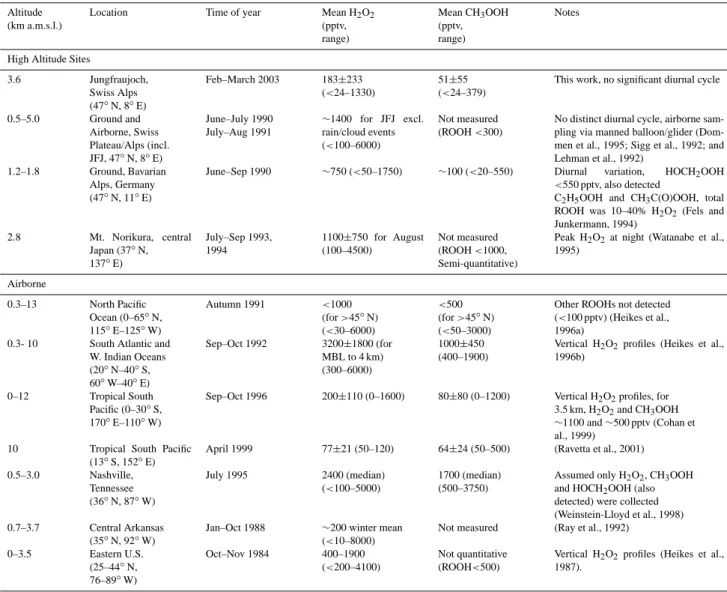
Figure 4 presents the 13-day time series for H2O2 and CH3OOH for the sampling period. H2O2 ranged from be-low the limit of detection (24 pptv) up to 1330 pptv with an average concentration of 183±233 pptv (± one standard deviation). Table 1 presents this data alongside previous measurements at other high altitude sites and from aircraft. The observations made during this campaign are consistent with previous measurements. More specifically they are within the range of previous H2O2 measurements at this site and other Alpine sites (<100–6000 pptv) (Dommen et al., 1995; Sigg et al., 1992; Lehman et al., 1992). How-ever, the observed mean for H2O2appears lower than those previously observed at alpine sites. This may be because the previous measurements were made during the summer, included forested areas (where hydroperoxides can be pro-duced through biogenic hydrocarbon oxidation), and also ex-cluded periods of cloud or rain (so concentrations were not reduced through wet deposition). Although direct compari-son between these datasets is difficult we conclude that our observational dataset appear consistent with previous obser-vations.
CH3OOH was observed during this campaign and ranged from below the detection limit, up to 379 pptv, with a mean
mixing ratio of 51±55 pptv. There are no previously pub-lished CH3OOH measurements for this site. Again these ob-servations are consistent with previous obob-servations at other sites (see Table 1). No other higher hydroperoxides were de-tected. This will be discussed in more detail in Sect. 3.7. 3.2 Effect of local and synoptic scale meteorology Mean diurnal cycles for H2O2 and CH3OOH are shown in Fig. 5. There is some suggestion of a maximum in hydroper-oxide concentrations during the day indicative of photochem-ical production (e.g. Dommen et al., 1995). However, there is significant variability, suggesting a large role for meteorol-ogy in determining the levels of hydroperoxides sampled.
Four hydroperoxide maxima were observed on the 1, 6, 9 and 11 March. The mean vector-averaged local wind direction (±1 standard deviation) throughout the campaign was north-westerly (312±68◦) with no consistent change in the local wind direction during the hydroperoxide maxima. Since the local wind direction is influenced by local orogra-phy due to the location of the sampling site in a mountain saddle, the local wind direction appears to offer little infor-mation on the magnitude of the hydroperoxide concentration. Back trajectories were calculated each 6 h of the campaign using ECMWF analysed winds at 2.5×2.5◦resolution and 31
levels using 3-D vertical advection via the BADC Trajectory Service (http://badc.nerc.ac.uk). These trajectories agreed well with plots calculated using the FLEXTRA Trajec-tory Service (http://zardoz.nilu.no/∼andreas/flextra+flexpart.
html), which offers a finer resolution (1.125×1.125◦) appro-priate for the Alpine region. The “synoptic wind direction” (diagnosed from the last day of transport described by the
tra-Table 1. Selected hydroperoxide measurements at high altitude.
Altitude (km a.m.s.l.)
Location Time of year Mean H2O2
(pptv, range) Mean CH3OOH (pptv, range) Notes
High Altitude Sites
3.6 Jungfraujoch, Swiss Alps (47◦N, 8◦E) Feb–March 2003 183±233 (<24–1330) 51±55 (<24–379)
This work, no significant diurnal cycle
0.5–5.0 Ground and Airborne, Swiss Plateau/Alps (incl. JFJ, 47◦N, 8◦E) June–July 1990 July–Aug 1991 ∼1400 for JFJ excl. rain/cloud events (<100–6000) Not measured (ROOH <300)
No distinct diurnal cycle, airborne sam-pling via manned balloon/glider (Dom-men et al., 1995; Sigg et al., 1992; and Lehman et al., 1992)
1.2–1.8 Ground, Bavarian
Alps, Germany (47◦N, 11◦E)
June–Sep 1990 ∼750 (<50–1750) ∼100 (<20–550) Diurnal variation, HOCH2OOH
<550 pptv, also detected
C2H5OOH and CH3C(O)OOH, total
ROOH was 10–40% H2O2(Fels and
Junkermann, 1994) 2.8 Mt. Norikura, central Japan (37◦N, 137◦E) July–Sep 1993, 1994 1100±750 for August (100–4500) Not measured (ROOH <1000, Semi-quantitative)
Peak H2O2at night (Watanabe et al.,
1995) Airborne 0.3–13 North Pacific Ocean (0–65◦N, 115◦E–125◦W) Autumn 1991 <1000 (for >45◦N) (<30–6000) <500 (for >45◦N) (<50–3000)
Other ROOHs not detected (<100 pptv) (Heikes et al., 1996a)
0.3- 10 South Atlantic and
W. Indian Oceans (20◦N–40◦S, 60◦W–40◦E) Sep–Oct 1992 3200±1800 (for MBL to 4 km) (300–6000) 1000±450 (400–1900)
Vertical H2O2profiles (Heikes et al.,
1996b)
0–12 Tropical South
Pacific (0–30◦S,
170◦E–110◦W)
Sep–Oct 1996 200±110 (0–1600) 80±80 (0–1200) Vertical H2O2profiles, for
3.5 km, H2O2and CH3OOH ∼1100 and ∼500 pptv (Cohan et al., 1999)
10 Tropical South Pacific
(13◦S, 152◦E)
April 1999 77±21 (50–120) 64±24 (50–500) (Ravetta et al., 2001)
0.5–3.0 Nashville, Tennessee (36◦N, 87◦W) July 1995 2400 (median) (<100–5000) 1700 (median) (500–3750)
Assumed only H2O2, CH3OOH
and HOCH2OOH (also
detected) were collected (Weinstein-Lloyd et al., 1998)
0.7–3.7 Central Arkansas
(35◦N, 92◦W)
Jan–Oct 1988 ∼200 winter mean
(<10–8000)
Not measured (Ray et al., 1992)
0–3.5 Eastern U.S. (25–44◦N, 76–89◦W) Oct–Nov 1984 400–1900 (<200–4100) Not quantitative (ROOH<500)
Vertical H2O2profiles (Heikes et al.,
1987).
jectory) was in general from the west/north-west for ∼55% of the campaign (consistent with the observed wind direc-tion) except in periods during the 28 February to 2 March, 5 to 6 and 10 to 12 March when air-masses with a south-westerly character were sampled (see Fig. 2 for examples of these trajectories). Three of the four hydroperoxide maxima occurred on the arrival of these synoptic south-westerly air-masses (1, 6 and 11 March). The maxima observed on the 9 March was during a period of north-westerly air (see Fig. 2), and is discussed separately in Sect. 3.4.
During south-westerly flow, primary photochemical pollu-tants e.g. CO and NOx, were sometimes enhanced, as illus-trated in Whalley et al. (2004) for this campaign and pre-viously seen in past campaigns at this site (Forrer et al., 2000; Carpenter et al., 2000). As described earlier, the re-lationship between hydroperoxides and primary pollutants (notably NOx) is complicated. Hydroperoxide
concentra-tions were sensitive to the NOx concentration within these air-masses. High hydroperoxide concentrations were only present when NOxconcentrations were low. The correlation coefficient between H2O2 or CH3OOH concentrations and
j (O1D) for 10:00 to 14:00 each day during the campaign gave a R2of <0.05 which indicates that the concentrations of hydroperoxide are not determined by their photochemical production. The south-westerly air-mass sampled during 11 March was also photochemically aged based on the distinc-tion of Chin et al. (1994), who used a NOx/NOyratio of <0.3 to evaluate when an air-mass could be described as photo-chemically aged. Air-masses with ratios significantly above this can therefore be classed as recently polluted. Secondly, the toluene/ benzene ratio was also used to support this clas-sification, where values below 0.5 were indicative of aged air-masses due to the shorter atmospheric lifetime of toluene compared to benzene (Li et al., 2006).
0 10 20 30 40 50 60 70 80 O 3 ( p p b v) 0 50 100 150 200 250 300 C O (p p b v ) o r re la ti v e h u mi d it y (% ) EMPA O3 (ppbv) EMPA CO (ppbv) EMPA RH (%) 0 1 2 3 4 5 N O 2 ( p p b v) 0.0 0.2 0.4 0.6 N O ( p p b v ) EMPA NO2 (ppbv) EMPA NO (ppbv) 0.0 0.5 1.0 1.5 H 2 O 2 o r C H 3 O O H ( p p b v ) H2O2 (ppbv) CH3OOH (ppbv) 0.0 0.5 1.0 1.5 N O x /N O y ( p p b v ) 0 1 2 3 4 5 N O y ( p p b v )
EMPA NOx /NOy EMPA NOy (ppbv) 0.0 0.5 1.0 1.5 2.0 2.5
27 Feb 01 Mar 03 Mar 05 Mar 07 Mar 09 Mar 11 Mar
to lu e n e / b e n ze n e 0.000 0.005 0.010 0.015 0.020 0.025 0.030 N O y /C O
EMPA toluene/ benzene EMPA NOy/CO
Fig. 4. Time series of H2O2, CH3OOH, O3, CO, relative humidity
(RH), NO2, NO, NOy, NOxto NOy, toluene to benzene and NOy
to CO ratios. Arrows in top panel and dashed vertical lines indi-cate changes in the prevailing wind direction deduced from the last day of 5-day back-trajectories (see Sect. 3.2 for further details). De-scending air from >3.6 km (blue arrows), aDe-scending air from <2 km (red arrows) and level (green arrows) indicates air that had remained at constant altitude for the last 5 days. Local NO and toluene con-tamination has been removed. Tick marks on time axis refer to noon (GMT).
Using these classifications, the high NOx levels during 6 March, which in combination with wet and dry deposi-tion in the humid ascending air-mass was likely to have caused hydroperoxide concentrations to reduce (from their initial high values described in Sect. 3.4), can therefore be classed as fresh emissions (NOx/NOy∼0.8) within a south-westerly, ascended air-mass (from 750–850 hPa, ∼2 km). The toluene to benzene ratio increased from a background level (the campaign median of ∼0.5) to values above 1.5, which was also indicative of fresh emissions at this site (Li et al., 2006a). The sources of these polluted south-westerly air-masses could be the industrialised region of the Valais Val-ley (southern Switzerland) or the Po ValVal-ley (northern Italy),
0.0 0.1 0.2 0.3 0.4 0.5 0.6 0.7 0.8 0.9 0 0 :0 0 0 6 :0 0 1 2 :0 0 1 8 :0 0 0 0 :0 0 h o u rl y me a n h yd ro p e ro xi d e ( p p b v) H2O2 CH3OOH
Fig. 5. Hourly averaged diurnal cycles for H2O2 (black crosses/line) and CH3OOH (grey crosses/line) where error bars
show 1 standard deviation.
consistent with Seibert et al. (1998) and Forrer et al. (2000). The latter found that the highest CO (double the average value) and NOx (>1 to <10 ppbv) concentrations were as-sociated with winds that transported anthropogenic pollution to this site from these industrialized regions of Switzerland and Italy. Similar conditions to those described by Forrer et al. (2000) occurred on 6 March when high concentrations of CO (>190 ppbv) and NOx(∼4 ppbv) were observed, due to upslope motion possibly associated with dynamical uplift from a frontal passage. Their paper described upslope mo-tion associated with this south-westerly flow, as a process of transporting polluted air from lower altitudes to the site. The importance of these processes at this site was highlighted by Carpenter et al. (2000), who observed diurnal CO and H2O cycles indicative of daily upslope motion, and was developed further by Zellweger et al. (2003).
Thus much of the variability seen in the hydroperoxide concentrations observed can be attributed to changes in flow regime leading to changes in the levels of photo-pollutants rather than local changes in photolysis rates.
3.3 Sampling of boundary layer and free tropospheric air Mountain sites such as JFJ are often thought to offer sam-pling within the free troposphere. In the previous section we have shown that there are examples of boundary layer air be-ing sampled. Quantifybe-ing the fraction of boundary layer air sampled is important for placing the observations made at this site into a context, and is described e.g. in Zellweger et al. (2003).
The mean CO observed during the campaign was 140±14 ppbv consistent with the seasonal cycle of CO pre-viously measured at JFJ (Rinsland et al., 2000; Forrer et al., 2000; BUWAL, 2005). Carpenter et al. (2000) used the crite-ria of CO <200 ppbv, NOx/NOy<0.3, and a coarse screening of cloudy days, by excluding periods when global radiation
was below the campaign median, to diagnose being within the free troposphere. Data collected as part of this campaign fulfilled these criteria for only 4% data coverage, which was lower than previous research of Carpenter et al. (2000) at this site, where free tropospheric air amounted to 17% us-ing the same criteria durus-ing FREETEX 1998. The periods that satisfied the “free tropospheric” criteria of Carpenter et al. (2000) occurred for a short time on the 4, 6, 7, 9 and 10 March and for longer periods towards the end of the cam-paign (11 to 12 March). Some of these examples occurred during elevated hydroperoxide levels (i.e. 9, 10 and 11 to 12 March), which could be due to the reduction in deposition as a hydroperoxide sink. However, other factors must be af-fecting hydroperoxide concentrations in the air classified as “free tropospheric” during the 11 to 12 March, as there are short periods when the concentrations reduce to <LoD.
Previous aircraft measurements of free tropospheric H2O2 have found a significant correlation between H2O2and the product of its precursors, O3and H2O (Penkett et al., 1995, 1998; Weinstein-Lloyd et al., 1998). The lack of a significant correlation (R2<0.1) found from this dataset again implies that the simple free tropospheric assumptions made in these papers are not appropriate at this site (i.e. all three papers used altitudes >1500 m and Weinstein-Lloyd et al. (1998) also used a coarse particle count of <10 cm−3to remove pe-riods of cloud). If the criteria of Carpenter et al. (2000) is used to determine only those periods where air was sampled within the free troposphere, a weak positive correlation was then observed (R2∼0.3).
Alongside the chemical criteria of Carpenter et al. (2000), relative humidity above 90% was also used to screen out cloudy days, rather than global radiation, which resulted in 18% of the data satisfying the “free tropospheric” definition. However, on examination of each 6-hourly trajectory release, only 28% entered the boundary layer (assumed to be <1 km,
∼900 hPa) during the previous 5 days. This implies that a much higher percentage of sampled air may have been of free tropospheric origin than was calculated based on the chemi-cal tracers discussed above.
Various other subjective criteria, such as the NOy/CO ra-tio, have also been utilised to define free tropospheric air. A NOy/CO ratio of ∼0.005 was used to indicate the upper tro-posphere (Jaegle et al., 1998), which is thought to account for both deposition and dilution effects (Zellweger et al., 2003). It was found that a large proportion of the data (85%) was below this value, which implies that this criterion gives a similar result to that achieved by examining trajectories, in contrast to using the other chemical criteria discussed above. During previous campaigns at Jungfraujoch, the NOy/CO ra-tio has been used to show that “free tropospheric” periods only made up 40% during March to August 1997 and 1998 (Zellweger et al., 2003) and 57% during 1993 to 1997 (Li et al., 20061) of the measurement period.
1Li, Y., Staehelin, J., Auvray, M., Bey, I., and Schultz, M.:
There is therefore much uncertainty in establishing filter-ing criteria for free tropospheric air, as the chemistry and dy-namics often disagree. This means that identifying the air-mass origin through tracer concentrations and trajectories is difficult due to the lack of a definitive classification.
3.4 Impact of high and low NOxon hydroperoxides As discussed in Sect. 3.2, there was some evidence that en-hanced hydroperoxide concentrations were associated with south-westerly air, when NOxlevels and depositional sinks were reduced. The three examples of south-westerly flow experienced during the campaign are described in Table 2, together with a fourth example of enhanced hydroperoxides in a north-westerly air-mass.
In the early morning of 6 March (Example A, Table 2), high levels of hydroperoxides (∼0.9 and ∼0.3 ppbv H2O2 and CH3OOH respectively) occurred in drier, south-westerly air that had remained at relatively constant altitude (600– 700 hPa), with relatively low CO (∼110 ppbv) and NOx lev-els (∼0.3 ppbv), compared to the rest of the campaign. How-ever, a spike in NOxof over 1 ppbv, at 07:00 caused a brief, partial reduction in hydroperoxides, due to suppression of HO2 by elevated NOx. This air-mass displayed a moderate NOxto NOyratio (∼0.6), together with a relatively large in-crease in longer-lived alkanes compared to small inin-creases in short-lived alkenes (see Whalley et al., 2004). These ob-servations suggest slight photochemical aging and could be caused by some vertical mixing into the air-mass, by aged air from ∼650 hPa (∼5 km), 5 days earlier (see black and dark blue line, bottom left panel, in Fig. 2). The high lev-els of hydroperoxides in this event were therefore thought to be due to a combination of photochemically aged air with an abundance of HOx, low NOx, and little surface deposition, but ultimately it is difficult to decide upon what caused these hydroperoxide maxima.
In the afternoon of the 6 March (Example B, Table 2), freshly emitted NOx in a moist air-mass (relatively humid-ity >80%) arrived from the south-west and caused the sup-pression of hydroperoxides for over 10 h. This increase in NOx was due to a shift to ascended air (from 750–850 hPa, see light blue and green lines, Fig. 2) that also exhibited en-hanced CO (>150 ppbv). NO concentrations detected dur-ing this period were five times the level that Lee et al. (2000) (>100 pptv) showed, which resulted in substantial suppres-sion of hydroperoxide production alongside increased hy-droperoxide deposition. Hyhy-droperoxides were therefore re-duced by a combination of high NO (average of 64 pptv) that competed with peroxy radical self-reactions, high NO2 (aver-age of 2450 pptv) for several hours, providing a sink for OH (e.g. Poppe et al., 1993), wet deposition (see Sect. 3.5) and
Comparison between numerical simulations of two 3-D global models (GEOS-CHEM and MOZART) with ozone observations at Jungfraujoch (Switzerland) and ozone sondes from Payerne, At-mos. Environ., submitted, 2006.
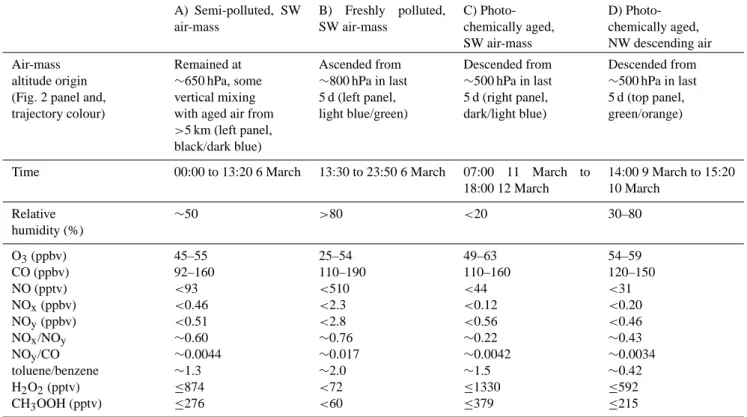
Table 2. Composition of air-masses with varying NOxto NOyratios leading to hydroperoxide production and suppression. A) Semi-polluted, SW air-mass B) Freshly polluted, SW air-mass C) Photo-chemically aged, SW air-mass D) Photo-chemically aged, NW descending air Air-mass altitude origin (Fig. 2 panel and, trajectory colour)
Remained at
∼650 hPa, some vertical mixing with aged air from
>5 km (left panel, black/dark blue) Ascended from ∼800 hPa in last 5 d (left panel, light blue/green) Descended from ∼500 hPa in last 5 d (right panel, dark/light blue) Descended from ∼500 hPa in last 5 d (top panel, green/orange)
Time 00:00 to 13:20 6 March 13:30 to 23:50 6 March 07:00 11 March to
18:00 12 March 14:00 9 March to 15:20 10 March Relative humidity (%) ∼50 >80 <20 30–80 O3(ppbv) 45–55 25–54 49–63 54–59 CO (ppbv) 92–160 110–190 110–160 120–150 NO (pptv) <93 <510 <44 <31 NOx(ppbv) <0.46 <2.3 <0.12 <0.20 NOy(ppbv) <0.51 <2.8 <0.56 <0.46 NOx/NOy ∼0.60 ∼0.76 ∼0.22 ∼0.43 NOy/CO ∼0.0044 ∼0.017 ∼0.0042 ∼0.0034 toluene/benzene ∼1.3 ∼2.0 ∼1.5 ∼0.42 H2O2(pptv) ≤874 <72 ≤1330 ≤592 CH3OOH (pptv) ≤276 <60 ≤379 ≤215
contact with the surface, allowing increased dry deposition of H2O2.
During 11 to 12 March (Example C, Table 2), back-trajectories showed a south-westerly air-mass that had de-scended from 400–600 hPa over 5 days, with little influence of air from lower altitudes (see blue lines in bottom right panel, Fig. 2). This very dry air (RH<20%) had a low NOx/NOy ratio (<0.3) and so can be considered as photo-chemically aged (Chin et al., 1994). To support this classi-fication, 11 to 12 March also showed toluene/benzene ratios below 0.5 (Li et al., 2005). Although CO remained around 140 ppbv, the relatively long lifetime of CO (∼60 days) (Volz et al., 1981) compared to other photochemical tracers, means this air-mass could still have been of free tropospheric ori-gin. This air-mass could therefore become rich in hydroper-oxides because, little dry deposition could occur and there was a lack of NOxwhich prevented the competing reactions to H2O2and CH3OOH production. The high concentrations of hydroperoxides imply that HOxwas readily available.
During 9 to 10 March (Example D, Table 2), a descend-ing north-westerly also gave observed hydroperoxide max-ima alongside a NOxto NOy ratio of ∼0.4. This aged air-mass had descended from ∼500 hPa for the previous 5 days (see green and orange lines, top panel, Fig. 2). Again a lack of NOxand dry deposition allowed hydroperoxides to accu-mulate, but these peaks are lower in concentration than for
other examples (1, 6 and 11 to 12 March) that arrived in south-westerly air, which lends support to the findings that more HOxwas available in south-westerly air-masses, which have been subjected to more intense sunlight, water vapour concentrations and so have enhanced radical concentrations. Overall we find that oxides of nitrogen have a significant impact on the concentrations of hydroperoxides. Air coming from the south-west with moderate levels of NOx displays higher hydroperoxide concentration than air which is more significantly polluted, or air coming from the north. This is due to a combination of a history of higher photolysis rates and water vapour concentration, leading to enhanced HOx production in south-westerly air, with also reduced HOxloss and lower OH to HO2ratios due to the moderate NOx con-centrations.
3.5 Wet deposition and cloud processing
Unlike the case on the 6 March, the decrease in hydroperox-ide concentration observed on the 1 March was not due to a combination of deposition and an increase in NOx. The trajectories showed a change to an ascending air-mass, asso-ciated with an increase in relative humidity (>90%) and in-creased deposition, but no increases in NOxwere observed. Dilution effects with an air-mass that had been exposed to increased dry deposition to the surface could therefore have
been partly responsible for the observed reduction in hy-droperoxides. The high humidity indicates that cloud pro-cessing had also occurred. Previous studies have shown that air-masses exposed to cloud processing exhibit lower con-centrations of H2O2 due to wet deposition (e.g. Heikes et al., 1987; Chandler et al., 1988; Gallagher et al., 1991). It appears that H2O2concentrations during this event reduced faster than CH3OOH due to its much higher solubility (the ratio of Henry’s Law coefficients (HH2O2/HCH3OOH∼260) but because of the data gap during this hydroperoxide reduc-tion, the role of uptake into water droplets and dilution by changing air-masses is unclear.
3.6 Agreement with a previous photochemical box model Zanis et al. (1999) described constrained box modelling work of the radicals at the JFJ site during April to May 1996. How-ever, at the time of their study, observations of hydroperox-ides were not available to help constrain their modelling ef-fort. Their work simulated H2O2concentrations in the order of a magnitude, from 1700 to 170 pptv without and including dry deposition respectively. The mean observed H2O2 con-centrations of 183±233 pptv during this campaign are thus much more consistent with the calculations that include a surface depositional sink. However, there was some indica-tion of air-masses that were representative of less disturbed free tropospheric air (e.g. case C, Table 2), where the H2O2 concentration (≤1330 pptv) was closer to the upper estimate of the box model, detailed in Zanis et al. (1999). Meteo-rological conditions during the 1996 campaign were com-parable to our campaign in 2003, with similar temperature, pressure and wind speeds, and consistent concentrations of O3and water vapour. The main differences between the two campaigns were the lower CO, j (O1D) and NO measured in 2003 compared to 1996. The variations in the concentra-tions of photochemical pre-cursors to H2O2between the two campaigns alone, is not sufficient to account for an order of a magnitude difference between the previously modelled con-centration of H2O2without a depositional sink and our mean observations of H2O2. We conclude that depositional pro-cesses are important at this site for determining hydroperox-ide concentration during periods influenced by the boundary layer.
Mean NO levels during this 2003 campaign were low (∼19 pptv), which places the site during the observation pe-riod slightly below the NO regime (20 to 100 pptv) set by Zanis et al. (1999) for simultaneous O3and H2O2 produc-tion. H2O2can be produced alongside O3in this regime be-cause there is sufficient NO to lead to O3production, but per-oxy radical combination reactions are still able to dominate over the loss of OH through NO2. During the campaign, the data selected using the criteria of Carpenter et al. (2000) for free tropospheric air, also did not display a significant anti-correlation between O3and H2O2(R2=0.2). This is consis-tent with simultaneous production of both O3and H2O2but
is in contrast to the previously observed anti-correlation be-tween O3and H2O2 for the remote marine boundary layer (e.g. Ayers et al., 1992). Again this observational evidence lends further support to the case that the JFJ station mainly sampled boundary layer air during this campaign. However, the lack of anti-correlation between O3and H2O2could also be attributed to other factors such as the difference in life-time between the two species, or the possibility that NOx could be mixed out of the boundary layer (e.g. via convec-tion or frontal systems) so that when free tropospheric air is sampled at JFJ, it may contain sufficient NO in it for O3 production to occur.
The box modelling described by Zanis et al. (1999) is con-sistent with the hydroperoxide observations made during this study. During periods where there was indication of bound-ary layer influence, agreement required a depositional sink. Thus even at this high altitude mountain site, the impact of the boundary layer cannot be ignored and as a consequence, filtering and data flagging of air disturbed by the surface is essential.
3.7 Other hydroperoxides
The oxidation of hydrocarbons within the atmosphere should lead to the production of a large number of hy-droperoxides. Previous observations have detected hydrox-ymethyl hydroperoxide (HOCH2OOH), peroxyacetic acid (CH3C(O)OOH), and ethylhydroperoxide (C2H5OOH) at this altitude (Fels and Junkermann, 1994; Weinstein-Lloyd et al., 1998; Crounse et al., 2005, private communica-tion). However, they were not observed during this study. This is surprising given that two of these species have higher solubility than H2O2 and CH3OOH respectively (HHOCH2OOH=1.7×10
6M atm−1, Sander et al., 2003, and HCH3C(O)OOH=473 M atm
−1, Seinfeld and Pandis, 1998), which should permit more efficient collection via this tech-nique (giving ∼94 and ∼43% respectively based on the sam-pler collection efficiency and the Henry’s Law Constant for these compounds). Using these collection efficiencies and the limit of detection for the instrumental set-up, an up-per limit of ∼22 and ∼48 pptv can therefore be stated for HOCH2OOH and CH3C(O)OOH respectively. The collec-tion efficiency is expected to be low (<40%) for hydroperox-ides less soluble than CH3OOH, such as C2H5OOH, mean-ing that concentrations must be above 50 pptv to be sampled successfully.
Fels and Junkermann (1994) observed levels of HOCH2OOH up to 550 pptv at a mountainous alpine site (1780 m a.m.s.l.), and reported that CH3OOH and HOCH2OOH were the dominant ROOH, with C2H5OOH and CH3C(O)OOH contributing <10%. However, their re-search was conducted during summer, and at lower altitude, where sources of ROOH are more abundant. In comparison, the JFJ measurements were made during early spring when concentrations would be expected to be lower. A more recent
study by Valverde-Canossa et al. (2005) inferred ROOH concentrations from aqueous-phase cloud water samples at a mountainous site in Germany (937 m a.m.s.l.) with CH3OOH, HOCH2OOH and 1-hydroxyethyl hydroperoxide (CH3CH(OH)OOH) concentrations of <40, <0.020 and
<3.5 pptv respectively. These levels of ROOH were below the detection limit of the analytical instrument used at JFJ.
Significant levels of CH3C(O)OOH (100–300 pptv) were observed in the recent INTEX-NA aircraft campaign at the same altitude as JFJ over the Atlantic coast of USA (Crounse et al., 2005, private communication). Observations of H2O2 during the INTEX-NA campaign were a factor of as much as 10 higher than were observed during this JFJ campaign. Thus if the CH3C(O)OOH concentrations scales with H2O2concentrations, we would expect concentrations of CH3C(O)OOH of around 10 to 30 pptv, which is below the detection limit and thus would not be detected with this instrument. It seems likely that other hydroperoxides are present in the atmosphere at JFJ. However, their expected concentrations are likely to be below those that can be ob-served by the current instrumental set-up.
4 Conclusions
Gas-phase hydroperoxide measurements were made at Jungfraujoch High Altitude Research Station as part of the FREETEX campaign during February and March 2003. These are the first speciated hydroperoxide measurements for this site, providing a quantitative assessment of both in-organic and in-organic hydroperoxide concentrations. H2O2 and CH3OOH were detected but no other hydroperoxides were detected, consistent with our understanding of their concentrations within the atmosphere. Although a diurnal cycle in both H2O2and CH3OOH was observed, it was not strong because of meteorologically-driven variability. There was some indication that air-masses from the south-west dis-played higher hydroperoxide concentrations, possibly caused by enhanced photochemistry, but ultimately, it was difficult to decide upon what caused hydroperoxide maxima during the campaign. Air-masses which had been exposed to high levels of recent pollution showed lower concentrations of hy-droperoxides, indicative of the suppression of HO2by NOx. The concentrations of hydroperoxide measured during the campaign were consistent with previous box-modelling work for the site. This only included periods when the site was fluenced by the boundary layer if a depositional sink was in-cluded in the box model. Thus comparisons between these observations and the results of chemical transport models should be carried out carefully during periods where there was indication that boundary layer air was sampled.
Acknowledgements. The authors would like to thank the Interna-tional Foundation Jungfraujoch and Gornergrat and the custodians at the Jungfraujoch Research Station for their assistance and hospi-tality. Parts of the measurements were made by the Swiss National
Air Pollution Monitoring Network (NABEL) on behalf of the Swiss Federal Office for the Environment (FOEN). The financial support of the NABEL network by FOEN is acknowledged. S. J. Walker would like to thank R. Purvis (now at FAAM, UK), J. Lee (now at University of York, UK) and L. Whalley (University of Leeds, UK) for their generosity and support throughout the campaign. The au-thors would also like to acknowledge R. Morgan (for his assistance in preparing for the campaign) and S. Arnold (for assistance in the preparation of back-trajectory plots). S. J. Walker acknowledges a NERC studentship (NER/S/S/2002/11165) and A. V. Jackson acknowledges the NERC/AFI grant (RG.ENVI.444968).
Edited by: P. Monks
References
Ayers, G. P., Penkett, S. A., Gillett, R. W., Bandy, B., Galbally, I. E., Meyer, C. P., Elsworth, C. M., Bentley, S. T., and Forgan, B. W.: Evidence for Photochemical Control of Ozone Concentrations in Unpolluted Marine Air, Nature, 360, 446–449, 1992.
Baltensperger, U., Gaggeler, H. W., Jost, D. T., Lugauer, M., Schwikowski, M., Weingartner, E., and Seibert, P.: Aerosol cli-matology at the high-alpine site Jungfraujoch, Switzerland, J. Geophys. Res.-Atmos., 102, 19 707–19 715, 1997.
BUWAL (Bundesamt f¨ur Umwelt, Wald und Landschaft – Swiss Federal Office for Environment, Forest and Landscape): Swiss National Air Pollution Monitoring Network (NABEL), An-nual Report 2004, Series of Publications on the Environment (Schriftenreihe Umwelt), 388, 91–96, 2005.
Carpenter, L. J., Green, T. J., Mills, G. P., Bauguitte, S., Penkett, S. A., Zanis, P., Schuepbach, E., Schmidbauer, N., Monks, P. S., and Zellweger, C.: Oxidized nitrogen and ozone production efficiencies in the springtime free troposphere over the Alps, J. Geophys. Res.-Atmos., 105, 14 547–14 559, 2000.
Chandler, A. S., Choularton, T. W., Dollard, G. J., Eggleton, A. E. J., Gay, M. J., Hill, T. A., Jones, B. M. R., Tyler, B. J., Bandy, B. J., and Penkett, S. A.: Measurements of H2O2and SO2in clouds
and estimates of their reaction rate, Nature, 336, 562–565, 1988. Chin, M., Jacob, D. J., Munger, J. W., Parrish, D. D., and Dod-dridge, B. G.: Relationship of ozone and carbon monoxide over North America, J. Geophys. Res.-Atmos., 99, 14 565–14 573, 1994.
Cofer, W. R., Collins, V. G., and Talbot, R. W.: Improved Aqueous Scrubber for Collection of Soluble Atmospheric Trace Gases, Environ. Sci. Technol., 19, 557–560, 1985.
Cohan, D. S., Schultz, M. G., Jacob, D. J., Heikes, B. G., and Blake, D. R.: Convective injection and photochemical decay of perox-ides in the tropical upper troposphere: Methyl iodide as a tracer of marine convection, J. Geophys. Res.-Atmos., 104, 5717–5724, 1999.
Crutzen, P. J. and Zimmermann, P. H.: The Changing Photochem-istry of the Troposphere, Tellus, Series A-Dynamic Meteorology and Oceanography, 43, 136–151, 1991.
Dommen, J., Neftel, A., Sigg, A., and Jacob, D. J.: Ozone and Hydrogen-Peroxide During Summer Smog Episodes over the Swiss Plateau – Measurements and Model Simulations, J. Geo-phys. Res.-Atmos., 100, 8953–8966, 1995.
ECMWF: The description of the ECMWF/WRCP Level III-A global atmospheric data archive, Reading, 1995.
Fels, M. and Junkermann, W.: The Occurrence of Organic Perox-ides in Air at a Mountain Site, Geophys. Res. Lett., 21, 341–344, 1994.
Finlayson-Pitts, B. J. and Pitts-Jr, J. N.: Atmospheric Chemistry: Fundamentals and Experimental Techniques, Wiley Interscience, John Wiley and Sons, New York, 1986.
Forrer, J., Ruttimann, R., Schneiter, D., Fischer, A., Buchmann, B., and Hofer, P.: Variability of trace gases at the high-Alpine site Jungfraujoch caused by meteorological transport processes, J. Geophys. Res.-Atmos., 105, 12 241–12 251, 2000.
Gallagher, M. W., Choularton, T. W., Downer, R., Tyler, B. J., Stromberg, I. M., Mill, C. S., Penkett, S. A., Bandy, B., Dol-lard, G. J., Davies, T. J., and Jones, B. M. R.: Measurement of the entrainment of hydrogen peroxide into cloud systems, Atmos. Environ., Part A – General Topics, 25(9), 2029–2038, 1991. Heikes, B. G., Kok, G. L., Walega, J. G., and Lazrus, A. L.: H2O2,
O3and SO2Measurements in the Lower Troposphere over the
Eastern United States During Fall, J. Geophy. Res.-Atmos., 92, 915–931, 1987.
Heikes, B. G., Lee, M., Bradshaw, J., Sandholm, S., Davis, D. D., Crawford, J., Rodriguez, J., Liu, S., McKeen, S., Thornton, D., Bandy, A., Gregory, G., Talbot, R., and Blake, D.: Hydrogen peroxide and methylhydroperoxide distributions related to ozone and odd hydrogen over the North Pacific in the fall of 1991, J. Geophys. Res.-Atmos., 101, 1891–1905, 1996a.
Heikes, B. G., Lee, M. H., Jacob, D. J., Talbot, R., Bradshaw, J., Singh, H., Blake, D., Anderson, B., Fuelberg, H., and Thomp-son, A. M.: Ozone, hydroperoxides, oxides of nitrogen, and hy-drocarbon budgets in the marine boundary layer over the South Atlantic, J. Geophys. Res.-Atmos., 101, 24 221–24 234, 1996b. Jackson, A. V. and Hewitt, C. N.: Hydrogen peroxide and organic
hydroperoxide concentrations in air in a eucalyptus forest in cen-tral Portugal, Atmos. Environ., 30, 819–830, 1996.
Jaegle, L., Jacob, D. J., Wang, Y., Weinheimer, A. J., Ridley, B. A., Campos, T. L., Sachse, G. W., and Hagen, D. E.: Sources and chemistry of NOxin the upper troposphere over the United
States, Geophys. Res. Lett., 25, 1705–1708, 1998.
Kleinman, L. I.: Photochemical formation of peroxides in the boundary layer, J. Geophys. Res.-Atmos., 91, 889–904, 1986. Lazrus, A. L., Kok, G. L., Gitlin, S. N., Lind, J. A., and McLaren,
S. E.: Automated Fluorometric Method for Hydrogen-Peroxide in Atmospheric Precipitation, Anal. Chem., 57, 917–922, 1985. Lazrus, A. L., Kok, G. L., Lind, J. A., Gitlin, S. N., Heikes, B.
G., and Shetter, R. E.: Automated Fluorometric Method for Hydrogen-Peroxide in Air, Anal. Chem., 58, 594–597, 1986. Lee, M. H., Heikes, B. G., and O’Sullivan, D. W.: Hydrogen
per-oxide and organic hydroperper-oxide in the troposphere: A review, Atmos. Environ., 34, 3475–3494, 2000.
Lehmann, M., Sigg, A., Lehmann, B. E., and Neftel, A.: H2O2
concentration during summer smog situations at the high Alpine research station Jungfraujoch, Air Poll. Res. Rept., 39. Brussels, Comm. European Commun., 1992.
Li, Y. S., Campana, M., Reimann, S., Schaub, D., Stemmler, K., Staehelin, J., and Peter, T.: Hydrocarbon concentrations at the Alpine mountain sites Jungfraujoch and Arosa, Atmos. Environ., 39, 1113–1127, 2005.
Lightfoot, P. D., Cox, R. A., Crowley, J. N., Destriau, M., Hayman, G. D., Jenkin, M. E., Moortgat, G. K., and Zabel, F.: Organic Per-oxy Radicals – Kinetics, Spectroscopy and Tropospheric
Chem-istry, Atmos. Environ., Part A – General Topics, 26, 1805–1961, 1992.
Lugauer, M., Baltensperger, U., Furger, M., Gaggeler, H. W., Jost, D. T., Schwikowski, M., and Wanner, H.: Aerosol transport to the high Alpine sites Jungfraujoch (3454 m a.s.l.) and Colle Gnifetti (4452 m asl), Tellus, Ser. B-Chem. Phys. Meteorol., 50, 76–92, 1998.
Morgan, R. B.: Field Studies of Atmospheric Peroxides and the Development of Sampling Methods, School of the Environment, University of Leeds, pp. 191, 2004.
Morgan, R. B. and Jackson, A. V.: Measurements of gas-phase hy-drogen peroxide and methyl hydroperoxide in the coastal en-vironment during the PARFORCE project, J. Geophys. Res.-Atmos., 107, 8109, doi:10.1029/2000JD000257 2002.
Penkett, S. A., Bandy, B. J., Reeves, C. E., McKenna, D., and Hignett, P.: Measurements of peroxides in the atmosphere and their relevance to the understanding of global tropospheric chem-istry, Faraday Discuss., 155–174, 1995.
Penkett, S. A., Jones, B. M. R., Brice, K. A., and Eggleton, A. E. J.: Importance of atmospheric ozone and hydrogen peroxide in oxi-dizing sulphur dioxide in cloud and rainwater, Atmos. Environ., 13, 123–137, 1979.
Penkett, S. A., Reeves, C. E., Bandy, B. J., Kent, J. M., and Richer, H. R.: Comparison of calculated and measured peroxide data col-lected in marine air to investigate prominent features of the an-nual cycle of ozone in the troposphere, J. Geophys. Res.-Atmos., 103, 13 377–13 388, 1998.
Poppe, D., Wallasch, M., and Zimmermann, J.: The dependence of the concentration of OH on its precursors under moderately polluted conditions – a model study, J. Atmos. Chem., 16, 61– 78, 1993.
Ravetta, F., Jacob, D. J., Brune, W. H., Heikes, B. G., Anderson, B. E., Blake, D. R., Gregory, G. L., Sachse, G. W., Sandholm, S. T., Shetter, R. E., Singh, H. B., and Talbot, R. W.: Experimental evidence for the importance of convected methylhydroperoxide as a source of hydrogen oxide (HOx)radicals in the tropical
up-per troposphere, J. Geophys. Res.-Atmos., 106, 32 709–32 716, 2001.
Ray, J. D., van Valin, C. C., and Boatman, J. F.: The Vertical Distri-bution of Atmospheric H2O2– a Case Study, J. Geophys.
Res.-Atmos., 97, 2507–2517, 1992.
Reeves, C. E. and Penkett, S. A.: Measurements of peroxides and what they tell us, Chem. Rev., 103, 5199–5218, 2003.
Reimann, S., Schaub, D., Stemmler, K., Folini, D., Hill, M., Hofer, P., Buchmann, B., Simmonds, P. G., Greally, B. R., and O’Doherty, S.: Halogenated greenhouse gases at the Swiss high Alpine site of Jungfraujoch (3580 m a.s.l.): con-tinuous measurements and their use for regional European source allocation, J. Geophys. Res.-Atmos., 109, D05307, doi:10.1029/2003JD003923, 2004.
Rinsland, C. P., Mahieu, E., Zander, R., Demoulin, P., Forrer, J., and Buchmann, B.: Free tropospheric CO, C2H6, and HCN above
central Europe: recent measurements from the Jungfraujoch sta-tion including the detecsta-tion of elevated columns during 1998, J. Geophys. Res.-Atmos., 105, 24 235–24 249, 2000.
Sander, S. P., Friedl, R. R., Ravishankara, A. R., Golden, D. M., Kolb, C. E., Kurylo, M. J., Huie, R. E., Orkin, V. L., Molina, M. J., Moortgat, G. K., and Finlayson-Pitts, B. J.: Chemical Kinetics and Photochemical Data for Use in Atmospheric Studies, JPL
Publication 02–25, Evaluation No. 14, 5–35, 2003.
Seibert, P., Kromp-Kolb, H., Kasper, A., Kalina, M., Puxbaum, H., Jost, D. T., Schwikowski, M., and Baltensperger, U.: Transport of polluted boundary layer air from the Po Valley to high-alpine sites, Atmos. Environ., 32, 3953–3965, 1998.
Seinfeld, J. H. and Pandis, S. N.: Atmospheric Chemistry and Physics: from Air Pollution to Climate Change, John Wiley & Sons Inc., 1998.
Sigg, A., Lehmann, B. E., Lehmann, M., and Neftel, A.: H2O2
measurements in the boundary layer over Switzerland during summer smog episodes, Air Poll. Res. Rept., 39. Brussels, Comm. European Commun., 1992.
Taylor, J. K.: Quality Assurance of Chemical Measurements, Chelsea, MI, Lewis, 1987.
Tremmel, H. G., Junkermann, W., and Slemr, F.: On the distribution of hydrogen peroxide in the lower troposphere over the north-eastern United States during late summer 1988, J. Geophys. Res.-Atmos., 98, 1083–1099, 1993.
Valverde-Canossa, J., Wieprecht, W., Acker, K., and Moortgat, G. K.: H2O2and organic peroxide measurements in an orographic
cloud: The FEBUKO experiment, Atmos. Environ., 39, 4279– 4290, 2005.
Volz, A., Ehhalt, D. H., and Derwent, R. G.: Seasonal and Latitu-dinal Variation of (CO)-C-14 and Tropospheric Concentration of OH Radicals, J. Geophys. Res.-Oceans Atmos., 86, 5163–5171, 1981.
Watanabe, K., Ishizaka, Y., and Tanaka, H.: Measurements of atmo-spheric peroxides concentrations near the summit of Mt Norikura in Japan, J. Meteorol. Soc. of Japan, 73, 1153–1160, 1995. Weinstein-Lloyd, J. B., Lee, J. H., Daum, P. H., Kleinman, L. I.,
Nunnermacker, L. J., and Springston, S. R.: Measurements of peroxides and related species during the 1995 summer intensive of the Southern Oxidants Study in Nashville, Tennessee, J. Geo-phys. Res.-Atmos., 103, 22 361–22 373, 1998.
Whalley, L. K., Lewis, A. C., McQuaid, J. B., Purvis, R. M., Lee, J. D., Stemmler, K., Zellweger, C., and Ridgeon, P.: Two high-speed, portable GC systems designed for the measurement of non-methane hydrocarbons and PAN: Results from the Jungfrau-joch High Altitude Observatory, J. Environ. Monit., 6, 234–241, 2004.
Zanis, P., Monks, P. S., Green, T. J., Schuepbach, E., Carpenter, L. J., Mills, G. P., Rickard, A. R., Brough, N., and Penkett, S. A.: Seasonal variation of peroxy radicals in the lower free tro-posphere based on observations from the FREE Tropospheric EXperiments in the Swiss Alps, Geophys. Res. Lett., 30, 1497, doi:10.1029/2003GL017122, 2003.
Zanis, P., Monks, P. S., Schuepbach, E., Carpenter, L. J., Green, T. J., Mills, G. P., Bauguitte, S., and Penkett, S. A.: In situ ozone production under free tropospheric conditions during FREETEX ’98 in the Swiss Alps, J. Geophys. Res.-Atmos., 105, 24 223– 24 234, 2000a.
Zanis, P., Monks, P. S., Schuepbach, E., and Penkett, S. A.: The role of in situ photochemistry in the control of ozone during spring at the Jungfraujoch (3580 m a.s.l.) – comparison of model results with measurements, J. Atmos. Chem., 37, 1–27, 2000b. Zanis, P., Monks, P. S., Schuepbach, E., and Penkett, S. A.: On the
relationship of HO2+RO2with j((OD)-D-1) during the Free
Tro-pospheric Experiment (FREETEX ’96) at the Jungfraujoch Ob-servatory (3580 m above sea level) in the Swiss Alps, J. Geophy. Res.-Atmos., 104, 26 913–26 925, 1999.
Zellweger, C., Ammann, M., Buchmann, B., Hofer, P., Lugauer, M., Ruttimann, R., Streit, N., Weingartner, E., and Baltensperger, U.: Summertime NOyspeciation at the Jungfraujoch, 3580 m above sea level, Switzerland, J. Geophys. Res.-Atmos., 105, 6655– 6667, 2000.
Zellweger, C., Forrer, J., Hofer, P., Nyeki, S., Schwarzenbach, B., Weingartner, E., Ammann, M., and Baltensperger, U.: Parti-tioning of reactive nitrogen (NOy) and dependence on
meteoro-logical conditions in the lower free troposphere, Atmos. Chem. Phys., 3, 779–796, 2003,