Automated Assembly Using Feature Localization
bySteven Jeffrey Gordon
BSNIE Massachusetts Institute of Technology (1979)
NIS.ME Massachusetts Institute of Technology (1983)
Submitted to the Department of Mechanical Engineering in
Partial Fulfillment of the Requirements for the Degree of
Doctor of Philosophy In Mechanical Engineering
at the
Massachusetts Institute Of Technology February 1987
:MIassachusetts Institute of Technology
Signature of Author.
Department of Mechanical Engineering January 19, 1987 (C'titified by_
Professor Warren P. Seering Thesis Supervisor
Accepted bv
Ain A. Sonin
Chairman. Depart mental Graduate Committee ARCHIVES
MAR 0 9
1987
-Automated Assembly Using Feature Localization
by
Steven Jeffrey Gordon
Submitted to the Department of Mechanical Engineering on
December 20, 1986 in partial fulfillment of the requirements for the degree of Doctor of Philosophy in Mechanical Engineering.
Abstract
Automated assembly of mechanical devices is studied by researching methods of operating assembly equipment in a variable manner; that is, systems which may be configured to perform many different assembly operations are studied. The general parts assembly operation involves the removal of alignment errors within some tolerance and without damaging the parts. Two methods for eliminating alignment errors are discussed: a priori suppression and measurement and removal. Both methods are studied with the more novel measurement and removal technique being studied in greater detail. During the study of this technique, a fast and accurate six degree-of-freedom position sensor based on a light-stripe vision technique was developed. Specifications for the sensor were derived from an assembly-system error analysis. Studies on extracting accurate information from the sensor by optimally reducing redundant information, filtering quantization noise, and careful calibration procedures were performed.
Prototype assembly systems for both error elimination techniques were imple-mented and used to assemble several products. The assembly system based on the a priori suppression technique uses a number of mechanical assembly tools and software systems which extend the capabilities of industrial robots. The need for the tools was determined through an assembly task analysis of several consumer and automotive products. The assembly system based on the measurement and removal technique used the six degree-of-freedom position sensor to measure part misalignments. Robot commands for aligning the parts were automatically calcu-lated based on the sensor data and executed.
Thesis Supervisor: Warren P. Seering
Acknowledgments
First I would like to thank my thesis advisor Warren Seering. Professor Seering puts his students first and was always willing to listen to my ideas and help direct my thoughts. He is perhaps the most energetic and optimistic person I have ever met and I have a great deal of respect for him. In addition to his time commit-ment he has taught me much about dealing with people and being a professional
researcher.
I was fortunate enough to have selected an excellent thesis committee who took a strong interest in my problem. The members included Warren Seering, Dave Gossard, Tomas Lozano-Perez, and Dan Whitney. I believe their advice and comments were instrumental in making my thesis a worthy contribution. I would especially like to thank Dan Whitney for his thoughts on how the work should be organized.
I owe a lot to my family and friends who gave me support and the freedom to be somewhat reclusive for the past four or so years. My parents are responsible for shaping me into the person I am today; I will never be able to thank them enough. My office mates and other AI lab members played an essential role in my re-search and social life during my stay at MIT. Al Ward and Neil Singer were part of the brainstorming team during the initial assembly cell design and are as much responsible for the basic concepts as I. In addition, Al designed the base plates and the interchangeable fingers and Neil designed the flexible pallets. Steve Eppinger helped me debug the cell and r-t it running. I would like to thank John Canny for his expert help with quaternions and feature detection and Steve Buckley for his authoritative AML advice. Thanks go to Mike Caine for his adjustable peg-in-hole.
Ken Pasch was always available to both bounce ideas off of and generate new ones. He is extremely sharp and almost always has good new ideas. I would also like to thank Beth, Dunbar, Karl, Eric, Mike, Rob, Marc. Terry and many others who gave me support.
Patrick Winston and the many others who make the AI lab a top notch re-search facility deserve recognition. This thesis describes rere-search done at the De-partment of Mechanical Engineering and Artificial Intelligence Laboratory of the Massachusetts Institute of Technology. Support for the laboratory's artificial intel-ligence research is provided in part by the System Development Foundation and in part by the Advanced Research Projects Agency of the Department of Defense un-der Office of Naval Research contract N00014-85-K-0124. Support for this research project is also provided in part by IBM.
Contents
Abstract 2
Acknowledgments 3
1 Introduction 19
1.1 Background and Motivation ... . . . . 19
1.1.1 Purpose of the Research ... .. 19
1.1.2 Flexible Assembly Systems and Batch Manufacturing . . . . 20
1.1.3 The Rigid-Parts Assembly Process ... 20
1.1.4 Methods for Eliminating Positioning Errors ... 22
1.1.5 Comparison of the Two Methods of Error Removal ... 23
1.2 Overview of the Thesis ... 25
2 Programmable Assembly Systems 27 2.1 Literature Review of Research in Programmable Assembly ... .27
2.2 Classification of Assembly Operations ... 44
2.2.1 Assembly Task Analysis ... 45
2.3 Peg-in-Hole Assembly Failure Modes ... .. 47
2.4 Manipulator Repeatability, Accuracy and Local Accuracy ... 50
2.5 Assembly Procedure Using the A Priori Error Suppression Method . 52 2.6 Assembly Procedure Using the Measurement and Removal Method . 53 2.6.1 Assembly Procedures for Systems Using One and Two Sen-sors . . . .. . . .. 55
CONTENTS
2.6.2 Coordinate Frame Definitions . . . . 56
2.6.3 Correcting Sensed Misalignments ... 57
2.7 Classification and Analysis of Errors ... .59
2.7.1 Assumptions ... . 59
2.7.2 Representation of Rigid Transformations ... .59
2.7.3 Representation of Errors ... . . . . 61
2.7.4 Combining Errors From Independent Sources ... 61
2.7.5 Random Transformations ... 64
2.7.6 Relative Random Transformations ... 64
2.7.7 Identification of Sources of Error ... 66
2.8 Errors in the A Priori Error Suppression Method. ... . . . . . 71
2.9 Errors in the Measurement and Removal Method ... . . . . . 73
2.9.1 Error Sources ... 73
2.10 Errors in a Typical Assembly Task ... 73
3 Part Position Sensing for Assembly 3.1 Literature Review on Vision Based Part Sensing . . . . 3.1.1 Ranging Systems... 3.1.2 Model Based Object Recognition and Position Determination 3.1.3 Vision-Sensor-Driven Assembly . . . . 3.2 Locating Objects from Range Data . . . . 3.2.1 Introduction ... 3.2.2 Method of Evaluation ... 3.2.3 Studies . . . . 3.2.4 Conclusions ... . . . . ... . . . . 3.3 Assembly Systems Which Use a Part Position Sensor . . . . 3.4 Sensor Design Requirements . . . . 3.5 Choosing a Part Position Sensing Technique . . . . 3.5.1 Predicted Sensor Performance . . . . 81 81 81 83 85 86 86 86 88 95 97 100 101 101 4 Feature Localization Using a Light Stripe Vision System 4.1 Literature Review of Feature Extraction Techniques . . 4.2 Light Stripe Part Position Sensor Fundamentals . . . . 4.2.1 Review of Elementary Optics . . . . 4.2.2 Determining World Coordinates from Sensor Data . 105 ... 105
... 108
... 110
4.3 Locating Straight Line Features in Quantized Images... 4.3.1 Introduction ...
Errors in Fitting Linear Parameters to Dis Conclusions...
Row Subpixel Localization of Light Stripe I 4.4.1 Intensity Profile of the Light Stripe . . . . 4.4.2 Minimum Sampling Frequency ... 4.4.3 Adjusting the Width of the Light Stripe . 4.4.4 Thresholding Technique . . . . 4.4.5 Center of Area Technique . . . . 4.4.6 Match Filtering and Peak Detection . . . 4.5 Using Redundant Sensed Information . . . . 4.5.1 Optimal Estimation Theory . . . . 4.6 Processing Light Stripe Images . . . . 4.6.1 Sensing and Image Processing Hardware . 4.6.2 Image Processing Steps . . . . 4.7 Measuring the Location of Features with a Single 4.7.1 Locating General Polyhedral Features . . 4.7.2 Locating Right Corner Features . . . . 4.7.3 Locating Other Features . . . . 4.8 Using 4.8.1 4.8.2 cretized Data . . . 114 . . . 128 Features ... 128 . . . ... . . 128 . . . ... .132 . . . ... . 134 . . . ... .135 . . . ... . . 136 ... . 141 ... . 142 ... . 143 .. . . . . ... . 145 ... ... 145 .. .. ... . 146 Light Stripe. Multiple Light Planes to Locate Polyhedral Features . . . . . Non-Optimal Orientation Estimation for Polyhedral Features Optimal Estimation of Orientation for a Polyhedral Feature . 5 Assembly Using the A Priori Error Suppression Technique 5.1 Introduction ... ... 5.2 Versatile Tools for Programmable Assembly Systems... 5.2.1 Prototype Assembly Cell Hardware . . . . 5.3 A Hybrid On/Off-Line Programming System . . . . 5.3.1 Position Definition System . . . . 5.3.2 Generation of Robot Paths in an Assembly Cell . . . 5.3.3 Path Definition... 5.3.4 Path Transforms ... 5.3.5 Automatic Pallet Indexing . . . . .. .150 S.. 151 S. 154 S. .156 157 157 158 161 .... 161 .... 162 .... 162 ... . 173 .... 173 ... . 176 .... 177 .... 177 .... 180 CONTENTS 4.3.2 4.3.3 4.4 Single . . . 114 S. . 114
CONTENTS
5.3.6 Error Recovery ...
5.4 Assembly System Implementation . . . . 5.4.1 Assembly Cell Setup Procedure . . . . 5.4.2 Workspace Calibration Procedure... 5.4.3 Power Drill Assembly Procedure ... 5.5 Conclusions and Discussion ...
. . . 181 . . . 182 . . . . .. . . . 183 .. ... .... 186 . . . 191 .. ... 199
6 Prototype Position-Sensor-Driven Assembly System 6.1 Components of the Prototype Sensor ... 6.2 Construction of the Test Bed ... 6.3 Calibration of the Camera-Light Stripe System . . . . 6.3.1 Camera Calibration Procedure . . . . 6.3.2 Calibration of Laser Parameters . . . . 6.4 Performance Evaluation of the Prototype Sensor . . . . 6.4.1 Test Procedure ... 6.4.2 Single Light Plane Test Results . . . . 6.4.3 Multiple Light Plane Test Results ... 6.5 Repeatability and Accuracy of the Unimation PUMA Robot 6.5.1 Repeatability Test ... 6.5.2 Local Accuracy Test ... 6.6 Prototype Sensor-Driven Assembly System . . . . 6.6.1 Sensor-Driven Assembly Demonstration Tasks . 6.6.2 Square Peg-in-hole Analysis and Tests . . . . 203 ... 203 ... 205 ... .206 ... 206 ... 212 ... 213 ... 213 ... 215 ... 217 ... 218 ... 218 ... 221 ... 222 ... 224 ... 227
7 Discussion, Applications, and Conclusions
7.1 Discussion.. . ... . .. .... . . ... . . .. . ...
7.1.1 Development of Computer Integrated Manufacturing Sys-tem s. . . . 7.1.2 Development of the Sensor . . . . 7.1.3 Development of Position-Sensor-Based Assembly Systems . 7.2 Applications of the Sensing Technology . . . .
7.3 Technical Contributions and Conclusions . . . .
A Path System Definitions
A.1 Paths . . . . 233 . 233 .233 . 234 . 235 . 236 . 238 241 * 241
CONTENTS 9 A.2 Path Transforms ... ... 242
A.2.1 Spatial Path Transforms ... .. 242 A.2.2 Cylindrical Path Transforms ... 244
B 7565 Workspace Waviness 247
C Flexible Fixture Design Calculations 251
D Errors Generated with a Spherical Wrist 255
E Product of Two Normally Distributed Random Variables 259
List of Figures
2.1 Summary of frequency of assembly operations for products studied.. 46
2.2 Failure modes for the peg in hole assembly. ... 48
2.3 Parameters for the two-dimensional peg in hole assembly ... 49
2.4 Sensor-driven assembly system. ... .. 54
2.5 Calculation of the robot to part transformation ... 58
2.6 Graphical representation of a rigid transformation. ... 60
2.7 Three dimensional probability density function. ... 62
2.8 Result of convolving two two-dimensional probability density func-tions. ... 63
2.9 Errors in part positions due to manipulator errors may be equiva-lently represented by errors in the location of the world frame. ... 68
3.1 Two dimensional model of a ranging sensor and object ... 87
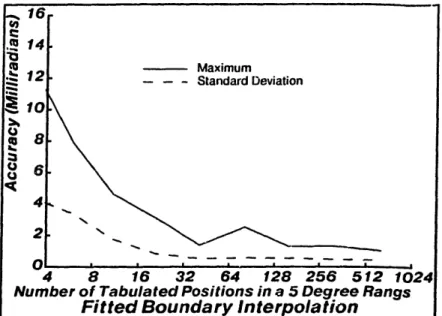
3.2 Dependency of the fitted boundary interpolation technique on table density for the pan image oriented between 5 and 10 degrees. .... 88
3.3 Two dimensional images used to test the accuracy of the part locat-ing algorithms. ... ... 89
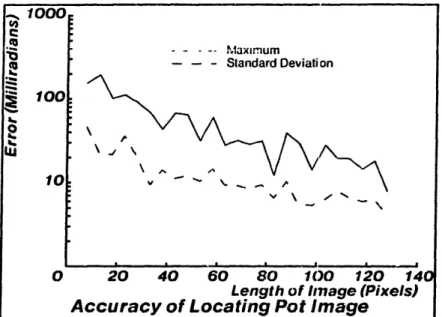
3.4 Dependence of the fitted boundary interpolation algorithm on the length of an image of a pan whose orientation is between 5 and 10 degrees ... .. 90
3.5 Dependency of the fitted boundary interpolation technique with im-age orientation for an imim-age of a pan ... 91
LIST OF FIGURES
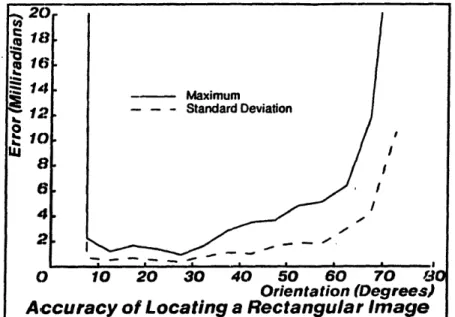
3.6 Dependency of the fitted boundary interpolation technique with im-age orientation for an imim-age of a rectangle ... 91 3.7 Dependence of the fitted boundary interpolation technique on the
aspect ratio of a rectangular image ... 93 3.8 Dependence of the fitted boundary interpolation technique on the
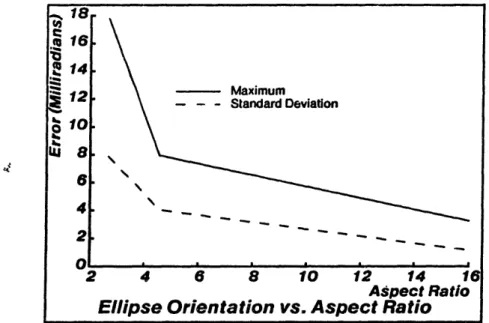
aspect ratio of an elliptical image ... . . . ... . 93 3.9 Pan image table entries for the fitted boundary interpolation
tech-nique . . . 94 3.10 Tables for rectangles of various aspect ratios . . . . ... 94 3.11 Tables for ellipses of various aspect ratios ... 95 3.12 Shift of fitted line due to small rotation of a discretized ellipse. . . 96 3.13 An assembly system which uses a part position sensor . . . 98 3.14 Degree of rotational freedom for simulated block tests. ... 102 3.15 Results of the simulated corner localization tests. ... 103 4.1 Three line segments generated by the intersection of a plane of light
and the surfaces of a polyhedral feature may be sensed by a video camera and used to locate a part ... . 108 4.2 Light stripe sensor configuration . . . 109 4.3 Parameters for modeling a thick lens ... 111 4.4 Parameters for a line in the image plane and vectors specifying the
light stripe. ... ... 113
4.5 Parameters for the image of a line (infinitely thin). ... . . . 116
4.6 Probabilistic location of points on a line . . . ... .118 4.7 Standard deviations for orientation and y intercept estimates as a
function of the number of illuminated pixels ... 121 4.8 Probability distributions of line parameters ... 121 4.9 Target and camera arrangement for computer simulation and
exper-im ental tests . .. ... ... .. 123
4.10 Accuracy of the least squares fitting routine for discretized lines as a function of their orientation. ... 123
4.11 Range of motions of lines before change in state of sensor occurs. . . 124
4.12 Experimental test rig for line fitting tests. . ... . .125
4.13 Dependence of the least squares algorithm on the length of an image of a line segment at orientations is between 5 and 10 degrees. ... .127
SIL T OF FIGURES
4.14 Intensity profile of a light stripe. ... . 129
4.15 Fourier transform of a sampled. smoothed sin2(x)/2' function. . . 130
4.16 Intensity profile of a light stripe as measured by a CCD camera. .. 131
4.17 Gaussian approximation of a smoothed sinc(.r) function. ... 132
4.18 Fourier transform of a sampled Gaussian. ... 133
4.19 Fraction of energy lost in the frequency domain due to undersam-pling a Gaussian ... ... .... ... 134
4.20 Determining the location of an image of a light stripe by threshold-ing. ... 135
4.21 Errors in center of area estimate due to noise irn intensity levels for a Gaussian intensity profile. ... .... 138
4.22 Offsets in sample position from the position of the peak of the in-tensity profile produces errors in center of area estimates. ... 138
4.23 Errors in center of area estimate as a function of relative sampling position ... ... 139
4.24 Standard deviation of errors due to sample offsets of a sinc2(x) shaped intensity profile as a function of the number of samples. ... . 140
4.25 The match-filter and peak detection procedure for determining the location of the peak of an intensity profile. ... 143
4.26 Sensing ... image processing system components. ... 145
4.27 Recursive split-and-merge segmentation algorithm. ... 148
4.28 Coordinates used for the line fitting algorithm. ... 149
4.29 Some features which may be located in five or six degrees of freedom from data generated by the intersection of a single light plane. . .. 150
4.30 Light plane intersecting a polyhedral feature and a corresponding model of the feature ... 151
4.31 A right corner feature and reference frames used to determine its orientation. ... 154
4.32 Euler angles used in the least squares estimate for the orientation of a polyhedral feature... 158
5.1 Reference base plates ... ... . . 163
5.2 Assembly vise. ... 164
5.3 Different combinations of vise fixturing systems which may be used to constrain the base part in an assembly. ... 165
14 LIST OF FIGURES 5.4 5.5 5.6 5.7 5.8 5.9 5.10 5.11 5.12 5.13 5.14 5.15 5.16 5.17 5.18 5.19 5.20 6.1 6.2 6.3
The prototype sensor system . . . . Test bed used for sensor accuracy studies. Target for camera calibration . . . .
Flexible fixture... Flexible pallets...
Flexible pallets fixturing drill parts . . . . .
IBM 7565 gripper finger interface . . . . .
Shaft/hole and setup grippers . . . . .
Position definition system... Task execution system...
Spatial, planar and cylindrically transformed paths Assembly cell setup procedure . . . . Yaw and pitch calibration fixtures . . . . Robot repeatability vs. time plots . . . . Consumer hand drill parts...
Hand drill assembly cell...
Example top level assembly program.. . . . . Drill assembly procedure . . . . .
Chuck threading operation...
Washer assembly operation . . . .
. . . . .204
. . . . .205
. . . . .207
6.4 Camera and object plane used to define the center-of-expansion. . 6.5 Method for determining the disparity angle, tilt angle, and light plane to camera distance.. ... 6.6 Test cube mounted on rotational stages . . . . 6.7 Errors in locating the corner of a cube.. . . . . 6.8 The intersection of two independent light planes with a cube . . . 6.9 Maximum likelihood estimates of rotation angles of the test cube. . 6.10 Maximum likelihood estimates of rotation angles of test cube from pairs of angles.. ... 6.11 PUMA manipulator and prismatic target used for repeatability and accuracy studies.. ... 6.12 Results from the PUMA local accuracy tests .. . . ... 6.13 The prototype position-sensor-based assembly system ... 6.14 Connector assembly and vice fixture . . . . . . . ..167 . ... . 169 . . . . .170 . . . 171 . . . . .172 . ... .173 . ... . 176 . . . 178 . . . . . 184 . . . 187 . . . . . 190 .. . . ... .192 .. . .. . ... .193 . . . 194 . . . . .195 .. . ... .... 197 . . . . .198 .209 .213 . 214 . 216 .217 .219 .220 .221 .222 . 223 . 224
LIST OF FIGURES~
14Die-cast box assembly...
Square peg and hole assembly . . . . . Procedure for the sensor-driven assembly demonstration . . . . Camera frame of peg and light stripe intersection . . . . . Sensed peg location superimposed on the frame from which the po-sitional information was calculated.. . . . .
A.1 Path coordinate system . . . . A.2 The spatial path transform . . . . A.3 The cylindrical path transform . . . . B.1 Technique used for measuring the height of the robot base. B.2 Two views of 7565 surface plate height variation . . . . C.1 Structure of the flexible fixture arm . . . . C.2 Free body diagram of a single ball in the fixture arm.. . . . C.3 Flexible fixture resisting-moment plot . . . .
... 242 ... 243 ... 244 ... 248 ... 249 ... 252 ... 252 ... 254
D.1 Spherical Wrist Joint... D.2 Spherical wrist errors in the three coordinate directions and the cartesian sum .. ... S256 S257 E.1 Sample space for random variable z = xy. ... 260
E.2 Derived distribution for the product of two normally distributed independent random variables. ... .. 261
LIST OF FIGURES 6.15 6.16 6.17 6.18 6.19 . 225 . 226 . 228 . 230 . 230
List of Tables
2.1 Assembly procedure for the a priori suppression method of error elim ination . . . 52 2.2 Assembly procedures for a typical sensor-driven assembly tasks .... 56
2.3 Vectors corresponding to transformation errors which occur during the calibration and teaching phase. ... 74 2.4 Vectors corresponding to transformation errors which occur during
the task execution phase. ... 74
4.1 Nomenclature for line parameter error analysis. ... 115
4.2 Experimental error sources for measuring straight-line features .... 127
5.1 Hand drill parts in order of assembly ... 196 6.1 Results of the part position sensor accuracy tests... 216 6.2 Acceptable volumes to obtain accurate sensor readings for three test
Introduction
Chapter 1
1.1
Background and Motivation
The current capabilities of mechanical manipulators are inadequate to solve many industrial assembly problems. Although there has been some success with force and compliance controlled assembly machines (see i202] for an overview) and much success with passive compliant devices, notably the RCC or Remote Center of Compliance [104,133,204j, most industrial systems depend upon precision assembly techniques (assembly is performed with no feedback other than precise position-ing) to accomplish assembly operations. "Hard" automated assembly machines, machines specially designed for a single function, have been used very success-fully, but they are capable of assembling only a single product and are inflexible to changes in product or part style. Because the flexible assembly problem is not well understood, the approach used in automating the problem has been to emulate humans by using some vision and force feedback. The approach taken in this thesis has been to solve the assembly problem by analyzing the task directly. Many of the techniques developed are fundamentally different from those used by humans.
1.1.1 Purpose of the Research
In order to develop technologically and economically viable flexible assembly sys-tems the capabilities of present day syssys-tems must be extended so that they are able to handle a wide variety of part shapes, sizes, tolerances, and assembly operations without using excessively costly means. We address this need through theoretical
20 Chapter 1: Introduction
and experimental investigations of programmable tools and sensors, and investigate feasibility through the development of a number of prototypes.
1.1.2 Flexible Assembly Systems and Batch Manufacturing
Flexibility is defined to be the ability to handle different parts and perform different assembly operations. It is one of the key issues in increasing productivity through automation in certain industries (see Section 2.1). FlexiJle assembly systems are electronically controlled mechanical systems which are capable of the production (primarily assembly) of morphologically different products. Theoretically, such a system is capable of producing sequential runs of many different products with relatively short setup times between runs. The size of the subset of products which a system can handle depends upon the size and weight of the elements as well as the operations necessary for the products' assembly.Many of the process and mass production industries have been highly auto-mated for some time. In contrast, processes used in batch manufacturing are al-most entirely manual. The batch manufacturing system (a limited set of resources which is reconfigured to produce a number of different products) presents a num-ber of unique problems to automation. Productive operation of the system requires sophisticated scheduling with almost all aspects of the system having some degree of flexibility.
1.1.3
The Rigid-Parts Assembly Process
An assembly task may be defined as followsTwo or more parts are moved to a desired relative position within some tolerance. The process which juxtaposes the parts should not physically alter them unless it is a requirement of the task.
Thus, assembly is a positioning problem. According to Simunovid [176` The assembly process is strictly a positioning problem. Complete knowledge of the parts and ideal positioning devices would, at least in principle, make the assembly task a trivial matter. The imperfections of the real world are materialized as position errors in the physical assembly systems; these errors translate into an error in the relative position between the parts at mating;
§1.1: Background and •Motivation
the resulting error in the relative positions between the parts at mating will cause interference between the geometry of the parts, and therefore not allow the parts to be assembled.
In general, parts comprising an assembly are manufactured in batches of identi-cal parts and are delivered to the assembly system in groups. In order to eliminate the relative positioning errors, the parts must be separated, grossly positioned. then mated.
The Three Phases of Rigid-Parts Assembly
Rigid-parts assembly may be broken down into three main phases independent of the type of system which performs the assembly.
1. Part acquisition 2. Part alignment 3. Part mating
The part acquisition phase entails part identification and gross orientation through conventional feeding mechanisms, machine vision or other sensing systems. or through manual techniques. The part alignment phase is typically performed by a manipulator and might also involve fixtures, sensors and search procedures. Part mating is the first phase where parts may touch one another. In this phase. ei-ther force or compliance control, passive compliance, or sufficient precision to allow non-contact mating is required. The performance of an assembly system in each of the latter phases is affected by the system performance in previous phases. This research attempts to increase the system performance in the part alignment phase and relax the requirements for the part mating phase.
Relationship Between Part Alignment and Part Mating
During the part mating phase, a direct position measurement of one part relative to the other is not generally available. Any necessary repositioning is driven by the forces generated between the mating parts. Techniques which have been used to eliminate positioning errors from force information include force and compli-ance control, logic branching, and passive complicompli-ance (see Reference 12021 for an
overview of these techniques). Passive compliance techniques are generally the simplest to implement for error correction during the mating phase. Relaxation of requirements for the passive compliance system is possible if the parts are aligned precisely enough during the part alignment phase.
Relaxation of the passive compliance requirements means that the assembly can successfully occur with a larger tolerance on the location of the center of rotational compliance and a larger tolerance on the magnitudes of the translational and rotational compliances. A successful assembly is one in which the parts are completely assembled without damage.
1.1.4 Methods for Eliminating Positioning Errors
Errors in part positions may be eliminated by one of two ways j176j
A Priori Suppression: Eliminate errors at their sources.
Measurement and Removal: Eliminate errors during or just before the mating
process.
Hard automated assembly systems and some robotic assembly systems (such as the one described in Chapter 5) take the a priori suppression approach. These systems rely on accurate jigs and fixtures and precise actuator positioning. Humans and some advanced robotic assembly systems rely heavily on the measurement
and removal approach to assembly. These systems use tactile (force) and visual
(position) information to sufficiently align the parts. The sensor-driven assembly system described in Chapter 6 takes this approach.
A Priori Error Suppression
Elimination of errors by the a priori suppression method entails controlling error propagation. In general, when components are originally manufactured, their po-sition is well known. For example, the location of features of parts machined in a milling machine are referenced to the cutting tool up until the point where the vice is released. If the location of a part were precisely maintained from the point of manufacture to the point of assembly, only small errors would need to be elimi-nated for the mating phase. The a priori suppression method also includes systems
Chapicr 1: Introduction
§1.1: Background and Motivation 23
which do not constrain the location of parts from their point of manufacture, but which orient parts at some later time then fixture them in pallets or jigs prior to their assembly.
Sources of position errors include
* Loss of location information after machining or molding operations.
* Loss of location information after finishing operations such as plating, polishing, tumbling and cleaning.
* Finite precision orienting techniques (e.g. bowl feeding). * Finite precision pallet, assembly jig, or gripper fixturing. * Finite precision manipulator positioning.
* Significant part tolerances.
In order for the a priori suppression method to be successful, errors from all pertinent sources must be controlled.
Error Measurement and Removal
In the measurement and removal method for eliminating errors, the relative position of mating part features are measured either directly from position measurements or indirectly from force measurements. After the measurements are made. the manipulator reorients the parts nullifying measured misalignments. In an ideal system using this approach, sensor accuracy and manipulator motion resolution are precise enough to mate the parts without interference between surfaces. A more practical system would rely on the f-rces generated between mating surfaces to correct any remaining errors with the aid of the passive compliance of the system.
1.1.5 Comparison of the Two Methods of Error Removal
Advantages and Disadvantages of Each Method
A system which uses the measurement and removal method of eliminating position errors is more flexible than a system based on the a priori suppression method; that is, less specialized tooling is required to perform a large variety of tasks. The
24
system which uses the measurement and removal method is relatively insensitive to the accuracy and wear of jigs, grippers, and pallets which locate the parts and the assembly. Since measurements of the mating features are made. the system is also relatively insensitive to large non-mating feature part tolerances and imperfections (such as burrs). The jigs which locate the parts need to locate them to within the acceptable range of the sensor. This may be as large as an order of magnitude bigger than the range allowable in the a priori suppression method (see Section 6.6.1). In some cases it may be desirable for the part jigs (including grippers and pallets) to only firmly hold the parts and not accurately locate them. Thus the measurement
and removal method supports the use of universal grippers and pallets.
Using the measuring method allows assembly operations to be performed more reliably. Because the part features are sensed, there is additional assurance that the part is in the proper position prior to mating. It may also be possible to more accurately align parts. In addition, successful assembly operations may be performed without calibrating the robot to all of the pallets and jigs in the cell. The system operates somewhat uncoupled from the absolute positioning of the manipulator; that is, all commanded motions are relative to sensed positions with respect to the world frame. Because of this, offline programming of assembly tasks is easier and requires less absolute position references and online teaching and calibration.
There are, however, a number of disadvantages to the measurement and removal method. First, a finite time is required to perform the sensing. Depending on the type of sensor and the stage of the assembly process in which the measurement is made, the assembly procedure might be slowed. For a vision sensor with the camera mounted offboard of the manipulator, the system must allow sufficient time for the manipulator to come to rest (let all vibrations settle). Time is also required to grab a frame (- sec.) and process the image. The system also has finite measurement accuracy which might not be appropriate for all tasks. A vision based system is also sensitive to the surface reflectance properties of objects and surface orientations with respect to the sensor.
A limiting consideration in using a vision based measurement and removal method is that not all features are easily sensed. It is likely that features com-prised of relatively simple primitives (e.g. quadric surfaces) may be sensed with a technique similar to the one presented in Chapter 4, but more complicated features
§1.2: Overview of the Thesis 25
may create problems. One study has showed that about 85 percent of "all man-ufactured parts" may be accurately modeled by planar, cylindrical, and spherical patches f81]. Although the accuracy of this estimate is questionable, the estimate is at least promising. Even if features of any shape could be located with the sen-sor, it is likely that the system would not be able to locate features with large size differences. It might, however, be possible to design a system with an adjustable field of view to accurately locate different sized features.
Which Method is Better?
Both the a priori error suppression and the measurement and removal methods of
error elimination may be successfully used for robotic assembly tasks. The best method to use depends upon the requirements of the task. The a priori error
suppression method is relatively insensitive to the shape of the parts being mated;
however, it is relatively inflexible. A particular set of hardware must be used to accurately fixture to parts. The measurement and removal is highly flexible since almost no specialized mechanical fixtures are used, but the types of part shapes which may be sensed and assembled is limited.
With further development of the sensing system proposed in this thesis (or other sensing techniques), the sensor-driven assembly technique will be capable of handling a larger number of part shapes. As compared to the a priori suppression method it will be much more flexible and cost effective for industrial assembly
systems operating in a batch production mode.
1.2
Overview of the Thesis
This thesis discusses issues in programmable mechanical assembly systems. In this chapter we have introduces the problem and suggested approaches to its solution. Two methods were proposed to eliminate the errors in part alignment: a priori
elimination, and measurement and removal.
Chapter 2 gives the background on the assembly problem and an elaboration of the two solution techniques. A literature review of research in programmable assembly systems is followed by a survey of operations involved in certain mechani-cal assemblies. Assembly operations are classified with respect to the magnitude of difficulty for a single chain manipulator. A review of failure modes for the canonical
peg-in-hole assembly operation is presented. Errors in robotic assembly systems
are analyzed and applied to both the a priori suppression and the measurement and
removal methods. Accuracy specifications for a part position sensor are calculated.
Requirements for an industrial sensing system for measuring part alignment errors are discussed in Chapter 3. A literature review of ranging techniques is given and two techniques are analytically t.xplored. Arguments for using a light-stripe vision system for the part-position-sensing function are presented.
Chapter 4 discusses the details of the development of a light-stripe based part position sensor. First literature dealing with research in extracting accurate infor-mation from noisy images is reviewed. Both optical and geometric fundamentals of the light-stripe technique are then presented. Methods for extracting and quantify-ing the accuracy of information from light-stripe images are then explored. These include an error analysis of finding straight line features corrupted by quantization noise, methods for determining the accuracy in finding the center of a light-stripe using three different techniques, and a technique to combine redundant informa-tion from multiple light plane illuminainforma-tion of a part feature. The hardware and algorithms necessary to extract six degree-of-freedom measurements from a single light-stripe image are also presented.
Chapters 5 and 6 describe prototype assembly systems using the two methods of error elimination presented in this chapter. The system in Chapter 5 uses a number of flexibly designed tools and an industrial robot to control the propagation of position errors during the assembly process. The assembly system in Chapter 6
is vision sensor based. The accuracy of a prototype light-stripe vision system used for part position measurements is investigated in a specially constructed test bed.
Details of the sensor calibration are also given.
Chapter 7 contains a discussion of what additional research is necessary to develop the prototype systems into industrial systems which may be used in man-ufacturing facilities. Uses for the sensing technology in addition to part position sensing for assembly operations are also presented. Finally conclusions and tech-nical contributions of the work are enumerated.
Programmable Assembly Systems
Chapter 2
2.1
Literature Review of Research in Programmable
Assembly
Worker productivity has increased steadily throughout recent history. Within the last decade, application of automated manufacturing technology has resulted in dramatic changes in rates of productivity growth within those industrialized nations choosing to invest the necessary capital and human resources. Tesar rated a number of elements which produce increased productivity 1921. He found that technology produces 38.1 percent, capital -25.4 percent, labor quality - 14.3 percent, economics of scale - 12.7 percent and resource allocation - 9.5 percent. He also notes that all western trading partners had higher productivity growths than the United States.
The Labor Force
The work force in the United States has recently undergone a major shift in worker qualifications which could result in a growing demand for manually skilled labor. According to Merchant [126], 60 percent of the current U.S. workforce hold degrees from a secondary school, while 50 percent of those entering the workforce have a college or university education. According to Catalano '421 there will be a shortage of manual labor by the year 1990 assuming a moderate GNP growth and limited productivity increases from automation. Merchant and Catalano suggest that since there are fewer people who will be entering into the manual labor force, manufac-turing industries must either automate a number of their operations or drastically
improve the efficiency of the operations. Catalano gives estimates of manual labor shortages in the US. but these are probably not accurate since an increased foreign labor market is not taken into account and the sources of the GNP will shift other industries.
Manufacturing's Economic Contribution
Merchant notes that although manufacturing industries account for 33 percent of the international gross national product (24 percent of the U.S. GNP) while ser-vice industries make up 50 percent (63 percent in U.S.), it produces 66 percent of the wealth (65 percent in the U.S.). Many of the process and mass production manufacturing industries have been highly automated for some time. In contrast, processes used in batch manufacturing are almost entirely manual. The batch man-ufacturing environment presents a number of unique problems to automation. A single system (a set of tools and resources) is frequently reconfigured to produce a number of different products. Productive operation of the system requires so-phisticated scheduling with almost all aspects of the system having some degree of flexibility. Anderson [10] notes that since 75 percent (by value) of all U.S. discreet engineered products are produced in the batch mode, national productivity can be significantly increased by making the batch manufacturing process more efficient.
Automation in Manufacturing
One method of improving batch production efficiency is to automate with comput-ers and computer controlled machinery. Andcomput-erson j10] demonstrates that machine shops have reduced both direct labor cost and manufacturing time by 75 per-cent with the use of numerically controlled and computer numerically controlled machines. Increased computerization in the batch production industry will likely increase the utilization of capital equipment as well as increase the quality and uni-formity of the products produced. Presently, parts being processed in the job shop environment are idle about 90 percent of the time [10); whereas, in an automated job shop environment, in-process inventory is substantially reduced. In addition to the economic benefits of automation, the worker will be relieved from boring trivial tasks which may be readily accomplished by machines and is more likely to have more interesting skilled work. Yonemoto of the Japanese Industrial Robot As-Chapter 2: Programmable Assembly Systems
§2.1:
Literature Review of Research in Programmable Assemblysociation (JIRA) [207,208] shows that some improvements associated with robots are increased productivity, humanization of working life, increased labor safety, improved product quality and early return on investment. Many US managers would probably disagree with Yonemoto's last "improvement" since low return on investment has been one of the major factors retarding factory automation through robot installations.
Economics of Assembly
Anderson estimates that assembly accounts for about 35 percent of the production cost for discreetly engineered products. Nevins and Whitney of the Charles Stark Draper Labs [132,133] have studied the science of assembly and have classified the 3 modes of assembly. Manual assembly is appropriate for products with low production volume. Low fixed costs are also associated with this mode so there is no economy of scale. The manual assembler has the characteristics of being very flexible and easy to train. He has excellent sensory capabilities, but may tend to lack reproducibility and get bored. Assembly via fixed automation is appropriate for products with high volume constraints. Fixed automation typically has high fixed costs and high efficiencies. These systems are not very flexible and tend to fail due to part jams while there is usually little sensory capability. Programmable automatic assembly has medium fixed costs and is appropriate for medium production volumes. It has medium efficiency and is capable of responding to sensory inputs and learning new tasks. Nevins and Whitney have also studied the amount which is invested in assembly in a number of different industries. Motor vehicle and radio and television industries have about 30 percent of direct labor attributable to assembly. They note that a better indication of savings which comes from automating the assembly process is percent value of shipments due to assembler's pay. These figures are 4.7 percent for the motor vehicle industry and 3.8 percent for the radio and TV industries. Nevins and Whitney fail to take into account additional savings from automation due to increased organization, lower in-process inventory, lower personnel and paper work overhead costs, and higher efficiency. Boothroyd [33] has also studied the amount of labor and manufacturing costs attributable to assembly based on a 1967 census of manufacturers. He found that motor vehicle and telephone industries have about 50 percent of all production workers involved with assembly. Other industries such as motorcycle, aircraft, farm
machinery, and refrigerator and freezer have from 20 to 40 percent of labor involved in assembly. Boothroyd postulates that assembly accounts for about 50 percent of the total manufacturing cost for a product. The apparent large discrepancies between costs estimates of Boothroyd, Anderson. and Nevins and Whitney are most likely due to inaccuracies in estimation. comparison of just wages to all costs and other factors previously stated.
The Assembly Process
The most frequent assembly operations and part orientations during assembly were studied by Nevins and Whitney by examining ten products. They found that 33 percent of the assembly operations are peg in hole insertions, 27 percent are screw insertions and 12 percent are push and twist operations. Most other operations include multiple peg in hole, force fits, insert peg and retainer (all less than 10 percent), flip part, provide temporary support, remove temporary support, remove locating pin, weld or solder, and crimp sheet metal (all less than 3 percent). Most of the operations were unidirectional (e.g. 80 percent of all peg in hole insertions were from the same direction). Nevins and Whitney also cite surveys from General Motors and John Deere which deal with the average mass of a part which is handled during vehicle assembly. General Motors found that 90 percent of the parts in an average automobile are less than 2 kilograms (4.4 pounds) while John Deere reported that 80 percent of the parts in their farm equipment weighed less than 4 kilograms (8.8 pounds).
The Canonical Assembly Operation: Peg-in-Hole
Since it was found that peg in hole insertion dominated assembly tasks, researchers at the Draper Labs extensively researched the subject (104,132.1331 They studied clearance ratios (clearance/diameter) of close fits and found that similar types of parts had similar clearance ratios. Bearings had the smallest clearance ratios of the parts which were considered. Contact forces were analyzed and criterion for wedg-ing and jammwedg-ing of parts were formulated. The forces durwedg-ing the three stages of insertion namely chamfer crossing, one point contact and two point contact could be calculated as a function of offset of centers and insertion depth. Whitney and Nevins made a major breakthrough in the science of assembly with the
§2.1: Literature Review of Research in Programmable Assembly 31
ment of the remote center of compliance (RCC) t'204]. This is a passive device which is capable of providing a large degree of translational and rotational com-pliance in directions orthogonal to the direction of insertion while remaining stiff in the direction of insertion. In addition, the device locates the system's center of compliance at the bottom center of the peg being inserted. Thus the RCC is capable of apparently "pulling" the peg into the hole from the bottom. An instru-mented RCC has been developed which can be used as a teaching aid for a robot
by automatically finding the exact location of a hole or as a sensor for an active
control system for the robot. Whitney and Nevins have also done a number of studies on chamferless and compliant part insertion. Takeyasu, Goto and Inoyama
[187] report on the Hitachi Hi-T-Hand which is also able to do close tolerance peg in hole insertions using active feedback. However, this manipulator performs the task somewhat slower than the RCC.
Design and Classification of Robots
Because of their intrinsic flexibility, robots are often envisioned or utilized in pro-grammable automatic assembly stations. The literature contains a large range of opinions as to the optimal design for an assembly robot U66,131,159,187,194]. Since Japan possessed 69 percent of the industrial robots in operation in 1979 while the United States possessed only 16 percent (using similar definitions of robots) r66j. many of the studies on robots were done in Japan. McPherson [124]] discusses the history of robots in Japan as well as some current data on robots. He reports on JIRA's survey on reasons for the introduction of robots which showed labor sav-ings as being the most frequenly given response (44.5 percent). Other responses included improvement of working conditions (24.9 percent), versatility of produc-tion systems (13.5 percent), facilitaproduc-tion of management (8 percent), and 9.1 percent due to other reasons. JIRA also predicts that assembly robots will move from 10 percent of the robot market in 1980 to 17 percent in 1985 and 22 percent in 1990. JIRA's identifies 6 classifications of robots:
Manual Manipulator - A machine directly operated by a human.
Fixed Sequence - A machine which may be programmed for a particular task but whose repro-gramming ability is minimal.
Variable Sequence - Same as the fixed sequence robot but the machine's program is easily changed.
Chapter 2: Programmable Assembly Systems
Numerical Control - A machine which performs according to digital information oil sequence,
position, etc.
Intelligent Robot - This machine uses vision, sensors, etc. to determine position, action, rate,
etc.
Gevarter reviewed a number of other Japanese studies of robots in his report to NBS and NASA [66]. A 1981 survey of the uses of robots in Japan showed unloading and loading the most frequent at 40 percent. 21 percent of the robots in Japan were used for transfer and sorting, 9 percent for palletizing, 6 percent for welding, 4 percent for work maintenance, 3 percent for assembly, 2 percent for spraying, and other uses such as pouring, screwing, and riveting comprised 15 percent of the robots. The distribution of types of robots produced in Japan are: manual manipulators - 10 percent, fixed sequence - 67 percent, variable sequence - 7 percent, playback robots - 10 percent, NC robots - 5 percent and intelligent -1 percent. The results of a -1980 JIRA users survey of necessary research areas (in order of preference) is:
1. More degrees of freedom 2. More compact robots 3. Higher speed robots
4. A larger assortment of attachments 5. Easier reprogramming
6. Greater reliability
7. Increased working volume 8. Increased payload 9. Increased accuracy 10. Tactile sensing 11. Vision 12. Pattern recognition 13. Increased memory 14. Higher mobility
15. Coordinated control of multiple robots
A 1980 JIRA survey of current research areas of Japanese robot manufacturers shows .1 percent involved with increasing robot speed, .7 percent involved with making robots more compact, 8.6 percent with computer control, 8 percent with
§2.1: Literature Review of Research in Programmable Assembly
lighter weight robots, .7 percent with modular interchangeability. 5 percent with
object recognition, 4.6 percent with increased payload, 3.8 percent with improved actuators. 3.8 percent with self diagnosis, and 3.8 involved with adaptive control.
Still another JIRA study as reported by Yonemoto 207 of the distribution of robot sales to different industries reveals electric machine industry - 36 percent. automobile industry - 30 percent. plastics molding - 10 percent. metal working
industries - 5 percent, and metal working machinery industries - 4 percent.
Seering [168] contends that robots are presently designed to emulate humans and not designed to perform important assembly tasks. Mechanical manipulators should not be constrained to move at human speeds, carry human compatable payloads, work with the same precision, and have the same sensing capabilities of humans. This philosophy was adhered to in many aspects of this thesis.
Costs in Assembly Systems
In order for programmable assembly systems to be implemented in the industrial environment, they must prove to be more economic than conventional modes of assembly. According to Elbracht and Schaler !57 , the economics of programmable assembly may be compared to the economics of manual assembly by comparing the costs of necessary capital equipment versus the cost of labor. They note that an acceptable cost for automated equipment depends on both the number of shifts being considered as well as the country where the installation will occur. A num-ber of authors discuss methods for predicting the economic feasibility of flexible assembly systems. Boothroyd '31,33i and Dewhurst and Boothroyd [501 calculate per part costs versus volume per shift-year for a number of assembly systems. Systems which were considered are totally manual systems, manual systems with feeders, indexing type fixed automatic machines (all workpieces indexed simulta-neously), free transfer machines (buffers between each workhead), programmable workheads (robots), two arm programmable stations, and a universal assembly station consisting of two or more arms with programmable end effectors and pro-grammable feeders. He found that manual types of assembly are economic below about 35,000 units/shift-year, fixed automation assembly is economic above about 850,000 units/shift-year, and programmable assembly is economic between these production volumes. Boothroyd demonstrates that the volumes where the various modes of assembly become economic vary strongly as a function of number of
uct design changes per year, number of product styles to be produced, and number of different products to be produced. Nevins and Whitney predicted similar levels of production volume where the various modes of assembly become economic using somewhat different models 1132.133!. Their models for cost per assembly (finished unit) were based on payback period methods and are as follows:
Manual:
Cost/Assy = AssyTime/Part x LaborCo.st , Parts/Assy
Fixed automation:
Parts/Assy x MachCostl/Part PaybackPeriod x Volume
Programmable assembly:
Parts/Assy x StationPrice x Time' Part ToolingCost / Part PaybackPeriod Seconds/Year Volume
Depending on the payback period and labor costs, the results of analysis on 10 part units are: manual assembly is economic up to 100,000 units, programmable assembly is economic from 100,000 units to 2 million units and fixed automation is economic above 2 million units.
Benedetti discusses another method of calculating the most economic mode of assembly by optimizing a profitability condition with respect to some volume of production [211. This condition compares the costs involved with the purely manual operations to the costs of automated machine operation, automation machinery capital costs and the costs of manual intervention. Benedetti notes that this method is not based on discounted cash flow techniques and performs other analyses which are. From these models, he calculates the best method of assembly based on both cycle time and annual production volume assuming some rate of return and some utilization period. He also determines the amount of investments available for automation as a function of operator reduction.
To accurately predict the actual costs involved with the implementation of a flexible manufacturing system, any model used should be based on discounted cash flow techniques. The Boothroyd, and Nevins and Whitney models could be made more precise by taking into account the time value of money. None of the above economic models take into account the loss of business if automation is not Chapter 2: Programmable Assembly Systems
§2.1: Literature Review of Research in Programmable Assembly
pursued. In other words, companies which do decide to automate may attract a larger market share due to their increased flexibility and shorter delivery time. Companies which do not automate may find their share of business taken over by a more productive company using flexible automation. Another concern when considering the economic feasibility for a newly automated system as cited by Elbracht and Schaler i57; is the fact that automated equipment costs are presently rising at a slower rate than labor costs.
Design for Assembly
Assembly research involving the programmable automatic assembly of parts which were designed to be manually assembled without redesign have shown that system implementation is both uneconomic and difficult [84,119,132,181'. These findings imply that design or redesign of parts for programmable assembly is extremely important if a newly designed system is to succeed economically. Boothroyd has documented methods to improve designs for ease of assembly 131.33'. He suggests:
1. Reduce number of parts. 2. Unidirectional assembly.
3. Chanifer insertion interfaces. 4. Make parts locatable. 5. Use a base part. 6. Layered assembly.
7. Simple fastening operations.
Other authors [51,109,123] suggest additional methods for improving designs for assembly such as good interfacing between base part and fixtures, logical assembly order, designing for facilitation of inspection, keeping tight part tolerances or using a passive remote center of compliance, designing parts with a low center of gravity for stability, protecting fragile surfaces, providing a suitable gripper and feed track surface, and avoiding or not using separate fasteners.
Boothroyd et al. [32,331 and others [11,51,109] also suggest improvements of de-signs to facilitate automatic feeding including dede-signs which decrease the likelihood of part tangling and hooking, maximize part symmetry or exaggerate asymmetry, have smooth surface finishes for feeding, use special orienting faces, use high qual-ity components, have part geometries which fit into magazines, and designs which use preoriented parts on tapes. Lewis also suggests a clean assembly environment to avoid feeder jams [109].
A number of authors make a point of looking at each part and making sure that
given design with respect to the minimum number of parts and minimum handling and assembly time. Design efficiency is defined as:
Theor. .Ilin - Parts x (Nom.HandleTime Nom.AssembleTime)V-
ActualAssembleTime
Boothroyd has designed a system which will help the designer increase the efficiency of a design and predict the costs and the amount of time necessary for assembly. The system classifies each part in an assembly with two digits the first of which quantifies the amount of symmetry and ease of grasp. The second digit is based on the mode of insertion or fastening. The technique was designed with manual assembly in mind but may also be used for programmable automated assembly.
Andreasen [11] classifies the different types of assembly structures as being frame, staked (some components hold others), composite product (different mate-rials), base component (base for transport and assembly), modules, and building block. Djupmark [51] rates a number of fastening techniques with respect to ease of implementation in an automatic assembly workhead (from simplest to most dif-ficult):
1. Pressing 2. Snap joints 3. Lap joints 4. Baking in 5. Welding 6. Riveting 7. Screws 8. Pins and Rings 9. Crimping 10. Soldering
11. Gluing
The above list is machine dependent and is most likely not accurate for new machine designs.
Techniques which may reduce the cost of programmable assembly automation as cited by Redford [159] include increasing the speed of robots (although it is likely that less than an order of magnitude increase is possible), use of limited capability and inexpensive robots, versatile, inexpensive grippers (using more than one gripper on a robot arm, designing a programmable gripper, designing parts to minimize gripper change or assembling a number of assemblies at a time to minimize gripper changes), identification of assembly families, and lower feeding costs.
§2.1: Literature Review of Research in Programmable Assembly
Parts Feeding
Redford analyzes a number of different types of feeders with respect to cost of implementation in a programmable assembly center A159,160). The types of feeders considered were:
1. Dedicated (bowl feeders).
2. Multi-part (5 parts, 1 drive, different orienting tracks).
3. Programmable.
4. Dedicated feeders serving more than 1 robot.
5. Feeders with vision.
6. Magazine systems (better utilization of feeders, secondary inspection before assy).
(a). Manually Loaded. (b). dedicated feeders.
(c). Multi-part feeders. (d). programmable feeders.
(e). Loaded by prior manufacturing operation.
7. Manually loaded feed tracks.
Feeding costs depend oni:
1. Material handling cost. 2. System tending cost.
3. Fault correction cost. 4. Change over cost.
5. Equipment depreciation cost. 6. Tooling depreciation cost.
The results of Redford's feeder cost analysis were based on a study of two product families with volumes of 200,000 units per year. One family consisted of 66 product types and the other consisted of 20 part types. Variable batch sizes were considered from 50 to 4350 units. Results showed that all systems except magazines loaded from prior manufacturing operations exhibited dramatic cost increases at batch sizes below 450 units. All cost versus batch size curves were parallel at higher volumes (independent of batch size). Multi-part feeders, feeders with vision, and magazines loaded at prior manufacturing operations were the most economic feeding techniques. Manual loading of robots was more economic than programmable or dedicated feeding. It was suggested that a mix of different feeder types is probably best.
Conventional bowl feeders were examined by Boothroyd 132,331 who determined the variables responsible for feed rate. Feed rate is a function of orienting efficiency (dependent upon the number of natural resting states of a part) and track conveying
![Figure 2.3: Parameters for the two-dimensional peg in hole assembly (from [201]).](https://thumb-eu.123doks.com/thumbv2/123doknet/14128503.468745/49.918.336.647.185.571/figure-parameters-dimensional-peg-hole-assembly.webp)