Publisher’s version / Version de l'éditeur:
Vous avez des questions? Nous pouvons vous aider. Pour communiquer directement avec un auteur, consultez la première page de la revue dans laquelle son article a été publié afin de trouver ses coordonnées. Si vous n’arrivez pas à les repérer, communiquez avec nous à PublicationsArchive-ArchivesPublications@nrc-cnrc.gc.ca.
Questions? Contact the NRC Publications Archive team at
PublicationsArchive-ArchivesPublications@nrc-cnrc.gc.ca. If you wish to email the authors directly, please see the first page of the publication for their contact information.
https://publications-cnrc.canada.ca/fra/droits
L’accès à ce site Web et l’utilisation de son contenu sont assujettis aux conditions présentées dans le site LISEZ CES CONDITIONS ATTENTIVEMENT AVANT D’UTILISER CE SITE WEB.
Proceedings of Acoustics '08: 29 June 2008, Paris, France, pp. 1-5, 2008-06-29
READ THESE TERMS AND CONDITIONS CAREFULLY BEFORE USING THIS WEBSITE.
https://nrc-publications.canada.ca/eng/copyright
NRC Publications Archive Record / Notice des Archives des publications du CNRC :
https://nrc-publications.canada.ca/eng/view/object/?id=856a0fc0-0c7a-4e22-995c-b0890f03848f
https://publications-cnrc.canada.ca/fra/voir/objet/?id=856a0fc0-0c7a-4e22-995c-b0890f03848f
NRC Publications Archive
Archives des publications du CNRC
This publication could be one of several versions: author’s original, accepted manuscript or the publisher’s version. / La version de cette publication peut être l’une des suivantes : la version prépublication de l’auteur, la version acceptée du manuscrit ou la version de l’éditeur.
Access and use of this website and the material on it are subject to the Terms and Conditions set forth at
Impedance of standard impact sources and their affect on impact
sound pressure level of floors
http://www.nrc-cnrc.gc.ca/irc
I m pe da nc e of st a nda rd im pa c t sourc e s a nd t he ir a ffe c t on im pa c t
sound pre ssure le ve l of floors
N R C C - 5 0 4 4 9
Z e i t l e r , B . ; N i g h t i n g a l e , T . R . T .
J u n e 2 0 0 8
A version of this document is published in / Une version de ce document se trouve dans:
Proceedings of Acoustics'08, Paris, France, June 29-July 4, 2008, pp. 1-5
The material in this document is covered by the provisions of the Copyright Act, by Canadian laws, policies, regulations and international agreements. Such provisions serve to identify the information source and, in specific instances, to prohibit reproduction of materials without written permission. For more information visit http://laws.justice.gc.ca/en/showtdm/cs/C-42
Les renseignements dans ce document sont protégés par la Loi sur le droit d'auteur, par les lois, les politiques et les règlements du Canada et des accords internationaux. Ces dispositions permettent d'identifier la source de l'information et, dans certains cas, d'interdire la copie de documents sans permission écrite. Pour obtenir de plus amples renseignements : http://lois.justice.gc.ca/fr/showtdm/cs/C-42
Impedance of standard impact sources and their effect
on impact sound pressure level of floors
B. Zeitler and T. Nightingale
NRC - Institute for Research in Construction, 1200 Montreal Road, Building M-27, Ottawa,
ON K1A 0R6, Canada
This paper reports on a systematic study of the Impact Sound Pressure Level (ISPL) due to different standard sources (ISO tapping machine, Ball, and ”Bang Machine”) when applied to a wood-joist floor-ceiling construction with and without a floor topping. Measurement data show that for each floor, the ISPL was different for each source. Not surprising since the blocked force for each source is different. But, after applying corrections for the applied force the ISPL’s remain different, suggesting problems since the sources simulate the same human walking activity. Perhaps more importantly, the rank of assembly effectiveness (which is simply the difference in ISPL between reference and other assembly) was different for the three sources. Measurements of the drive point impedance of sources and floors are presented to explain this behaviour and to recognise that the power injected is not just related to the applied force, but also a function the impedance match (or miss-match) between the source and floor. Using a simple model, it is possible to correctly rank the effectiveness of floor assemblies using predicted ISPL for any source, if the forces and impedances are known.
1
Introduction
One of the broader goals of this research is to predict the Impact Sound Pressure Level (ISPL) of one standard impact source from another (ISO tapping machine, Ball, and Bang Machine). For this, the floor must be characterized independent of the source. Accomplishing this would increase the understanding of how power gets injected into the floor system, reduce the time needed for measurements (only one source instead of three), and simplify the implementation of codes. The goal of this paper is to evaluate 3 methods to predict the ISPL and rank floors assemblies correctly from one source to another. This paper concentrates on predicting the ISPL of the Bang Machine, which produces very high force levels, unlike those of a foot. These are believed to cause non-reversible damage to the floors [1,2] and believed to cause non-linear reactions of the floor.
The ISPL of the Bang Machine will be predicted from the ISO tapping machine and Ball using three approaches. First, all sources will be assumed to inject the same amount of power into the floor. Second, the injected power will be dependent on the blocked force of the sources. Third, the injected power will be dependent on blocked force and impedance of sources and floors.
The procedure of prediction will be demonstrated for the Bang Machine using data from the reference floor assembly and finally the ranking of Single Number Ratings (SNR) will be presented for five floor assemblies using the Japanese and Korean Standards.
Measurements were made in NRC's flanking facilities, which has four upper and four lower rooms. Direct and flanking sound transmission was measured, however only the direct sound transmission is investigated in this paper. The direct sound transmission from the upper source room to the room directly below is isolated from the flanking by shielding all the walls in the lower room [3].
2
Description of floor-ceiling
assemblies and impact sources
This section describes the floor-ceiling assemblies and standard sources used.
2.1 Floor-ceiling assemblies
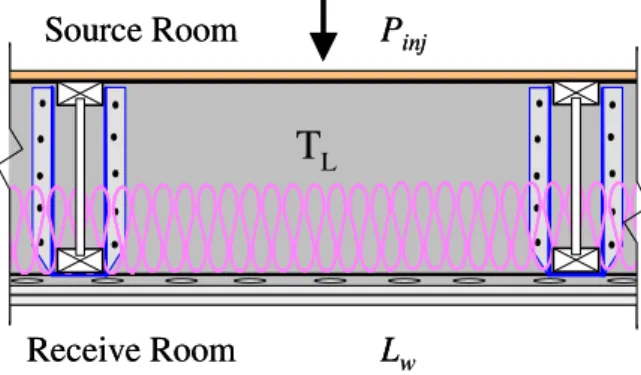
This paper considers the five platform wood frame constructions – a reference assembly (Case 1A, shown in Figure 1) and four variants (Cases 1B, 1C, 1E and 1F).
P
injT
LL
wSource Room
Receive Room
P
injT
LL
wSource Room
Receive Room
Figure 1: Case 1A: Reference floor assembly with nomenclature.
Two variants assessed treatments to the mounting of the gypsum board (Cases 1B and 1C), one assessed the stiffening the floor (Case 1E) and one assessed treatment to the exposed floor surface in the form of floor topping placed on an interlayer (Case 1F). All the floors had a sub-floor of 19 mm oriented strand board (OSB) screwed to the top of the 305 mm wood-I joists, 150 mm thick insulation between the joists, and a double layer of 16 mm gypsum board supported below the joists. A more detailed description with diagrams can be found in [2].
2.2 Sources
The three standard sources are a rigid light source, the ISO tapping machine (ISO), and two heavy soft sources, the Ball, and Bang Machine (Tire). These are shown in Figure 2. The ISO tapping machine is actually five 500g steel hammers that drop from 4cm at a total rate of 10 drops per second (2Hz per hammer). The Ball is made of a rubber shell around an air volume, and is dropped from 1 meter height. The Tire is a small car tire calibrated via its air pressure and dropped from a height of 0.85 meters. The sources are described in the two standards JIS A 1418-2 and KS F 2810-2.
The ISO sources produce steady state noise whereas the soft heavy impactors produce transient noise. This means that their signals need to be measured differently. The soft heavy impactors are measured with fast exponential time weighting as peak signals whereas the ISO tapping machine noise is measured with linear time weighting as rms signals.
Figure 2: Standard impact sources, (from right to left) the ISO tapping machine, the Ball with a one-meter stick on it
(dropping height) and the Bang Machine.
3
Prediction Procedure
As mentioned in the introduction, characterizing the floor independent of the source is very beneficial. The following simple power equilibrium will assist in doing so. A force applied to the floor through the sources (see Figure 1), injects power Pinj into the floor system. A portion of this
power reaches the receive room directly below via the ceiling Lw. The other part can, when dealing with direct
transmission, be seen as the total power impact transmission loss TL of the floor assembly. This includes
power transmitted via flanking paths to other rooms and damping.
w L inj
T
L
P
+
=
(1)To, for example, predict the ISPL of the Tire from the Ball, the TL(Ball) using data from the ball needs to be calculated by
TL(Ball) = Lw(Ball) – Pinj (Ball), and to that the injected power of
Tire be added (Lw(Tire) = TL(Ball)+Pinj(Tire)). The more
accurately the injected power and sound power in the room are estimated, the better the calculated TL and resulting
predicted Lw will be. Actually, only the source dependent
terms of the injected power need to be included in the value of injected power to get a good estimate of the TL, because
independent terms will be added again from the power injected by the other source (and will cancel out).
To then predict the room absorption corrected Lp and SNR
of the standards the relationship between Lw and the Lp
needs to be determined.
The rms Lp levels of the ISO tapping machine are corrected
for effective room absorption area A, as the standard requires measurement away from any room surfaces and for locations beyond the reverberation radius. Thereby, the levels Lp(rms) describe the sound power Lw in the receive
room quite well (Lw = Lp + 10 log A/4 dB).
The peak levels measured for the Ball and Tire are independent of the room properties (implicit to Standards that do not apply a room absorption correction), and are therefore also assumed to represent the sound power levels in the room sufficiently.
This paper will use TL normalized to the Tire for
comparisons. When looking at these dB differences please note that the differences are the same as those for the predicted Lp, because to all of the curves the same power
injected of the Tire Pinj would be added to obtain the
predicted Lp.
4
Direct impact sound pressure levels
Measured 1/3 octave band impact SPLs in the receive room directly below the source room (see Figure 3) have different trends for the ISO tapping machine than for the Ball and Tire, which are very high in the low frequency range. The Tire always has higher levels than the Ball. The ISO tapping machine has the lowest levels at the low frequencies, and crosses the other two curves twice, first around 125 Hz and again around 2 kHz. This difference at the low frequencies is due to the different levels of blocked force between sources, as shown later.
25 35 45 55 65 75 85 95 63 125 250 500 1k 2k 4k Frequency, Hz Im p a c t SPL , d B Tire (peak) Li,Fmax,AW 68 LH 72 Ball (peak) Li,Fmax,AW 60 LH 63 Iso hammer (rms) Li,Fmax,AW 62 LH 65
Direct ISPL Case 1A
-60 -50 -40 -30 -20 -10 0 10 63 125 250 500 1k 2k 4k Frequency, Hz Δ Im p a c t SPL r e l. to T ir e , d B Iso hammer (rms) Ball (peak) Tire (peak)
Predicted ΔISPL: no correction
Figure 3: Direct impact sound pressure levels for Case 1A - simple wood joist floor for the three standard sources (ISO
tapping machine, Ball, and Tire). The upper graph shows absolute ISPL, lower shows change relative to Tire’s ISPL.
If the power injected by all sources is the same Pinj(ISO)
=Pinj(Ball)= Pinj(Tire), then the curves in the lower graph
showing the TL or predicted levels relative to those of the
Tire, should all align. Figure 3 shows that assuming all sources inject the same amount of power into the floor is a very crude estimate. The differences in frequency content suggests they are simulating different foot impacts – some with more stomping or jumping than walking.
In the next section the assumption for the power injected will be improved to get more of the source dependent influence out of the TL values by introducing a blocked
force correction.
5
Blocked force correction
The crude assumption (that the power injected from all sources is the same) will be improved now by including a blocked force correction term, Pinj(source) = F02(source).
The blocked force F0 of the three sources was measured by
dropping each impact source from its standard height on a force plate (RION FP-10), which was placed on a very rigid floor of high impedance. An average of ten drops was made. Again, the ISO tapping machine data was captured as linear rms and the Ball and Tire as fast peak signals. A single ISO hammer was dropped within a time window of 2 sec.. The rms value of five hammers dropping in total ten times per second was calculated from this.
Unfortunately, the force plate has its resonance frequency (zeroth radial mode) at around 1600 Hz. This error was minimized by only using differences in force levels. The error of the mode being excited slightly differently by the different sources of hard small contact area verses large soft contact area still exists.
The force of the ISO tapping machine has a more uniform characteristic (“white”), whereas the Ball and Tire are high at low frequencies and drop at higher frequencies. The differences of the blocked force of the sources relative to the Tire can be seen in the upper graph of Figure 4. The force of the Ball and Tire are more similar to one another, usually within 10 dB, whereas the ISO tapping machine force is 30dB higher in the high frequency range.
-30 -20 -10 0 10 20 30 40 63 125 250 500 1k 2k 4k Frequency, Hz Δ B locked For ce F0 nor m . t o Ti re , dB Iso hammer (rms) Ball (peak) Tire (peak)
Relative force of impact sources
-60 -50 -40 -30 -20 -10 0 10 63 125 250 500 1k 2k 4k Frequency, Hz For ce cor rect ed Δ Im p a c t SPL r e l. to T ir e , d B Iso hammer (rms) Ball (peak) Tire (peak)
Predicted ΔISPL: Force corrected
Figure 4 Force correction factors and applied force correction to ISPL normalized to Tire.
The improved predictions for the Ball and the ISO tapping machine relative to the Tire can be seen in the lower graph of Figure 4. The prediction is improved in the low frequency range relative to the data without force correction (see Figure 3 lower graph) but becomes much worse in the high frequency range.
6
Impedance correction
Assuming the source dependant part of the injected power is dependent not only on the blocked force, but also on impedance of the source and floor, can improve the prediction. An estimate of the power injected into a system
can be calculated readily using an electrical analogy. This however assumes point contact areas, which is not the case for the heavy soft impactors. The contact area and impedance changes over time and the signals are transient, but we will assume for now that the influence is minimal.
6.1 Electric analogy
F0 Ff v Zs Zf F0 Ff v Zs ZfFigure 5: Electric analogy circuit of source floor interaction.
Figure 8 shows the circuit describing the relation between source and floor. Zs and Zf are the impedance of the source
and floor, respectively, v the velocity of both source and floor during contact, and Ff and F0 the force exerted on the
floor and the blocked force respectively. Such a analogy was also investigated by Theodore Schultz in [4]. The blocked force measured previously on a surface of high impedance Zf, leads to no velocity v and therefore Ff = F0
the blocked force.
The power injected into the floor is
2 2 0 2 1
Re(
)
f s f injZ
Z
Z
F
P
+
=
, (2)with Re(Zf) being the real part of the floor impedance. To
optimize a floor it is necessary to minimize the power injected into the floor system, thereby stopping the sound transmission as close to the source as possible. This is beneficial for both direct and flanking transmission. Because the sources are defined in the standards, the only parameter (of Eq.(2)) that can be adjusted is the floor impedance. Unfortunately, this function only has a local maximum for the maximised injected power and not for minimized power. Maximum power injected occurs when
* s f
Z
Z
=
. (3) It is obvious from Eq.(2) that the best approach is to modify the floor so there is first a very small real part and second the floor impedance is as far away from the complex conjugate of the source impedance as possible.6.2 Impedance measurements
This section describes the measurement of the impedance required for the last power injection formulation. A shaker with impedance head (see Figure 6) was used to measure the impedance of the sources and floors. The impedance head was screwed to a 19x19mm aluminium tab that was glued to the specimens. The heavy soft impactors were
suspended. The theoretical impedance value of the hammer (
Z
=
j
ω
m
) was used in the calculations, where m is the mass and j the square root of (–1) and ω the angular frequency.Figure 6: Setup for impedance measurement of ball. The sources and floors were excited with white noise and the force and acceleration at contact point were recorded. From these the impedance was calculated taking into account the added mass load of the tab and connection screws. This way the impedance was averaged over 30 seconds and averaged over the tab contact area. Figure 7 shows the results.
Figure 7 also shows the measured impedance of the three floor assemblies for which the impedance changed the most (They are Case 1A, 1E, and 1F). Changing the ceiling attachment Case 1A, B, and C has little influence on the floor impedance. 25 35 45 55 65 75 85 95 63 125 250 500 1k 2k 4k Frequency, Hz Im pedance M a gni tude | Z |, dB Iso hammer Ball Tire Case 1E (Stiffened) Case 1F (Topping) Case 1A (Reference) Magnetude of Impedance -100 -80 -60 -40 -20 0 20 40 60 80 100 63 125 250 500 1k 2k 4k Frequency, Hz Im pedance P h ase angl e( Z) , deg Iso hammer Ball Tire Case 1E (Stiffened) Case 1F (Topping) Case 1A (Reference) Phase of Impedance
Figure 7: Impedance of sources and floors: upper graph -Magnitude in dB (ref. 1Ns/m), lower graph - phase in deg. Firstly looking at the magnitude, the impedances of the floors are approximately 20dB higher than those of the heavy soft sources until 1kHz where the trend of the heavy soft sources curves change. The magnitude of impedance of the ISO tapping machine, being all mass driven, passes that of the floors at around 500Hz. The Ball and Tire have a dip in magnitude in the mid frequency range and get closer to
the range of the floor impedance at higher frequencies. The stiffened floor, Case 1E, has the highest impedance at low frequencies and the one with the topping on interlayer, Case 1F, the lowest.
Looking at the phase (Figure 7 lower graph) shows all floors are stiffness controlled (negative phase). The bounding limits are
±
90 deg, because a negative real part is not physical. That Case 1E is the most stiffened can be seen as it has the phase closest to –90deg in the low frequencies and Case 1F (with topping) is the most mass driven (largest phase). The ISO tapping machine is obviously all mass driven and the Ball And Tire seem to have a resonance at around 500Hz where they switch from stiffness to mass driven.6.3 Impedance correction results
The force correction term of the power injection correction has already been accounted for. Therefore the rest, the impedance term from Eq.(2) will now be expanded.
-70 -65 -60 -55 -50 -45 -40 -35 -30 -25 -20 63 125 250 500 1k 2k 4k Frequency, Hz Im pedance cor rect ion f act or e Z_cor r, dB Iso hammer Ball Tire Impedance correction
Figure 8 Magnitude of Impedance correction of sources in dB (ref 1 Ns/m).
As mentioned previously the maximum power injected occurs when the impedance of the floor is the same as the complex conjugate of the source. Seeing how the floor impedance is stiffness driven and the soft heavy impactors switch from stiffness to mass driven going from low to high frequencies, the power injected due to impedance match gets higher; especially, at higher frequencies, where the magnitudes between source and floor become more similar as well. In the high frequency range the source and floor impedances are almost the complex conjugate of one another leading to the highest power injected.
The correction for the Ball and Tire are very similar (see Figure 8), because their impedances are very similar relative to the floor impedance. The impedance correction factors at the lower frequencies are very small. This is because the power injected indirectly includes the actual force Ff calculated from the blocked force and impedances
applied to the floor. In the low frequencies it is the same as the blocked force, because the floors there have a much higher impedance than the sources (Ff= F0).
Adding these impedance corrections to the force corrections leads to the curves in Figure 9. Comparing these to the ones with only the force correction in Figure 4 shows that the prediction improves at the higher frequencies.
-60 -50 -40 -30 -20 -10 0 10 63 125 250 500 1k 2k 4k Frequency, Hz Pr e d ic te d Im p a c t SPL n o rm a liz e d to T ir e , d B Iso hammer (rms) Ball (peak) Tire (peak)
Predicted ΔISPL: Force and impedance corrected
Figure 9 Predicted ISPL of tire normalized to Tire.
The Ball in general is better for predicting the ISPL of the Tire for the basic wood joist floor. Using the Ball data however over-predicts, whereas using the ISO tapping machine data under-predicts the ISPL in the low frequencies where the SNR is influenced most.
7
Ranking of Single Number Ratings
Predictions of the Tire ISPL were carried out for all of the five floor assemblies. The resulting SNRs can be seen in Table 1 for both the Japanese and Korean ratings (JIS A 1419-2 and KS F 2863-2 respectively).
Iso Ham Ball Iso Ham Ball Case 1A 72 69 74 68 64 68
Case 1B 71 70 72 69 64 67
Case 1C 70 69 72 65 64 66
Case 1E 69 70 72 64 64 66
Case 1F 62 59 65 56 53 60
Iso Ham Ball Iso Ham Ball
Case 1A 0 0 0 0 0 0 Case 1B 1 -1 2 -1 0 1 Case 1C 2 0 2 3 0 2 Case 1E 3 -1 2 4 0 2 Case 1F 10 10 9 12 11 8 Predicted from Japan Meas. Korea Meas. Predicted from
Japan Korea
Meas. Predicted from Meas. Predicted from
Table 1 Measured and predicted SNR scheme of the Tire for both countries (Li,Fmax,r,H for Japan, and L’i,Fmax,AW,H for
Korea), Upper table – absolute, lower table – rel to Case 1A The predicted SNR from the Ball are over estimated for all Cases, whereas from the ISO they are underestimated. For both Ball and ISO the predicted SNRs show less change between the Cases 1A, 1B, and 1C, in which only the ceiling attachment was changed, than actually measured. The trends and ranking of the SNRs are however very similar to the measured values. Adding the topping in Case 1F is seen as the greatest floor improvement by measured and predicted SNR for both countries.
8
Conclusion
Introducing the blocked force component into the power injection assumption improves the prediction of ISPL from one source to another in the low frequency range relative to the assumption of the same power injected by all sources. Including the impedance component improves the prediction of the ISPL from one source to another in the
higher frequency range. However, there is still room for improvement.
Some assumptions may not hold true, and their influence needs to be investigated further, such as the assumption that the peak sound pressure levels represent the sound power levels. However this seems to have little influence, because estimates from the Ball (also using peak levels) give errors similar to those when using the ISO tapping machine. Another difficulty is measuring the “correct” impedance of the sources - the actual impedance of the source and floor during impact. The contact areas are not square like the aluminum tabs and change over time of impact. The impedance is also a function of time, and the averages made over the square aluminum tab and the time might not be sufficient. Also measuring the impedance, especially of the Ball and Tire, with a steady state signal could be introducing errors. Steady state excitation may excite modes of the sources, which are not excited by the short impulse of collision, or at least not fully developed before the source has lost contact to the floor. Measuring the impedance with an impedance hammer will be investigated next.
There is also indication that the floor-ceiling system reacts non-linearly to Tire impact, which is inconsistent with all of the assumptions made. Investigations to clarify this are ongoing.
A first step has been achieved in characterizing the impact
TL of the floor for an impact source independent of the
source itself, and predicting the ISPL from one source to the next.
Acknowledgments
The support of the Council of Forest Industries through the Canada Wood and Forestry Innovation Initiative Programs is gratefully acknowledged.
References
[1] Jin Yong Jeon, Jong Kwan, Ryu, Joeng Ho Jeong, Hideki Tachibana, “Review of the impact ball in evaluating floor impact sound”, Acta Acustica united with Acustica, Vol. 92 (2006) pp. 777-786.
[2] Zeitler, B., Nightingale, T.R.T., “Methods to control low frequency impact noise in wood-frame construction, Proceedings of Acoustics’08.
[3] Nightingale, T.R.T.; Quirt, J.D.; King, F.; Halliwell, R.E. Flanking Transmission in Multi-Family Dwellings: Phase IV, Research Report, Institute for Research in Construction, National Research Council Canada, 218, pp. 425, March 01, 2006 ( http://irc.nrc-cnrc.gc.ca/pubs/rr/rr218/).
[4] Schultz, T., ”Alternative test method for evaluating impact noise, J. Acoust. Soc. Am. 60, 645 (1976).