C E N T R E D'E T U D E S E T D E R E C H E R C H E S S U R L E D E V E L O P P E M E N T I N T E R N A T I O N A L
Document de travail de la série Etudes et Documents
E 2011.28
Are grain markets in Niger driven by speculation?
Catherine Araujo Bonjean Catherine Simonet
2nd version Septembre 2011
C E R D I
65 BD.F. MITTERR AND
63000 CLERMONT FERR AND - FRANC E TEL.0473177400
FAX 0473177428
Les auteurs
Catherine Araujo Bonjean
CNRS Researcher, Clermont Université, Université d'Auvergne, CNRS, UMR 6587, Centre d’Etudes et de Recherches sur le Développement International (CERDI), F-63009 Clermont-Ferrand, France Email : [email protected]
Catherine Simonet
PhD student, Clermont Université, Université d’Auvergne, CNRS, UMR 6587, Centre d’Etudes et de Recherches sur le Développement International (CERDI), F-63009 Clermont-Ferrand, France
Email : [email protected]
Corresponding author: [email protected]
La série des Etudes et Documents du CERDI est consultable sur le site : http://www.cerdi.org/ed
Directeur de la publication : Patrick Plane
Directeur de la rédaction : Catherine Araujo Bonjean Responsable d’édition : Annie Cohade
ISSN : 2114-7957
Avertissement :
Les commentaires et analyses développés n’engagent que leurs auteurs qui restent seuls responsables des erreurs et insuffisances.
Abstract
Over the last two decades, millet prices in Niger have enjoyed periods of spectacular increase during which they seem to go well above their fundamental value. These episodes of price bursts followed by rapid reversals could be attributed to the presence of rational speculative bubbles. Considering millet as a food asset we have developed a pricing model, and tested for the presence of periodically and partially collapsing bubbles for 15 millet markets in Niger. The test strategy consists of estimating the fundamental value of millet and investigating the dynamic properties of price deviations from fundamentals. A battery of unit root tests aimed at controlling for skewness and kurtosis, and for non linearity in the bubble process, is implemented. These tests do not reject the presence of rational bubbles for some of the sample markets, and allow the identification of expanding and collapsing phases in bubble processes. The results show that small markets, located in deficit and remote areas are more prone to speculation than large markets in the main producing and consuming regions.
Key word: periodically collapsing bubbles, M-TAR, Markov switching ADF, Residual
Augmented ADF test, Rolling ADF test, millet, Niger
Introduction
Over the past 20 years, grain markets in Niger have experienced numerous large positive price shocks followed by rapid reversals. These shocks, whose duration is typically less than one year, are transitory, but constitute a threat to poor households which are dependent on markets for food security. Indeed, these periods of price spikes sometimes lead to severe food crises, as was the case in Niger in 2005.
Recurrent episodes of high local food grain prices are mostly related to a rainfall shock and a deficit in domestic production. However, the extent of the food deficit and the price increase are not closely related. This may be due to the difficulty of measuring grain production. Millet is produced by numerous small farms scattered throughout the country, and production is poorly recorded. In fact, production data are revised several times during the growing season and corrected several months after the harvest. Measurement errors may therefore explain the low correlation between prices and production.
Non-competitive markets may also explain the apparent discrepancies between prices and food availability. In developing countries, traders are often considered as responsible for grain price increases. They are blamed for taking advantage of their monopsony power, and for speculative stockholding. However, another explanation can be found in Sen’s work on the origin of famines when there is no decline in food availability. For instance, Ravallion (1985) showed that the 1974 famine in Bangladesh cannot be explained by a rice production deficit, but by stockholders’ over-optimistic price expectations. Such market “irrational exuberance” has been shown for stock markets, but few works aim at studying this phenomenon on commodity markets in developing countries.
The presence of rational speculative bubbles can explain the dramatic price increases followed by a sudden reversal that have been observed at different periods of time in the grain markets of Niger. It may also explain why the early warning system for preventing food crises, which is mainly based on the monitoring of crop growth, has not been effective in anticipating steep rises in prices despite technological advances that allow more accurate monitoring of harvests.
Rational speculative bubbles result from a self-fulfilling belief based on intrinsically irrelevant information that is not related to market fundamentals (Diba and Grossman, 1988). For instance, if the economic actors anticipate an increase in grain price whereas these
moving the price away from its intrinsic value. A rational bubble is consistent with the efficient market hypothesis and the no arbitrage condition. It can be derived from a basic asset pricing model assuming competitive markets and rational expectations with no informational asymmetries. Agents know that the asset is overvalued, but they are prepared to pay more for the asset than its intrinsic value if they expect to sell it at an even higher price. The bubble increases at the required rate of return and bursts when agents’ expectations return to normal.
In Niger, investors in the grain market operate in a highly uncertain environment that is likely to favour self-fulfilling beliefs. Information on the climatic and agronomic conditions of crops, and on economic variables, is generally very poor. Moreover interventions of the government and external aid agencies in case of food risk are often unpredictable. As a result, incomplete or unreliable information provided by the public authorities may fuel speculative bubbles.
Rational speculative bubbles are difficult to detect but there is now an abundant literature which aims to test for the existence of rational bubbles on stock markets. In this paper, we consider millet as a food asset that can be held for long periods. Using a model for a storable good we show that, like other financial assets, the price of millet depends on a fundamental component and a potential rational bubble. Following Evans (1991) we consider a specific class of rational bubbles i.e. periodically and partially collapsing speculative bubbles (PCB). PCBs are non linear processes; they are explosive during the phase of bubble eruption, but they may be stationary over the whole sample period. To test for the presence of such bubbles our empirical strategy consists first in estimating the bubble component of prices - taken as the difference between the millet market price and its fundamental value. Then, we explore the statistical properties of bubbles. First, we use the residual augmented least squares Dickey-Fuller test to correct for skewness and kurtosis. Second, we test for asymmetry in the bubble process by using non linear unit rot tests based on a M-TAR model and on a Markov switching model. Third, rolling ADF tests are conducted to detect explosiveness in bubble dynamics. The results do not reject the presence of rational bubbles on 9 markets among the 15 markets under study, but reject the presence of bubbles on the main markets of Niger.
The paper is organized in the following manner. Section 1 outlines the main characteristics of millet prices during the last two decades. Section 2 presents the rational bubble model for millet, and the theoretical characteristics of bubbles. The fundamental value of millet is estimated in Section 3. Section 4 is devoted to the non linear unit root test. Section 5 covers the rolling ADF tests. Section 6 offers conclusions.
1. Millet price fluctuations in Niger since 1990
In Niger millet is the staple diet of the local population, and the main food crop. It covers 65 % of cultivated land and represents about ¾ of cereal production (IRD, 2009). This is the most suitable crop for the arid and semi-arid areas of Niger. It is a rain fed crop cultivated by small traditional farmers using low input agricultural practices. As a consequence, millet production is highly vulnerable to pest attacks and weather conditions.
Millet can be stored for more than one year. Three categories of agents hold stocks: farmers, wholesalers and the public authorities. Most grain is stored at the farm level, but these stocks are difficult to assess. As a general rule, stocks are built up during the harvest season and held for at least one year. They are intended to cover the household’s food needs until the next harvest, and meet the farm’s demand for seeds. However, many farmers with low production levels are net buyers of grain. Their production may not be sufficient to cover their food needs, or they may be forced to sell millet early in the crop marketing season to meet their cash needs. Wholesalers hold stocks over short periods, generally not exceeding two months, with the result that the rate of stock turnover is high (Aker, 2010). Public safety stocks are renewed by tender during the first months of the year1.
The production cycle generates large seasonal price fluctuations. Millet prices are lower during the harvest and post-harvest season from September to January. Then they gradually go up and reach their peak at the end of the lean season2 from July to September. The amplitude of the seasonal movement in prices is particularly big in Niger where prices rise on average by 40% between January and August.
Millet is the subject of intensive cross-border trade in West Africa, but it is not traded on international markets. Niger is structurally an importer of millet. Its main source of imports is Nigeria, but imports from Mali and Burkina Faso have been expanding during the last decade. Because weather conditions are similar within the countries of the sub-region, trans-border trade does not really play a regulating role. The dampening effect of trade on prices is weak, and millet prices are subject to large variations from one year to the next.
1
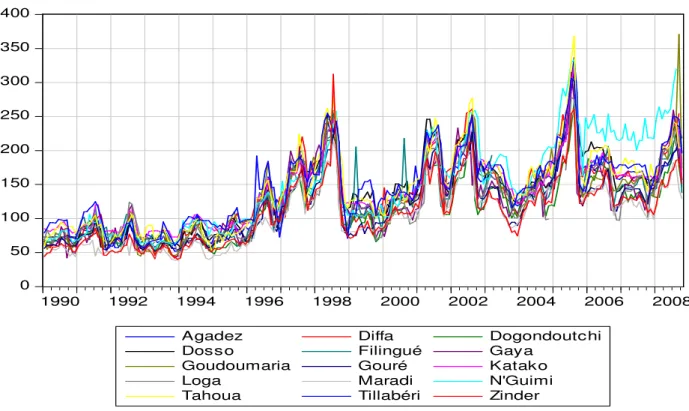
Figure 1. Millet prices in Niger, Fcfa/kg, January 1990 to October 2008
Source: SIMA
A market information system (SIMA) was implemented in Niger at the end of the 1980s that collects market prices for major agricultural products. Market price information is disseminated to producers, consumers and traders through the media. SIMA has now accumulated a large amount of data and can trace the evolution of food prices in a large geographical area, and for a wide range of commodities.
We selected a sample of 15 millet markets from the markets covered by the SIMA. Market selection was based on the quality of available information: markets for which too many data are missing were dropped from our sample. The selected sample includes a variety of markets that differ according to their location - remote area, border proximity, production area or urban area. The observation period starts in January 1990 and ends in October 2008.
Figure 1 depicts the evolution of millet prices during the last two decades. Except for N’Guimi at the end of the period, prices follow a common trend punctuated by large positive shocks. Figure 2 focuses on the evolution of real millet price in the capital city, Niamey, relative to the cumulated rainfall during the preceding year3. Considering that rainfall is the main component of the fundamental value of millet, Figure 2 shows periods during which prices deviate from their fundamental value.
3
The rainfall variable is delayed to take into account the production cycle.
0 50 100 150 200 250 300 350 400 1990 1992 1994 1996 1998 2000 2002 2004 2006 2008
Agadez Diffa Dogondoutchi
Dosso Filingué Gaya
Goudoumaria Gouré Katako
Loga Maradi N'Guimi
Except for the 2008 shock that corresponded to the international food crisis, most of the episodes of price boom have been recorded after a rainfall deficit. This was the case in 1996-1998 and 2005. The price increase during 1996-1998 corresponded to three consecutive years of rainfall deficit, the largest price increase being registered in 1997. Prices again reached high levels in 2005, after the 2004 drought. Note that the severer drought registered during the 1990 rainy season did not result in a sharp price increase in 1991.
The unusual price changes in 1994 are partly the consequence of the Franc CFA devaluation. The severe rainfall deficit recorded during the 1993 rainy season, the most important deficit during the period investigated, was not followed by a sharp increase in millet prices (Figure 1). In real terms the millet price fell due to the high level of inflation generated by the devaluation (Figure 2).
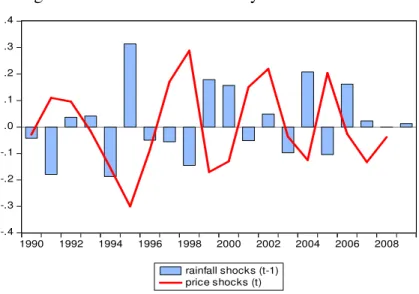
Figure 2. Price shocks in Niamey and rainfall shocks
Source: SIMA and author’s calculations
Shocks are calculated on an annual basis as the difference between the price (cumulated rainfall) level at year t and the mean price (cumulated rainfall) for the 1990-2008 period. They are expressed as a percentage of the mean
A more puzzling situation occurred in 2001-2002. After two consecutive years of excess rainfall, a small rainfall deficit generated a sharp price increase in 2001. Moreover, the price kept increasing in 2002, whereas the rainfall level was above its mean. In 1992 also, millet price registered a positive shock that was not related to a rainfall deficit. These abnormal price evolutions relative to rainfall may reflect the presence of speculative bubbles.
-.4 -.3 -.2 -.1 .0 .1 .2 .3 .4 1990 1992 1994 1996 1998 2000 2002 2004 2006 2008 rainfall shocks (t-1) price shocks (t)
2. A rational bubble model for millet
According to the preceding observations, speculative behaviour on millet markets may have exacerbated climate shock effects, leading to price spikes and increased food insecurity. Before proceeding to econometric tests for the existence of bubbles, we develop a simple asset-pricing model assuming rational expectations. We then focus on a specific class of rational bubbles and highlight their statistical properties.
The millet pricing model
We consider a simple model for millet price with linear supply and demand4. Market equilibrium is given by the set of equations (1) – (3).
Net supply (Q) in period t is positively related to the current price of millet:
t t t
t a bP
Q = + +
ε
b > 0 (1)Pt is the millet price level in period t
at is an index that depends on current and lagged values of yt a vector of exogenous supply
and demand variables.
Farmers and traders withhold supply if they expect the future price to be sufficiently high to compensate for storage costs and losses. Assuming risk-neutral stockholders, demand for stocks in period t (St) is positively related to the price spread between the future expected
price and the current price:
t t t t t t c EP P d w S = ( +1− )+ + c > 0 (2)
dt is an index thatdepends on a vector of variables reflecting the opportunity cost of holding
millet.
1 +
t tP
E is the expected price of millet in period t+1 .
Et is the conditional expectations operator.
ε
t and wt are zero-mean, finite variance, serially uncorrelated disturbance terms. They are forunaccounted variables on the demand and supply side. The millet market equilibrium is given by:
4
1 − + = t t t Q S S (3)
St-1 is the initial stock.
The market clearing price solves equation (3) at each point in time so that:
t t t t tP P x E +1=λ + +µ (4) where: c c b+ = λ > 1 and xt =at−dt
µ
t =ε
t −wt +St−1xt is a forcing variable; it is an index that depends on a vector of variables reflecting market
fundamentals.
µ
t is an error term including the initial stocks, which accounts for unobservedvariables to the researcher.
Equation (4) relates the current millet price to the next period’s expected price, variables determining fundamentals and to an unobserved variable (
µ
). It is a first order difference equation in P. Given that the eigenvalue of the system (λ
) is greater than unity, the forward-looking solution of equation (4) for P involves two components:t t
t B F
P = + (5)
Ft is the market-fundamentals component and Bt is a potential rational-bubbles
component (Blanchard, 1979; Blanchard and Watson, 1982; Diba and Grossman; 1987, 1988).
Under the assumption that Et(xt+j+
µ
t+j) does not grow at a geometric rate equal orgreater than
λ
, Ft is a convergent sum (Diba and Grossman, 1987):) ( 0 ) 1 ( i t i i t i t t E x F + ∞ = + + − + =
∑
λ µ (6)The market-fundamentals component of the millet price relates to the expected value of the exogenous variables determining supply and demand.
In contrast to the fundamental component, the bubble part, Bt, is not stationary. Bt is
the solution to the homogenous expectational difference equation: 0 1− = + t t tB B E λ (7)
If Bt is different from zero there exists a rational bubble that is self-fulfilling. The
t j j t tB B E + =λ for all j > 0 (8)
The presence of a self-fulfilling rational bubble does not violate the no arbitrage condition. The bubble is expected to grow at the required rate of return.
Periodically and partially collapsing bubbles
Following Blanchard and Watson (1982) and Evans (1991), we focus on a class of rational stochastic bubbles that periodically collapse and regenerate: the so called Periodically Collapsing Bubble (PCB) given by (9a) and (9b):
1 1 + + = t t t Bu B λ if Bt ≤ c (9a)
(
)
1 1 1 1 + − + + − + = t t t t B u B θ λ δ π λ δ if Bt > c (9b)δ
andθ
are positive parameters. ut+1 is an exogenous independently and identicallydistributed positive random variable with Etut+1 = 1.
θ
t +1 takes the value 1 with probabilityπ
and 0 with probability 1- π, where 0 <
π
< 1.The PCB process switches between two regimes depending on the bubble being above or below the threshold value c.
This bubble process satisfies equation (7) since the expected growth rate of the bubble is always
λ
. For Bt < c the bubble increases slowly at mean rateλ
; if Bt rises above thethreshold it expands faster at the mean rate
λπ
-1 , but may collapse with probability 1-π
. The bubble grows at a higher rate during expanding phases to compensate the investor for the possibility of collapse. When the bubble collapses, its growth rate falls to a mean value ofδ
, and the process begins again (Evans, 1991).This type of bubble not only accounts for occasional asset price crashes but also for rapid run-ups in asset prices before a crash.
3. The fundamental value of millet
To test for the presence of periodically collapsing bubbles we first need an empirical model for the fundamental value of millet. Following Pindyck and Rottemberg (1990), we assume that forecasts of xt in equation (6) are based on its current and past values. xt includes
observable exogenous variables that determine millet supply and demand, and all relevant information about future net supply.
Most previous studies have shown that millet markets in Niger are fairly well spatially integrated (Araujo et al., 2010). As a consequence the fundamental value of millet in Niger is assumed to be determined at the country level. The fundamental value is only allowed to vary between markets by a constant term. These market specific effects catch differences in price level that are related to the geographical location of markets. In other words, specific effects measure fixed transaction costs associated with the location of markets.
The fundamental value of millet is therefore estimated using panel data for the 15 millet markets for the period 1990-2008. The estimated equation is given by (10):
it i st s s t t t t
it Rainfall CumulRainfall CPI Gasoline M
P =α +α +α +α +
∑
ϕ +ε +ν = 12 1 4 3 2 1 . (10)Pit is the millet price on market i at time t. Rainfallt is the monthly rainfall level. This
is an information variable that is useful to predict the future harvest. Cumul rainfallt is the
cumulated level of rainfall over the rainy season (from May to October) in the main production area5. It takes a constant value from October t-1 to September t (the crop year). This is an exogenous variable which aims to capture the state of millet availability for the current period. Gasolinet is the price of gasoline in Niger. This variable is a proxy for production and trade costs that vary with the oil price. CPIt is the consumer price index in
Niger. Ms are monthly dummies that capture seasonal price variations.
ε
i are market specificfixed effects.
ν
it is the error term. It includes all factors not explained by right-hand variables.The fitted value of Pit is taken as a measure of the fundamental value of millet;
ν
it isthe apparent deviation of the price in the i market from its fundamental value at time t.
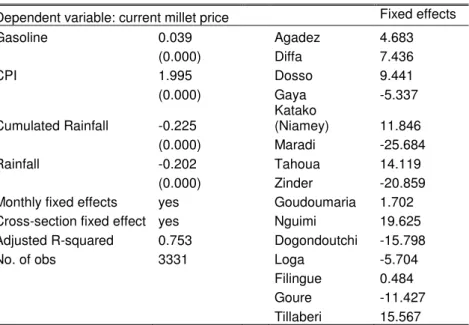
Estimation results are given in Table 1. As expected, gasoline price enters positively in the fundamental equation. The current rainfall level and the cumulated rainfall level, which represent, respectively, the future harvest and the current availability of millet, negatively affect the fundamental value of millet. Mean prices in Maradi, Zinder, Dogondoutchi, Gouré, which are located in the main producing region of Niger, close to the Nigerian border, are below the average price level. Mean price is highest in N’Guimi, which is located in a remote
5
Rainfall data come from Global Air Temperature and Precipitation: Gridded Monthly and Annual Time Series (Version2.01) interpolated and documented by Cort J. Willmott and Kenji Matsuura (with support from IGES and NASA), University of Deleware. For more information see Legates et al. (1990a 1990b) and Willmott and Matsuura (1995). The data base gives monthly precipitation for the 1900-2008 period, interpolated to a 0.5 by 0.5 degree grid resolution. The variables Rainfall and Cumulated rainfall are respectively the mean rainfall level and the mean cumulated rainfall level calculated on observations below 14 degrees latitude (considered as the
area, close to the border with Chad. Prices are also higher in Niamey (Katako), the main consumption market of Niger.
Table 1. Estimation of the fundamental value of millet
Dependent variable: current millet price Fixed effects
Gasoline 0.039 Agadez 4.683 (0.000) Diffa 7.436 CPI 1.995 Dosso 9.441 (0.000) Gaya -5.337 Cumulated Rainfall -0.225 Katako (Niamey) 11.846 (0.000) Maradi -25.684 Rainfall -0.202 Tahoua 14.119 (0.000) Zinder -20.859
Monthly fixed effects yes Goudoumaria 1.702
Cross-section fixed effect yes Nguimi 19.625
Adjusted R-squared 0.753 Dogondoutchi -15.798
No. of obs 3331 Loga -5.704
Filingue 0.484
Goure -11.427
Tillaberi 15.567
P-value in parenthesis. Stationarity tests are given in the appendix.
As an illustration, Figure 3 shows the estimated fundamental component of the millet price in Niamey (Katako market). The deviation between the current price and the fundamental component represents the bubble part. This figure highlights four periods during which the millet price in Katako rose dramatically beyond its fundamental value - 1998, 2001, 2002 and 2005. A deeper analysis shows that apparent bubbles break out at the beginning of the lean season, and end with the arrival of the new harvest (Araujo and al., 2012) In other words, prices increase exponentially from March/April to July/August; they then crash to their initial level within one or two months.
Figure 3. Fundamental component of the millet price in Katako (Niamey) (Fcfa/kg)
0 50 100 150 200 250 300 350 1990 1992 1994 1996 1998 2000 2002 2004 2006 2008
The standard ADF test (table 2) rejects the unit root null hypothesis for apparent bubbles in all markets. However this test is not very informative when data exhibit both
skewness and excess kurtosis which is the case. The Jarque Bera test rejects normality for all markets except Maradi and Loga, at the 5 % confidence level (table 2). Note that non normality is consistent with the presence of periodically collapsing bubbles (Taylor and Peel, 1998; Payne and Waters, 2007).
So we have implemented the residuals-augmented Dickey-Fuller (RADF) test, developed by Taylor and Peel (1998)6, which is robust to skewness and kurtosis in the distribution of the residual term. t-tests in the RADF equation (table 2) confirm the presence of skewness and kurtosis in the potential bubbles. The RADF test does not reject the unit root hypothesis for four of the 15 markets under study - Dogondoutchi, Gouré, Katako and N’Guimi. This test is more powerful than the ADF test in detecting periodically collapsing bubbles, but it does not alone provide sufficient evidence for the presence of bubbles.
4. Testing for asymmetry in the bubble process
As shown by many authors (see for instance Evans, 1991; Charemza and Deadman 1995; van Norden and Vigfusson, 1996; Waters, 2008), linear unit root tests are not able to detect collapsing bubbles which only exhibit characteristic bubble properties during the expansion phase. Therefore, we implement two non linear unit root tests looking for asymmetry in the bubble process.
We use first a generalization of the Dickey-Fuller test proposed by Enders and Granger (1998) and Enders and Siklos (2001) that relies on a momentum threshold autoregressive (M-TAR) model. As shown by Payne and Waters (2007) and Bohl (2003), the M-TAR model is well suited when the adjustment exhibits more momentum in one direction than the other. This is the case for PCBs which increase exponentially until they reach a certain threshold level and suddenly collapse.
Table 2. Bubbles’ characteristics
Agadez Diffa Dogondoutchi Dosso Filingué Gaya Goudoumaria Gouré Katako Loga Maradi N’Guimi Tahoua Tillabéri Zinder
No of Obs. 226 221 217 226 210 226 215 226 226 216 226 218 226 226 226 Skewness 0.736 0.611 0.326 0.571 0.700 0.433 1.354 0.405 0.501 0.315 -0.027 0.710 1.065 0.504 0.864 Kurtosis 4.307 3.123 2.600 3.350 3.788 3.324 6.371 3.979 3.435 2.777 2.668 3.107 5.518 3.705 7.038 Jarque Bera 36.509 13.872 5.289 13.412 22.589 8.042 167.527 15.223 11.215 4.028 1.067 18.405 102.420 14.257 181.679 Prob 0.000 0.001 0.071 0.001 0.000 0.018 0.000 0.000 0.004 0.133 0.587 0.000 0.000 0.001 0.000 ADF test (1) φ -0.166 -0.161 -0.200 -0.150 -0.319 -0.237 -0.276 -0.153 -0.142 -0.160 -0.149 -0.169 -0.213 -0.255 -0.223 t-stat -4.509 -4.288 -4.760 -4.265 -6.139 -5.487 -5.618 -4.259 -3.975 -4.036 -4.136 -4.346 -5.190 -5.705 -5.280 RADF test (2) θ -0.172 -0.135 -0.101 -0.133 -0.210 -0.181 -0.151 -0.094 -0.099 - - -0.123 -0.166 -0.215 -0.159 τA -5.092 -3.973 -2.715 -4.248 -4.444 -4.541 -3.699 -2.767 -3.151 - - -3.391 -4.539 -5.210 -4.386 t-stat : Kurtosis 4.223 7.569 8.746 4.787 9.169 6.969 12.666 7.277 7.751 - - 7.139 8.725 4.116 8.703 t-stat : Skewness 2.426 2.640 0.252 1.398 1.107 2.021 -1.221 1.678 0.609 - - -0.004 4.858 1.032 -4.281 (1) : Test equation: t p k k t k t t B B u B
∑
= − − + ∆ + = ∆ 1 1 ψ φ (2): Test equation: ∆Bt = θBt−1 +γwˆt +ξt (see details in the appendix).
Critical value for τA : -3.54 at the 5% level (Sarno and Taylor 2003 for a sample size equal to 156 observations)
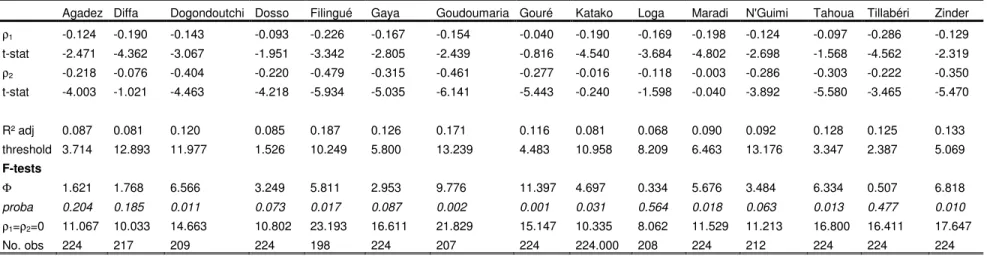
Table 3. Results from the M-TAR model
Agadez Diffa Dogondoutchi Dosso Filingué Gaya Goudoumaria Gouré Katako Loga Maradi N'Guimi Tahoua Tillabéri Zinder ρ1 -0.124 -0.190 -0.143 -0.093 -0.226 -0.167 -0.154 -0.040 -0.190 -0.169 -0.198 -0.124 -0.097 -0.286 -0.129 t-stat -2.471 -4.362 -3.067 -1.951 -3.342 -2.805 -2.439 -0.816 -4.540 -3.684 -4.802 -2.698 -1.568 -4.562 -2.319 ρ2 -0.218 -0.076 -0.404 -0.220 -0.479 -0.315 -0.461 -0.277 -0.016 -0.118 -0.003 -0.286 -0.303 -0.222 -0.350 t-stat -4.003 -1.021 -4.463 -4.218 -5.934 -5.035 -6.141 -5.443 -0.240 -1.598 -0.040 -3.892 -5.580 -3.465 -5.470 R² adj 0.087 0.081 0.120 0.085 0.187 0.126 0.171 0.116 0.081 0.068 0.090 0.092 0.128 0.125 0.133 threshold 3.714 12.893 11.977 1.526 10.249 5.800 13.239 4.483 10.958 8.209 6.463 13.176 3.347 2.387 5.069 F-tests Φ 1.621 1.768 6.566 3.249 5.811 2.953 9.776 11.397 4.697 0.334 5.676 3.484 6.334 0.507 6.818 proba 0.204 0.185 0.011 0.073 0.017 0.087 0.002 0.001 0.031 0.564 0.018 0.063 0.013 0.477 0.010 ρ1=ρ2=0 11.067 10.033 14.663 10.802 23.193 16.611 21.829 15.147 10.335 8.062 11.529 11.213 16.800 16.411 17.647 No. obs 224 217 209 224 198 224 207 224 224.000 208 224 212 224 224 224
The M-TAR equation for the bubble component of millet price (B) is given by:
∑
= − − − + + ∆ + − = ∆ l i t i t i t t t t t I B I B B B 1 1 2 1 1 ) 1 ( ρ ρ γ ε (11)It is an indicator function that depends on the level of ∆Bt-1:
< ∆ ≥ ∆ = − −
τ
τ
1 1 , 0 , 1 t t t B if B if Iτ
is the unknown threshold value.ε
t is an iid process with zero mean and constant variance.The M-TAR model allows the speed and direction of adjustment, ρ1 and ρ2, to depend
on the previous period’s change in Bt. Following Payne and Waters (2007) our test strategy is
based on the test of the null hypothesis of symmetry when the null of unit root is rejected. The rejection of the null hypothesis of symmetric adjustment with ρ2>ρ1 is evidence for the
presence of a periodically collapsing bubble. Bohl (2003) demonstrated that this test has sufficient power to detect asymmetry when the DGP is given by the Evans’ bubble model. If the estimated coefficient, ρ2, is statistically significant and negative, and larger in absolute
terms than ρ1, there is evidence of a sharp correction when prices rise above a certain
threshold relative to fundamentals.
The threshold value
τ
is estimated using the Chan (1993) procedure, searching over all potential threshold values so as to minimize the sum of squared errors from the fitted model. The lag length is selected according to the Akaike information criterion.Under the null hypothesis of a unit root in Bt, ρ1 = ρ2 = 0. The distribution for the test
statistic is not standard; the critical values are provided by Enders and Granger (1998) and Enders and Siklos (2001). The null hypothesis of symmetry is tested by the restriction, ρ1 = ρ2
using the usual F-statistics (Φ).
The M-TAR estimation results (Table 3) lead to the rejection of the unit root hypothesis for all series. The F tests reject symmetry of adjustment at the 5% confidence level for six markets:- Dogondoutchi, Filingué, Goudoumaria, Gouré, Tahoua and Zinder. As a consequence, the presence of speculative bubbles cannot be rejected for these markets. We note that symmetry of adjustment is rejected at the 10% confidence level for three other markets: - Dosso, Gaya and N-Guimi. Symmetry of adjustment is also rejected for Maradi and
Katako, but the coefficients ρ1 and ρ2 do not satisfy the condition ρ2>ρ1. These results
therefore do not provide evidence for speculative bubbles on the Maradi and Katako markets. An alternative test for asymmetry in the bubble process is given by the Markov switching ADF (MS-ADF) tests developed by Hall, Psaradakis and Sola (1999). This test is based on a two state Markov Switching Model allowing for the possibility of two regimes in the data generating process: the data are non-stationary in one regime and stationary in the other one, collapsing back towards the fundamental solution. The probability of observing the collapsing regime is assumed to follow a first order Markov process. Evidence that one regime is non-stationary, possibly with an explosive root, while the other is stationary, indicates the presence of a bubble.
The Markov Switching specification, with a stochastic transition from one state to the other, is less restrictive than the M-TAR model, but further from the original model of Evans, where the transition from one state to the other is deterministic, depending on the bubble growth rate. However, the main advantage of the Markov switching model compared to the M-TAR model is to allow for a non-stationary regime.
The Markov switching ADF test equation is given by (12):
[
]
[
]
t k[
t t]
t p k t k t k t t t t t t S S S S B S S B S S e B 0 1 1 1 0 1 1 0 1 0(1 ) µ β (1 ) β ψ (1 ) ψ σ (1 ) σ µ − + + − + + − + ∆ + − + = ∆ − = −∑
with et ~ N (0,1) (12)where St is a discrete-valued random variable that can take two values (0 or 1). If St = 0, the process is in regime 1; if St = 1, the process is in regime 2. The random sequence {St} is
specified as a homogeneous Markov chain (see Hamilton, 1994) with transition probabilities: Pr{ St = 1|St-1 = 1} = p ; Pr{ St = 0|St-1 = 1} = 1- p ;
Pr{ St = 0|St-1 = 0} = q ; Pr{ St = 1|St-1 = 0} = 1- q (13) This specification allows all parameters, including the variance of the residual term, to vary according to the regime. The bubble process is expected to be non-stationary, possibly with an explosive root (β0 ≥ 0), in one regime, and stationary in the other (β1 < 0)7. The unit
root test is based on the t-ratios associated with the maximum likelihood estimates of
β
0 andβ
1. The null hypothesesβ
0 = 0 andβ
1 = 0 are tested against, respectively, the one-sidedalternative β0 > 0, or β1 < 0. Since the null distribution of the test statistics is unknown,
7
simulated critical values are obtained by parametrically bootstrapping the null model (corresponding to β0 = β1 = 0) using the estimates of
µ
0,µ
1,ψ
0k,ψ
1k,σ
0 andσ
1t. Estimationresults are given in table 48,9.
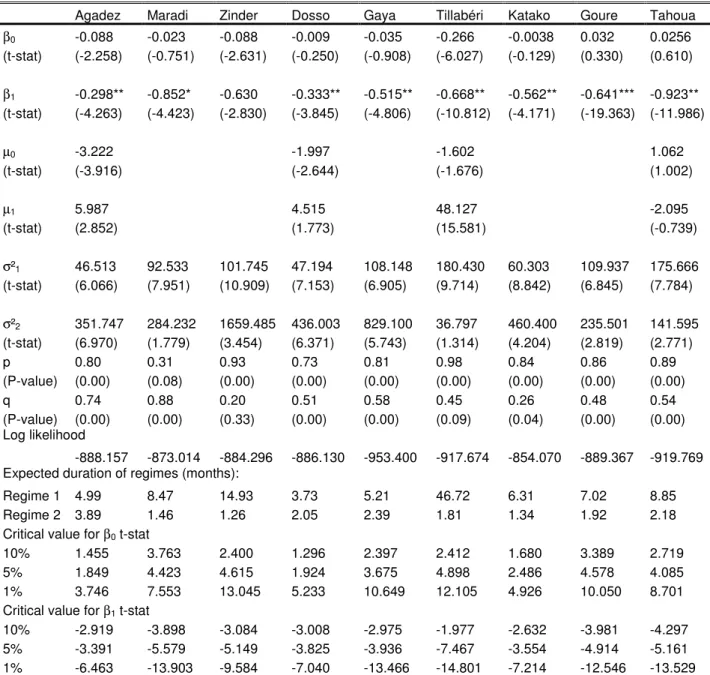
Table 4. Results from the Markov-switching ADF test
Agadez Maradi Zinder Dosso Gaya Tillabéri Katako Goure Tahoua
β0 -0.088 -0.023 -0.088 -0.009 -0.035 -0.266 -0.0038 0.032 0.0256 (t-stat) (-2.258) (-0.751) (-2.631) (-0.250) (-0.908) (-6.027) (-0.129) (0.330) (0.610) β1 -0.298** -0.852* -0.630 -0.333** -0.515** -0.668** -0.562** -0.641*** -0.923** (t-stat) (-4.263) (-4.423) (-2.830) (-3.845) (-4.806) (-10.812) (-4.171) (-19.363) (-11.986) µ0 -3.222 -1.997 -1.602 1.062 (t-stat) (-3.916) (-2.644) (-1.676) (1.002) µ1 5.987 4.515 48.127 -2.095 (t-stat) (2.852) (1.773) (15.581) (-0.739) σ²1 46.513 92.533 101.745 47.194 108.148 180.430 60.303 109.937 175.666 (t-stat) (6.066) (7.951) (10.909) (7.153) (6.905) (9.714) (8.842) (6.845) (7.784) σ²2 351.747 284.232 1659.485 436.003 829.100 36.797 460.400 235.501 141.595 (t-stat) (6.970) (1.779) (3.454) (6.371) (5.743) (1.314) (4.204) (2.819) (2.771) p 0.80 0.31 0.93 0.73 0.81 0.98 0.84 0.86 0.89 (P-value) (0.00) (0.08) (0.00) (0.00) (0.00) (0.00) (0.00) (0.00) (0.00) q 0.74 0.88 0.20 0.51 0.58 0.45 0.26 0.48 0.54 (P-value) (0.00) (0.00) (0.33) (0.00) (0.00) (0.09) (0.04) (0.00) (0.00) Log likelihood -888.157 -873.014 -884.296 -886.130 -953.400 -917.674 -854.070 -889.367 -919.769
Expected duration of regimes (months):
Regime 1 4.99 8.47 14.93 3.73 5.21 46.72 6.31 7.02 8.85
Regime 2 3.89 1.46 1.26 2.05 2.39 1.81 1.34 1.92 2.18
Critical value for β0 t-stat
10% 1.455 3.763 2.400 1.296 2.397 2.412 1.680 3.389 2.719
5% 1.849 4.423 4.615 1.924 3.675 4.898 2.486 4.578 4.085
1% 3.746 7.553 13.045 5.233 10.649 12.105 4.926 10.050 8.701
Critical value for β1 t-stat
10% -2.919 -3.898 -3.084 -3.008 -2.975 -1.977 -2.632 -3.981 -4.297
5% -3.391 -5.579 -5.149 -3.825 -3.936 -7.467 -3.554 -4.914 -5.161
1% -6.463 -13.903 -9.584 -7.040 -13.466 -14.801 -7.214 -12.546 -13.529
Critical values calculated from parametric bootstrap with 500 replications
The results in Table 4 show two distinct regimes - a unit root regime (regime 1), and a stationary regime (regime 2). In the unit root regime the coefficient
β
0 is close to zero, butnegative, except for the bubble processes in Goure and Tahoua. In this regime t-stats are well above standard values. However, comparing these test statistics to bootstrap critical values,
8
MS-ADF test cannot be computed for series with missing values. 9
Estimations have been performed using the Matlab toolbox: MS_Regress. See: Perlin, M. (2010), “MS_Refgress – the MATLAB Package for Markov regime Switching Models”, available at: SSRN:
the unit root null hypothesis cannot be rejected for the explosive root alternative for any market.
Regime 2 captures the collapsing phase of bubbles. In this regime the coefficient
β
1 islarge in absolute value, indicating a sharp correction in millet price disequilibria. The unit root null hypothesis is rejected for the stationary alternative at the 1% level for Gouré, Tahoua and Tillaberi, and at the 10 % level for the other markets, except for Zinder.
The unit root regime dominates over the whole period. This regime lasts, on average, for seven months. The expected duration of the collapsing regime is short, equal to two months on average. This regime is also characterised by higher volatility (except for Tillaberi), than the non stationary regime.
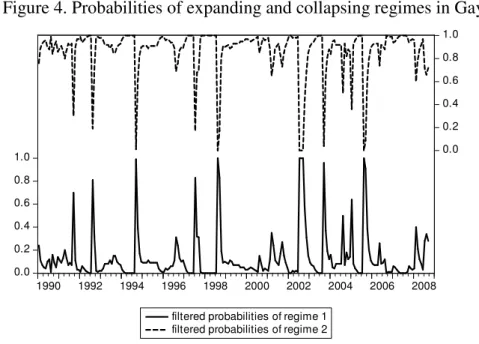
As an illustration, Figure 4 depicts the inferred probabilities of being in each regime for the bubble process in Gaya. The model clearly identifies five periods of collapse in the bubble process10 - September 1994, August 1998, July-September 2002, September 2003 and August 2005. These periods of collapse are roughly the same for the other markets.
Figure 4. Probabilities of expanding and collapsing regimes in Gaya
Results from the switching ADF tests corroborate the previous ones derived from the M-TAR model. They show strong evidence of collapse episodes, but detect only weak evidence of explosive root, with the exception of two series, Goure and Tahoua, both of which present the two salient characteristics of periodically collapsing bubbles. By contrast,
10
With a probability of being in the collapsing regime larger than 0.95.
0.0 0.2 0.4 0.6 0.8 1.0 0.0 0.2 0.4 0.6 0.8 1.0 1990 1992 1994 1996 1998 2000 2002 2004 2006 2008
filtered probabilities of regime 1 filtered probabilities of regime 2
the Tillaberi series, which is stationary in both regimes, does not present any bubble characteristics. Results for the other markets are more divergent.
The failure of switching ADF tests to detect periods of explosive behaviour in the bubble component of millet prices may be due to the short-lived nature of bubbles. Indeed, the number of observations from an explosive period relative to the sample size is low. The tests conducted in the next part of this paper address this issue.
5. Testing for explosive behaviour in the bubble component
Focusing on the expansion phase of bubbles we implant the rolling ADF test developed by Phillips, Wu and Yu (2009). The rolling ADF test allows detection of explosive behaviour and location of the start and end dates of the bubble. It is expected to perform better than the previous tests in detecting short-lived bubbles.
The procedure consists in testing iteratively the unit root null hypothesis against the right-tailed alternative hypothesis of explosive process. The test equation is given by (14):
∑
= − − + ∆ + + = ∆ J j t j t j t t B B B 1 1φ
ε
δ
µ
εt ~ NID(0, σ²) (14)The unit root null hypothesis is H0: δ = 1; the right-tailed alternative hypothesis is H1: δ > 1.
Under the rolling ADF test procedure, equation (14) is estimated repeatedly on a rolling subsample of size n. The first subsample includes the first observation to the nth observation. The second subsample includes the second observation to the (n+1)th observation. The ADFr statistic is computed for each rolling subsample. In order to detect
short-lived bubbles the test is implemented for low subsample sizes, being aware that coefficients may be poorly estimated when the sample size is too small
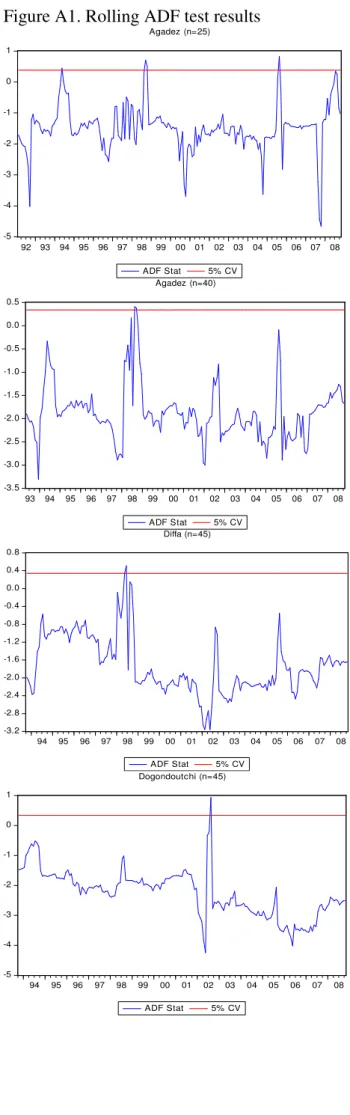
The origination date and the collapse date of the explosive process can be identified comparing the rolling ADF test statistics with corresponding critical values. The bubble phase is given by the consecutive time intervals during which the ADF test statistic is significant. More precisely, we consider that the end date of a bubble is given by the last observation of the sample corresponding to the most significant test statistic. The origination date of bubble will be the first observation of the sample corresponding to the smaller but significant test statistic. The critical values for each subsample size are computed using Monte Carlo simulations with 100,000 replications. Test results are reported in table 5 and in figure A1 in
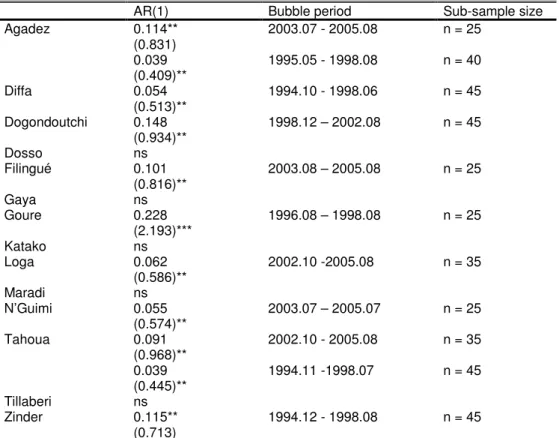
Table 5 gives the estimated coefficient (δ), and the corresponding t-statistic, for the most significant ADF test, and for different sub-sample sizes. Rolling ADF tests for n=25 do not reject the null of unit root in favour of the right-tailed alternative at the 5% significance level for 5 markets - Dosso, Gaya, Katako, Maradi and Tillaberi. According to these results there is no significant evidence of speculative bubbles in the main markets of Niger. Maradi, Dosso, and Gaya are major markets located in the main producing region; Katako is the main market of the capital Niamey. Tillaberi is a smaller market, located in a producing region of the western part of Niger, not far from the border of Mali and Burkina Faso.
Table 5. Most significant ADF statistics
AR(1) Bubble period Sub-sample size
Agadez 0.114** 2003.07 - 2005.08 n = 25 (0.831) 0.039 1995.05 - 1998.08 n = 40 (0.409)** Diffa 0.054 1994.10 - 1998.06 n = 45 (0.513)** Dogondoutchi 0.148 1998.12 – 2002.08 n = 45 (0.934)** Dosso ns Filingué 0.101 2003.08 – 2005.08 n = 25 (0.816)** Gaya ns Goure 0.228 1996.08 – 1998.08 n = 25 (2.193)*** Katako ns Loga 0.062 2002.10 -2005.08 n = 35 (0.586)** Maradi ns N’Guimi 0.055 2003.07 – 2005.07 n = 25 (0.574)** Tahoua 0.091 2002.10 - 2005.08 n = 35 (0.968)** 0.039 1994.11 -1998.07 n = 45 (0.445)** Tillaberi ns Zinder 0.115** 1994.12 - 1998.08 n = 45 (0.713)
t-stat are in parenthesis; **: significant at the 5% level; ***: significant at the 1% level; Lag length selection according to Schwartz information criterion.
ns: non significant
However three periods of speculative behaviour can be distinguished on the other markets. First, Agadez, Filingué and N’Guimi experienced short-lived bubbles during the 2003-2005 period, while Loga and Tahoua experienced a more persistent bubble episode (from October 2002 to August 2008). Second, Agadez, Diffa, Tahoua and Zinder experienced persistent bubbles during the period running from October 1994 to August 1998, while Gouré experienced a shorter episode of bubble from August 1996 to August 1998. Third, Dogondoutchi experienced a long bubble episode during 1999 to 2002.
These results support the previous asymmetry test results that detected collapsing phases for Dogondoutchi, Filingué, Gouré, Tahoua, Zinder, and to a lesser extent N’Guimi, but did not show evidence of collapsing phases for Maradi, Katako, Dosso, Gaya and Tillaberi. Results are unclear for Agadez, Diffa, and Loga, the rolling ADF test detecting expanding phases, while the asymmetry test did not show a collapse phases.
6. Concluding remarks
Econometric tests do not reject the existence of speculative bubbles of the PCB type for some of the markets under study. According to these results, the 2005 food crisis may be partly caused by speculative behaviour in Agadez, Filingué, Loga, N’Guimi and Tahoua. However, 1994-1998 should be considered as a more important period of speculation; bubbles detected on five markets during this period tend to be more persistent.
Most of the markets that have experienced a bubble episode are located in deficit and remote areas with low income. This is particularly the case for N’Guimi and Diffa, which are both located in a poor region of the eastern part of the country, close to the Chad border. However, bubbles have also been detected in markets that are located in more favoured areas in terms of their geo-climatic and socio-economic conditions. This is the case of Dogondoutchi, Filingué, Gouré, Loga and Zinder (an important urban centre in the southern part of Niger).
The most important findings concern the main millet markets of Niger which are Niamey (Katako), Maradi, Gaya and Dosso. The tests for asymmetry and for explosiveness in bubble process converge to reject the presence of rational speculative bubbles on these markets at the usual confidence level. As a consequence, speculative behaviour should not be considered as a widespread phenomenon in Niger, nor responsible for major food crises.
The results are of particular importance for the definition of food security policy in Niger. Actions targeted at deficit and low income areas, which are more prone to speculation, should be taken. To that end, a trade expansion program aimed at reducing barriers to trade within the country should be a priority.
The limits of this type of analysis are well-known. The tests for speculative bubbles are joint hypothesis tests of an asset price model, and of the presence of bubbles. As a consequence, apparent evidence for bubbles can indicate a mis-specification of the market
fundamental. On the contrary, rejection of the presence of partially collapsing rational bubbles does not rule out the possibility of other types of speculative bubbles.
For a robustness test, the analysis has been repeated using alternative specifications for the fundamental value of millet. First, the international price of rice has been introduced in the millet fundamental equation to take into account possible substitution effects at the consumption level between local and imported cereals. However this price is never significant. Second, millet production has been introduced in the fundamental equation instead of the cumulative rainfall variable. The results are unchanged, except for N’Guimi which does not exhibit bubble characteristics anymore. Lastly, we note that ADF type tests are invariant to linear transformation of the series. Therefore a mis-specification of the bubble’s level does not alter the unit root tests.
References
Aker, J. (2010) ‘Chocs Pluviométriques, Marchés et Crises Alimentaires: l’effet de la sécheresse sur les marchés céréaliers au Niger’, Revue d’Economie du Développement, 1: 71-108.
Araujo, C., C. Araujo Bonjean and S. Brunelin (2012), ‘Alert at Maradi: Preventing Food Crises by using Price Signals’, World Development, (forthcoming).
Blanchard, O.J. (1979) ‘Speculative Bubbles, Crashes and Rational Expectations’. Economics
Letters, 3(4): 387–389.
Blanchard, O.J. and M.W.Watson (1982) ‘Bubbles, Rational Expectations and Financial Markets’. NBER Working Paper no. 945. National Bureau of Economic Research, Cambridge, Mass.
Bohl, M. T. (2003) ‘Periodically Collapsing Bubbles in the US Stock Market?’, International Review of Economics and Finance, 12: 385–397.
Charemza, W. W. and D.F. Deadman (1995) ‘Speculative Bubbles with Stochastic Explosive Roots: The Failure of Unit Root Testing’. Journal of Empirical Finance, 2: 153–163.
Diba, B.T. and H. I. Grossman (1987) ‘On the Inception of Rational Bubbles’, The Quarterly
Journal of Economics, 102(3): 697-700.
Diba B.T. and H. I. Grossman (1988) ‘Explosive Rational Bubbles in Stock Prices?’, The
American Economic Review, 78(3): 520-530.
Enders, W. and C. W. J. Granger (1998) ‘Unit Root Tests and Asymmetric Adjustment with an Example Using the Term Structure of Interest Rates’. Journal of Business and Economic Statistics, 16(3): 304–311.
Enders, G. W. and P. Siklos (2001) ‘Cointegration and Threshold Adjustment’, Journal of Business and Economic Statistics, 19(2): 166–176.
Evans, G. W. (1991) ‘Pitfalls in Testing for Explosive Bubbles in Asset Prices’, American Economic Review, 81: 922–930.
Hall, S. G. and M. Sola (1993) ‘Testing for Collapsing Bubbles: an Endogenous Switching ADF Test’, Discussion Paper no. 15-93, London Business School, London.
Hall, S. G., Psaradakis, Z. and M. Sola (1999) ‘Detecting Periodically Collapsing Bubbles: a Markov-Switching Unit Root Test’, Journal of Applied Econometrics, 14: 143–154.
Im, K. S. and P. Schmidt (2008) ‘More Efficient Estimation Under Non-normality When Higher Moments do not Depend on the Regressors, Using Residual Augmented Least Squares’, Journal of Econometrics, 144: 219–233
IRD (2009), Actualité Scientifque, Fiche n°325, juillet.
Legates, D. R. and C. J. Willmott (1990a). ‘Mean Seasonal and Spatial Variability in Global Surface Air Temperature’, Theoretical and Applied Climatology, 41: 11-21.
Legates, D. R. and C. J. Willmott (1990b). ‘Mean Seasonal and Spatial Variability in Gauge-Corrected, Global Precipitation’, International Journal of Climatology, 10: 111-127.
Payne, J. E. and G. A. Waters (2005) ‘REIT Markets: Periodically Collapsing Negative Bubbles? ’, Applied Financial Economics Letters, 1(2): 65–69.
Phillips, P., Y. Wu and J. Yu (2009), ‘Explosive Behaviour in the 1990s Nasdaq: when did exuberance escalate asset values?’ Cowles Foundation discussion Paper, n°1699, Cowles Foundation for Research in Economics, Yale University.
Pindyck, R. and J. Rotemberg (1990) ‘The excess Co-Movement of Commodity Prices’, The
Economic Journal, 100(403): 1173-1189.
Quddus, M. and C. Becker (2000) ‘Speculative Price Bubbles in the Rice Market and the 1974 Bangladesh Famine’, Journal of Economic Development, 25(2): 155-175.
Ravallion, M. (1985), ‘The performance of Rice price Markets in Bangladesh During the 1974 Famine’, The Economic Journal, 95(377): 15-29.
Sarno, L. and Taylor, M. P.(2003) ‘An Empirical Investigation of Asset Price Bubbles in Latin American Emerging Financial Markets’, Applied Financial Economics, 13(9): 635-643. Sen, A. (1981) Poverty and famines. An Essay on Entitlements and Deprivation, Oxford: Clarendon Press.
Taylor, M. P. and D. A. Peel (1998) ‘Periodically Collapsing Stock Price Bubbles: A Robust Test’. Economics Letters, 61: 221–228.
Van Norden, S. (1996) ‘Regime Switching as a Test for Exchange Rate Bubbles’, Journal of
Applied Econometrics, 11(3): 219-251.
Van Norden, S. and H. Schaller (1993). ‘The Predictability of Stock Market Regime: Evidence from the Toronto Stock Exchange’, The Review of Economics and Statistics, 75(3): 505-510.
Van Norden, S. and R. Vigfusson (1996) ‘Avoiding the Pitfalls: Can Regime-Switching Tests Detect Bubbles?’, Working Paper, 1996-11, Bank of Canada.
Waters, G.A. (2008) ‘Unit Root Testing for Bubbles: a Resurrection?’, Economics Letters, 101: 279-281
APPENDIX
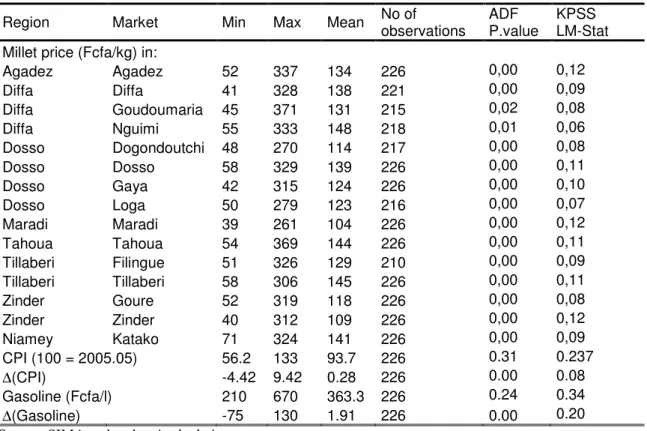
Table A1. Unit root tests. Sample period: January 1990 to October 2008 Region Market Min Max Mean No of
observations
ADF P.value
KPSS LM-Stat Millet price (Fcfa/kg) in:
Agadez Agadez 52 337 134 226 0,00 0,12 Diffa Diffa 41 328 138 221 0,00 0,09 Diffa Goudoumaria 45 371 131 215 0,02 0,08 Diffa Nguimi 55 333 148 218 0,01 0,06 Dosso Dogondoutchi 48 270 114 217 0,00 0,08 Dosso Dosso 58 329 139 226 0,00 0,11 Dosso Gaya 42 315 124 226 0,00 0,10 Dosso Loga 50 279 123 216 0,00 0,07 Maradi Maradi 39 261 104 226 0,00 0,12 Tahoua Tahoua 54 369 144 226 0,00 0,11 Tillaberi Filingue 51 326 129 210 0,00 0,09 Tillaberi Tillaberi 58 306 145 226 0,00 0,11 Zinder Goure 52 319 118 226 0,00 0,08 Zinder Zinder 40 312 109 226 0,00 0,12 Niamey Katako 71 324 141 226 0,00 0,09 CPI (100 = 2005.05) 56.2 133 93.7 226 0.31 0.237 ∆(CPI) -4.42 9.42 0.28 226 0.00 0.08 Gasoline (Fcfa/l) 210 670 363.3 226 0.24 0.34 ∆(Gasoline) -75 130 1.91 226 0.00 0.20
Source: SIMA and authors' calculations.
ADF test: H0: I(1) ; KPSS : H0: I(0). Tests implemented on current price values.
Table A2.: Simulated critical values for the rolling ADF test
n=25 n=35 n=45
1 percent 1.196 1.155 1.119
5 percent 0.412 0.380 0.357
10 percent 0.012 -0.026 -0.040
ADF test with no constant and no trend n: sample size
The Residual Augmented Least Squares Dickey-Fuller test
The Residual Augmented Least Squares (RALS) Dickey-Fuller test developed by
Taylor and Peel (1998) is robust to skewness and kurtosis in the distribution of the residual term and is more powerful in detecting periodically collapsing bubbles. The RADF test equation is given by:
t t t t B w B =θ +γ +ξ ∆ −1 ˆ (A1)
where uˆtare the residuals of the standard DF equation (A2):
t t t B u B = + ∆ φ −1 (A2) and ˆ = [(ˆ3 −3σˆ2ˆ ),(ˆ2 −σˆ2)] t t t t u u u
w . The vector wˆt corrects the estimate of θ for skewness and excess kurtosis of the residuals. σˆ2is the estimated variance of
µ
t ; ξt is whitenoise.
The test statistic is τA =θˆ/ Var (θˆ)
θˆ is the estimated coefficient in Eq. (12); var(θˆ ) is the variance-covariance matrix of which expression is given by Sarno and Taylor (2003) as well as the critical values for τA.
Figure A1. Rolling ADF test results -5 -4 -3 -2 -1 0 1 92 93 94 95 96 97 98 99 00 01 02 03 04 05 06 07 08 ADF Stat 5% CV Agadez (n=25) -3.5 -3.0 -2.5 -2.0 -1.5 -1.0 -0.5 0.0 0.5 93 94 95 96 97 98 99 00 01 02 03 04 05 06 07 08 ADF Stat 5% CV Agadez (n=40) -3.2 -2.8 -2.4 -2.0 -1.6 -1.2 -0.8 -0.4 0.0 0.4 0.8 94 95 96 97 98 99 00 01 02 03 04 05 06 07 08 ADF Stat 5% CV Diffa (n=45) -5 -4 -3 -2 -1 0 1 94 95 96 97 98 99 00 01 02 03 04 05 06 07 08 ADF Stat 5% CV Dogondoutchi (n=45)
-3.5 -3.0 -2.5 -2.0 -1.5 -1.0 -0.5 0.0 0.5 93 94 95 96 97 98 99 00 01 02 03 04 05 06 07 08 ADF Stat 5% CV Dosso (n=35) -8 -7 -6 -5 -4 -3 -2 -1 0 1 93 94 95 96 97 98 99 00 01 02 03 04 05 06 07 08 ADF Stat 5ù CV Filingue (n=25) -4 -3 -2 -1 0 1 92 93 94 95 96 97 98 99 00 01 02 03 04 05 06 07 08 ADF Stat 5% CV Gaya (n=25) -5 -4 -3 -2 -1 0 1 2 3 92 93 94 95 96 97 98 99 00 01 02 03 04 05 06 07 08 ADF Stat 5% CV Gouré (n=25)
-4 -3 -2 -1 0 1 92 93 94 95 96 97 98 99 00 01 02 03 04 05 06 07 08 ADF Stat 5% CV Katako (n=25) -6 -5 -4 -3 -2 -1 0 1 94 95 96 97 98 99 00 01 02 03 04 05 06 07 08 ADF Stat 5% CV Loga (n=34) -5 -4 -3 -2 -1 0 1 92 93 94 95 96 97 98 99 00 01 02 03 04 05 06 07 08 ADF Stat 5% CV Maradi (n=25) -6 -5 -4 -3 -2 -1 0 1 92 93 94 95 96 97 98 99 00 01 02 03 04 05 06 07 08 ADF Stat 5% CV N'Guimi (n=25)
-4 -3 -2 -1 0 1 94 95 96 97 98 99 00 01 02 03 04 05 06 07 08 ADF Stat 5% CV Tahoua (n=45) -5 -4 -3 -2 -1 0 1 93 94 95 96 97 98 99 00 01 02 03 04 05 06 07 08 ADF Stat 5% CV Tillabéri (n=35) -8 -7 -6 -5 -4 -3 -2 -1 0 1 94 95 96 97 98 99 00 01 02 03 04 05 06 07 08 ADF Stat 5% CV Zinder (n=45)