Publisher’s version / Version de l'éditeur:
Vous avez des questions? Nous pouvons vous aider. Pour communiquer directement avec un auteur, consultez la
première page de la revue dans laquelle son article a été publié afin de trouver ses coordonnées. Si vous n’arrivez pas à les repérer, communiquez avec nous à PublicationsArchive-ArchivesPublications@nrc-cnrc.gc.ca.
Questions? Contact the NRC Publications Archive team at
PublicationsArchive-ArchivesPublications@nrc-cnrc.gc.ca. If you wish to email the authors directly, please see the first page of the publication for their contact information.
https://publications-cnrc.canada.ca/fra/droits
L’accès à ce site Web et l’utilisation de son contenu sont assujettis aux conditions présentées dans le site LISEZ CES CONDITIONS ATTENTIVEMENT AVANT D’UTILISER CE SITE WEB.
12th International Conference on Indoor Air Quality and Climate [Proceedings], pp. 1-6, 2011-06-05
READ THESE TERMS AND CONDITIONS CAREFULLY BEFORE USING THIS WEBSITE.
https://nrc-publications.canada.ca/eng/copyright
NRC Publications Archive Record / Notice des Archives des publications du CNRC : https://nrc-publications.canada.ca/eng/view/object/?id=09403ef6-890b-435b-8783-6a9281fab168 https://publications-cnrc.canada.ca/fra/voir/objet/?id=09403ef6-890b-435b-8783-6a9281fab168
NRC Publications Archive
Archives des publications du CNRC
This publication could be one of several versions: author’s original, accepted manuscript or the publisher’s version. / La version de cette publication peut être l’une des suivantes : la version prépublication de l’auteur, la version acceptée du manuscrit ou la version de l’éditeur.
Access and use of this website and the material on it are subject to the Terms and Conditions set forth at
Comparison of air exchange rates measured with different methods and influencing factors: preliminary results of a field study involving asthmatic children
Com pa rison of a ir e x c ha nge ra t e s m e a sure d w it h diffe re nt m e t hods a nd influe nc ing fa c t ors: pre lim ina ry re sult s of a fie ld st udy involving a st hm a t ic c hildre n
N R C C - 5 4 0 1 0
W o n , D . Y . ; A u b i n , D . ; F u g l e r , D . ; G a u v i n , D . ; L a j o i e , P . ; S c h l e i b i n g e r , H .J u n e 2 0 1 1
A version of this document is published in / Une version de ce document se trouve dans:
12th International Conference on Indoor Air Quality and Climate, Austin, Texas, June-05-10, 2011, pp. 1-6,
http://www.nrc-cnrc.gc.ca/irc
The material in this document is covered by the provisions of the Copyright Act, by Canadian laws, policies, regulations and international agreements. Such provisions serve to identify the information source and, in specific instances, to prohibit reproduction of materials without written permission. For more information visit http://laws.justice.gc.ca/en/showtdm/cs/C-42
Les renseignements dans ce document sont protégés par la Loi sur le droit d'auteur, par les lois, les politiques et les règlements du Canada et des accords internationaux. Ces dispositions permettent d'identifier la source de l'information et, dans certains cas, d'interdire la copie de documents sans permission écrite. Pour obtenir de plus amples renseignements : http://lois.justice.gc.ca/fr/showtdm/cs/C-42
Comparison of Air Exchange Rates Measured with Different Methods and
Influencing Factors: Preliminary Results of a Field Study Involving
Asthmatic Children
Doyun Won1,*, Daniel Aubin1, Don Fugler2, Denis Gauvin3, Pierre Lajoie3 and Hans Schleibinger1
1 Institute for Research in Construction, National Research Council of Canada (NRC) 2 Canada Mortgage Housing Corporation (CMHC)
3 Institut National de Santé Publique du Québec (INSPQ)
*
Corresponding email: Doyun.Won@nrc-cnrc.gc.ca
SUMMARY
Two tracer gas methods were used to measure ventilation rates in a field study that involves characterizing ventilation and indoor air quality in 115 homes with asthmatic children. The perfluorocarbon tracer gas (PFT) based measurement was 7-day average and reflected the effects of occupant behaviors, while sulphur hexafluoride (SF6) based method was a short-term measurement with occupant influences minimized. A subset of data involving 70 homes was analyzed to determine the most influential factors associated with each method. The explanatory variables including building characteristics and occupant behaviours were collected using questionnaires. The median of the air exchange rates (AERs) during winter in the child’s bedroom was 0.28 h-1 (SF6 decay) and 0.21 h-1 (PFT technique). The difference was observed to be statistically significant. The most significant explanatory variables were year of construction for SF6-basesed AERs and frequency of child’s bedroom window opening during the 7-day period for the PFT-based AERs.
IMPLICATIONS
This study involves field measurements of ventilation rates using two different methods. Results demonstrate that air exchange rates measured with PFT (7-day average) are lower than those with SF6 decay (3.5-hour average) and measurements from different methods reflect different influential factors for ventilation.
KEYWORDS
Ventilation, Resident, Asthma, Perfluorocarbon tracer gas, Sulphur hexafluoride
INTRODUCTION
Air exchange rate (AER) is a measure of the house’s overall outdoor air supply rate, which include mechanical ventilation and ventilation through intentional openings such as vents, open windows and doors and infiltration through unintentional openings such as cracks in the building envelope (ASHRAE, 2005). It is a vital parameter to understand the air exchange rate in a house from the perspective of energy conservation and indoor air quality.
The SF6 method is measuring AERs by monitoring the SF6 concentration decay over several hours after a pulse injection of SF6 (US EPA, 1990). In contrast, the passive PFT method relies on the passive uptake of a PFT gas released slowly from a source at a constant rate over a longer period (8 hours to several weeks) (US EPA, 1989). The SF6 decay method is a direct measure as it needs only relative concentration for AER calculation. On the other hand, the PFT method is an indirect measure which requires more input data, including zone volume,
source emission rate, and sampler uptake rate. The advantage of the 7-day PFT test is that it provides an average ventilation rate over the measurement period.
A field study is currently being conducted in Quebec City (QC) jointly with Québec’s Institute national de santé publique, Canada Mortgage and Housing Corporation and the Centre hospitalier universitaire du Québec. The focus of the study is on finding associations between the respiratory health of asthmatic children and the environmental conditions, including parameters for indoor air quality and ventilation. Within this field study a large amount of data is being collected on housing characteristics and ventilation, involving 115 homes between November 2008 and March 2010.
The main objective of this paper is to compare air exchange rates obtained using two tracer gas methods (SF6 vs. PFT) in the field study. Comparison of different methods is to determine whether two tracer gas methods can be interchangeable. The second main objective is to assess the influence of occupant activities and housing characteristics on ventilation rates.
METHODS
Data collection on housing characteristics and occupant behaviors
Research participants are children between the ages of 3 and 12 who exhibited obstructive respiratory symptoms resulting from asthma in the Greater Quebec City and whose symptoms were clinically diagnosed. Each house was visited three times (two winter/fall visits and one summer visit) for environmental monitoring. Any two visits between November, 2008 and March, 2009 and between September 2009 and March 2010 were designated as winter visits (W). The summer visit was made between May 2010 and August 2010, noted as S.
The housing characteristics and occupant behaviours were determined using occupant survey at the beginning and end of each visit (a 7-day field test). The environmental questionnaire includes information on housing characteristics (year built, house dimensions, foundations), ventilation and heating system, presence of new emission sources (renovation, furniture, etc), and general occupant behaviours on natural ventilation (e.g., window opening). After 7 days, another questionnaire was administered on the frequency of using house ventilation system, fan (bathroom and kitchen), and window opening for the past one week. This study uses 22 general questions for housing characteristics and year-long occupant behaviours and 6 specific questions for occupant behaviours during the 7-day visit while air exchange rates were monitored.
SF6 (sulphur hexafluoride) decay test
Air exchange rate was measured using the SF6 decay method during the first visit. Dosing syringes were filled with SF6 from a compressed gas cylinder located outside the house. The dose was determined to achieve an initial concentration of ~1 ppm. The test assumes that the house behaves as a single zone, therefore it was essential to ensure thorough mixing of the tracer gas. Depending on the size of the residence, two or three portable mixing fans were placed through the house to assist the mixing. The SF6 decay concentration was logged every 1 minute using a Photoacoustic Field Gas-Monitor (Bruel & Kjaer 1302 or INNOVA 1412) inside the child’s bedroom. The SF6 monitoring continued for ~ 5 hours including the pre-mixing period. During the SF6 test, entering/leaving the house and using ventilation equipment were minimized and all events potentially affecting the air exchange rate were logged. The SF6 test was performed for the winter visits only.
PFT (perfluoro tracer gas) test
During the first day of a visit, three PFT emitters were typically deployed throughout the house with the exception of the child’s bedroom and uninhabited zones such as cellars, unfinished basements and storage rooms. One capillary adsorption tube sampler (CATS) was placed on a dresser, desk or shelf in the child’s bedroom. Both the CATS and emitters were placed at a height of 1 to 2 m above the ground, a least 1.5 m from an exterior wall and away from any heat or cold source as both the PFT emission and sampling rates are a function of temperature. The emitters and passive samplers were typically collected after 6-8 days. The samples were analyzed by the Tracer Technology Group at the Brookhaven National Laboratory (BNL). For quality assurance, multiple CATS were placed side by side in the child’s bedroom or both in the child’s bedroom (CBR) and the living room (LR). The standard deviation was 18% for the side-by-side samples in 8 homes and the average difference between CBR and LR air change rate was 17% after removing outliers. This indicates that the air exchange rate in CBR can be applied to the whole house.
Statistical analysis
SigmaPlot 11 and SYSTAT (version 10) were used to analyze the data. The significance of the difference between air exchange rates estimated from different data sets (e.g., PFT and SF6 tests) was investigated by the Wilcoxon rank test (matched pairs nonparametric test). Associations between air exchange rates and categorical information (housing characteristics) were investigated by one-way analysis of variance. Kruskal-Wallis one-way analysis of variance (ANOVA) on ranks test was performed for the nonparametric ANOVA. Independent variables with significant associations, which were identified through ANOVA, were included in multiple regression analysis (General Linear Model). The multiple regression analysis was repeated 2 - 3 times in a stepwise manner by eliminating the variables less significant until all independent variables were “extremely” significant (P ≤ 0.001). The regression was performed with SYSTAT. Statistical significance was confirmed when a P value was less than 0.05 for a two-sided test.
RESULTS
Air exchange rate (AER) measurements
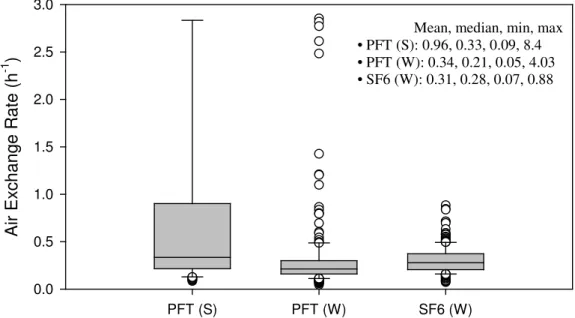
Figure 1 shows box plots of AERs for different seasons and methods without outliers (> 10 h -1). The arithmetic mean, median, minimum and maximum values are inserted in the same figure. The median of AERs in winter was 0.21 (n = 220) and 0.28 h-1 (n = 214) for the PFT and SF6 tests without outliers, respectively. The median in summer was 0.33 h-1 (n = 94) for the PFT method. More variations were observed with PFT-based data and with summer data. For example, the standard deviation of AERs by PFT and SF6 was 0.48 and 0.14 h-1 for winter, respectively. The standard deviation of AERs from the PFT data was 1.54 h-1 for summer. No statistical difference was observed between two winter seasons for both PFT and SF6 methods (P ≤ 0.001). The PFT based data showed that the difference between winter and summer was statistically significant (P ≤ 0.001). The difference between PFT-based and SF6–based AERs was statistically significant (P ≤ 0.001). SF6-based AERs generally followed log-normal distributions. Neither normal nor log-normal distributions were suitable to describe PFT-based AERs, which may be due to extreme values. For example, the maximum was much bigger with PFT-based AER (4.03 h-1 for winter) than SF6–based AER (0.88 h-1 for winter), even after outliers bigger than 10 h-1 were removed.
Influential factors for AERs from PFT data
One-way ANOVA showed that the following variables could be significant in explaining PFT-based AERs: season (P ≤ 0.001), year of construction (P ≤ 0.001 in winter), house volume (P = 0.004 in winter), presence of mechanical ventilator, including heat recovery ventilator (HRV) and air exchanger without heat recovery (P ≤ 0.001 in winter), frequency of leaving doors or windows open (P = 0.028 in winter), operation of mechanical ventilator during the day visit (P = 0.041 in winter), duration of bathroom fan operated during the day visit (P = 0.035 in winter), frequency of child’s bedroom window opened during the day visit (P = 0.045 in summer), and frequency of child’s door opened at night during the 7-day visit (P = 0.022 in winter). The multiple regression analysis with all the significant variables identified by ANOVA resulted in a R2 value of 0.344 (1st model in Table 1). The 2nd regression with reduced variables (those with P value < 0.05 in the 1st model) resulted in a much reduced predictability (R2 = 0.160 in Table 1). The two most significant variables were frequency of child’s bedroom window opened while the PFT samples were collected (CBRWindFrq7) and frequency of child’s bedroom door opened at night (CBRDoorFrq). Frequency of CBR’s window opened (CBRWindFrq7) could explain 11% of the variations (3rd model in Table 1).
Figure 1. Air exchange rates measured by the PFT and SF6 method.
Note: One (PFT, W) and nine data points (PFT, S) greater than 3 h-1 are not shown.
The low predictability may be associated with the fact that unusually high air exchange rates were observed frequently in summer. For example, nine houses were reported to have an air exchange rate bigger than 3 h-1 in summer. The high values could be outliers that might prevent from getting a better prediction model. Another potential explanation can be that the explanatory variables used in this analysis may not include the most influential factors. Interestingly, the influence of season became less significant after adjustment for other occupant-related variables, although it was clearly shown as an important factor through ANOVA. The seasonal effect might reflect occupant behaviors of opening windows and doors more often. Therefore, after adjustment of occupant behaviors, the seasonal effect became less dominant.
The variables that might have significant associations with SF6–based AERs were also identified using one-way ANOVA. Variables with P < 0.05 were year of construction (P ≤
PFT (S) PFT (W) SF6 (W) A ir E x c hang e R at e (h -1 ) 0.0 0.5 1.0 1.5 2.0 2.5 3.0
Mean, median, min, max • PFT (S): 0.96, 0.33, 0.09, 8.4 • PFT (W): 0.34, 0.21, 0.05, 4.03 • SF6 (W): 0.31, 0.28, 0.07, 0.88
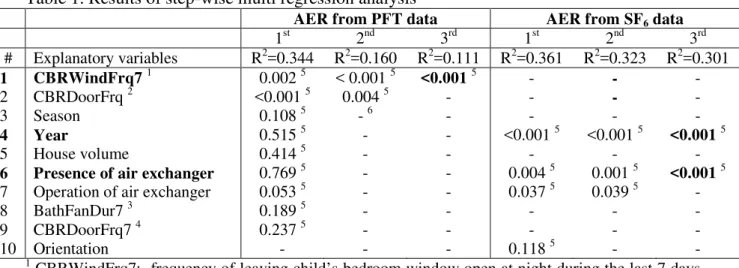
0.001), house orientation (P = 0.012), presence of mechanical ventilator (P ≤ 0.001), and operation of mechanical ventilator during the 7-day visit (P = 0.038). The multi regression analysis showed the identified variables could explain 36.1% of the variance in SF6–based AERs (Table 1). The 2nd regression with reduced variables could explain the variance of SF6– based AERs (32.3%) as good as the 1st model. The 3rd model showed that two extremely significant variables were year of construction and presence of mechanical ventilator. A regression analysis with each variable showed that year of construction (R2 = 0.235) could be a better predictor of SF6-based AERs than presence of mechanical ventilator (R2 = 0.066). Table 1. Results of step-wise multi regression analysis
AER from PFT data AER from SF6 data
1st 2nd 3rd 1st 2nd 3rd # Explanatory variables R2=0.344 R2=0.160 R2=0.111 R2=0.361 R2=0.323 R2=0.301 1 CBRWindFrq7 1 0.002 5 < 0.001 5 <0.001 5 - - - 2 CBRDoorFrq 2 <0.001 5 0.004 5 - - - - 3 Season 0.108 5 - 6 - - - - 4 Year 0.515 5 - - <0.001 5 <0.001 5 <0.001 5 5 House volume 0.414 5 - - - - -
6 Presence of air exchanger 0.769 5 - - 0.004 5 0.001 5 <0.001 5
7 Operation of air exchanger 0.053 5 - - 0.037 5 0.039 5 -
8 BathFanDur7 3 0.189 5 - - - - -
9 CBRDoorFrq7 4 0.237 5 - - - - -
10 Orientation - - - 0.118 5 - -
1 CBRWindFrq7: frequency of leaving child’s bedroom window open at night during the last 7 days, 2 CBRDoorFrq: frequency of leaving child’s bedroom door open at night (from the year-long occupant
behavior survey), 3 BathFanDur7: duration of bathroom fan operation during the last 7 days, 4 CBRDoorFrq7: frequency of leaving child's bedroom door open at night during the last 7 days, 5: P value, 6: the variables marked with “-” were not included in the regression.
DISCUSSION
A statistical analysis showed that the difference in air exchange rates between the PFT and SF6 method was significant at a significance level (α) of 0.05. The median of the SF6-based air exchange rate (AER) was 33% higher than that of the PFT-based AER. However, it is not clear whether the difference is scientifically or practically meaningful. The difference was bigger than the estimated error associated with a tracer decay method of 10-15% (Van Buggenhout, 2009), but closer to 20-30% seasonal under-prediction by the passive method shown in a simulation study on two types of houses in five climate zones (Sherman 1989). On the other hand, the difference in the air exchange rates observed in this study may not be ignored if the two methods are simply measuring different ventilation rates. Ventilation rates vary considerably in response to many variables, including human activities, system operations and weather. SF6-based measurement in this study was done for a short time period (~3.5 hours at maximum) during a day. On the other hand, PFT-based air exchange rate was a 7-day integrated measurement. It is tempting to say that SF6–based measurement is more or less a baseline value as it excludes influences of human activities, while the PFT-based measurement is a combination of the base ventilation rate and the effects of human behaviors. However, it does not explain why the PFT-based measurement was lower than the SF6-based measurement. It may be simply due to the underestimation of ventilation by the PFT-method, which is one of the characteristics of a long-term averaged method (Sherman, 1989).
For the PFT-based air exchange measurements, the most influential factor was the frequency of child’s bedroom window left open during the 7-day visit period. This indicates that the air
exchange rate estimated using PFT tests reflected occupant activities such as opening windows or doors. The observation was not surprising as PFT-based air exchange rates were intended to reflect the actual living conditions with minimal corrections over a week. Iwashita and Akasaka (1997) also reported that occupant behaviour may account for as much as 87 % of the total air change rate.
Occupant behaviours were not the most influential variables for SF6-based air exchange rates. Year of construction appears to be the most consistent and dominant factor that is associated with ventilation. There were clear positive associations between age of house and ventilation. The distinction was very clear when houses built after 2000 and those before 1930 were compared, although the number of houses in two categories was very different (4% built before 1930 vs. 31% built after 2000). In addition to building age, presence of mechanical ventilator and house volume were found to be associated with the SF6-based AERs. This indicates that SF6 test provides ventilation information that is more building-related. This is not unexpected as SF6 test was conducted while minimizing the occupant influences (e.g., closing all doors and windows) for a short time.
CONCLUSIONS
It can be concluded that the air exchange rates (AERs) from the PFT and SF6 technique may not be interchangeable. On average, the AER from the SF6 decay method was 33% greater than that from the passive PFT method in the field study involving 115 homes. The most influential variables were occupant-related (frequency of opening child’s bedroom window at night) and building-related (year of construction) for the PFT-based and SF6-based air exchange rate, respectively. Further research is recommended to understand the factors behind the apparent under-estimation by the PFT method.
It should be noted that the questionnaire data was not fully validated and needs to be considered as preliminary results. This study will be followed up by further analysis and interpretation of data, in particular, to investigate more diverse explanatory variables for air exchange rates. For example, the questionnaire includes more detailed information on ventilation and air conditioning system. In addition to the categorical variables, continuous variables such as outdoor-indoor temperature difference and relative humidity will be included as an explanatory variable. The validity of using the AER measured in the child’s bedroom for the whole house AER will also be further investigated by comparing the measurements conducted simultaneously in the child’s bedroom and the living room.
REFERENCES
ASHRAE (2005) ASHRAE Handbook: Fundamentals, Atalanta, GA.
Iwashita, G. and Akasaka, H. (1997) "The effects of human behavior on natural ventilation rate and indoor air environment in summer -- a field study in southern Japan", Energy and Buildings, 25, 195-205.
Sherman, M.H. (1989) "Analysis of errors associated with passive ventilation measurement techniques", Building and Environment, 24, 131-139.
US EPA (1989) Determination of air exchange rate in indoor air using perfluorocarbon tracer (PFT), Washington, DC, USA, EPA.
US EPA (1990) Determination of air exchange rate in indoor air using tracer gas, Washington, DC, USA, EPA.
Van Buggenhout, S., Van Brecht, A., Eren Özcan, S., Vranken, E., Van Malcot, W. and Berckmans, D. (2009) "Influence of sampling positions on accuracy of tracer gas measurements in ventilated spaces", Biosystems Engineering, 104, 216-223.