Publisher’s version / Version de l'éditeur:
The Journal of Physical Chemistry B, 114, 37, pp. 12036-12045, 2010
READ THESE TERMS AND CONDITIONS CAREFULLY BEFORE USING THIS WEBSITE.
https://nrc-publications.canada.ca/eng/copyright
Vous avez des questions? Nous pouvons vous aider. Pour communiquer directement avec un auteur, consultez la première page de la revue dans laquelle son article a été publié afin de trouver ses coordonnées. Si vous n’arrivez pas à les repérer, communiquez avec nous à [email protected].
Questions? Contact the NRC Publications Archive team at
[email protected]. If you wish to email the authors directly, please see the first page of the publication for their contact information.
NRC Publications Archive
Archives des publications du CNRC
This publication could be one of several versions: author’s original, accepted manuscript or the publisher’s version. / La version de cette publication peut être l’une des suivantes : la version prépublication de l’auteur, la version acceptée du manuscrit ou la version de l’éditeur.
For the publisher’s version, please access the DOI link below./ Pour consulter la version de l’éditeur, utilisez le lien DOI ci-dessous.
https://doi.org/10.1021/jp105708m
Access and use of this website and the material on it are subject to the Terms and Conditions set forth at
Phase separation and water channel formation in sulfonated block
copolyimide
Park, Chi Hoon; Lee, Chang Hyun; Sohn, Joon-Yong; Park, Ho Bum; Guiver,
Michael D.; Lee, Young Moo
https://publications-cnrc.canada.ca/fra/droits
L’accès à ce site Web et l’utilisation de son contenu sont assujettis aux conditions présentées dans le site LISEZ CES CONDITIONS ATTENTIVEMENT AVANT D’UTILISER CE SITE WEB.
NRC Publications Record / Notice d'Archives des publications de CNRC:
https://nrc-publications.canada.ca/eng/view/object/?id=8d7de2db-497c-4114-a4b2-c67045bf8c68 https://publications-cnrc.canada.ca/fra/voir/objet/?id=8d7de2db-497c-4114-a4b2-c67045bf8c68Phase Separation and Water Channel Formation in Sulfonated Block Copolyimide
Chi Hoon Park,†Chang Hyun Lee,†Joon-Yong Sohn,†,§Ho Bum Park,†,‡Michael D. Guiver,‡,⊥ and Young Moo Lee*,†,‡
School of Chemical Engineering, Hanyang UniVersity, Seoul 133-791, Korea, WCU Department of Energy Engineering, Hanyang UniVersity, Seoul 133-791, Korea, AdVanced Radiation Technology Institute, Korea Atomic Energy Research Institute, Jeongeup-si, Jeollabuk-do 580-185, Korea, and Institute for Chemical Process & EnVironmental Technology, National Research Council, Ottawa, Ontario K1A 0R6, Canada ReceiVed: June 21, 2010; ReVised Manuscript ReceiVed: August 11, 2010
We compared experimental and simulated data to investigate the phase separation and water channel formation of proton exchange membranes (PEMs) for fuel cell. Sulfonated block copolyimides (SPIs) were adopted as model polymers for experiments and simulations, and Nafion was used as a reference. Nafion and SPIs were observed to have different microscopic structures such as constituent atoms, backbone rigidity, and the locations of sulfonic acid groups, all of which significantly affect phenomenological properties at the macroscopic level such as density, water uptake, and proton conductivity. In particular, SPIs show much weaker microphase separation than Nafion, mainly due to the lower mobility of sulfonic acid groups and the existence of acceptable sites for hydrogen bonding even in hydrophobic segments, which impedes water channel formation for proton transport. As a result, the phase separation behavior and the resulting water channel formation are the major factors affecting macroscopic properties of PEMs such as water uptake and proton transport.
1. Introduction
Recent efforts to combat global warming include scientific and technical attempts to develop power sources that minimize the production of greenhouse gases such as carbon dioxide and methane that characterize the combustion of conventional fuels. One of the most promising candidates is the proton exchange membrane fuel cell (PEMFC), which exhibits high energy efficiency and low pollutant emissions, particularly when used for mobile and stationary applications.1,2
Proton exchange membranes (PEMs) play key roles in PEMFCs as polymer electrolytes to selectively transport protons. Nafion (DuPont, NC, U.S.A.) is a representative PEM, consist-ing of perfluorinated backbones and side chains endconsist-ing in sulfonic acid groups. Although developed in the 1960s, Nafion is still widely used due to its excellent chemical stability and proton conductivity. However, the cost of Nafion remains high because the polymerization process of perfluorinated polymer is complex and must be carried out under harsh conditions such as high temperature and high pressure.3-5 Moreover, the
mechanical stability and proton conductivity of Nafion can decrease when it is heated over 80 °C, owing to its low glass-transition temperature.4,5
To overcome these problems, sulfonated hydrocarbon PEMs have been investigated as alternatives.5-8In general, the costs
of hydrocarbon PEMs are lower than those of Nafion because hydrocarbon PEMs can be polymerized under mild conditions using cheap monomers. In addition, they maintain mechanical stability and proton conductivity over a wide temperature range due to their high thermal stability resulting from high glass-transition temperatures.4,5Despite these advantages, hydrocarbon
PEMs exhibit lower proton conductivities than Nafion consider-ing their higher ion exchange capacities (IECs). Accordconsider-ingly, IECs must be increased to obtain desirable levels of proton conductivity, but increase of IECs results in excessive water uptake and swelling ratio in hydrocarbon PEMs.9
The most widely accepted explanation for the differences in macroscopic properties between Nafion and hydrocarbon PEMs such as water uptake and proton conductivity is that they exhibit different water channel formation properties. Water channel formation affects pathways for proton transport under hydrated conditions (microphase separation). Nafion forms wider, more separated, less branched water channels than hydrocarbon PEMs due to stronger phase separation.9,10Accordingly, much research
has been devoted to understanding the structures of PEMs and their relationships to macroscopic properties.11,12However, the
previous reports exhibit a limitation to show the exact structure on a microscopic level despite their persuasive conclusions based on the experimental data.
Molecular simulations have gained attention as one of the powerful tools to elucidate the complex structures of PEMs. As molecular simulation can give various information about polymer morphology and structure-property relationships on atomistic and molecular levels, many papers dealing with surfactants,13,14biomaterials,15gas separation membranes,16-18
and related topics have been published. For PEMs, extensive studies have been carried out to investigate their peculiar structures and proton transport behavior.19,20Paddison used ab
initio strategy to study proton dissociation of the sulfonic acid group in triflic acid and p-toluene sulfonic acid, simulating Nafion and PEEKK models, respectively.21Later, he and Elliott
performed ab initio calculations to investigate proton dissociation of the short side chain of a perfluorosulfonic acid membrane such as Nafion and the resulting proton transfer with solvent molecules.22Vishnyakov and Neimark used molecular dynamics
(MD) simulation of the Nafion oligomer with water and/or methanol to study their solvation of sulfonic acid groups.23-25 * To whom correspondence should be addressed. Tel: +82-2-2220-0525.
E-mail: [email protected].
†School of Chemical Engineering, Hanyang University. §Korea Atomic Energy Research Institute.
‡WCU Department of Energy Engineering, Hanyang University. ⊥National Research Council.
J. Phys. Chem. B 2010, 114,12036–12045 12036
10.1021/jp105708m 2010 American Chemical Society Published on Web 08/24/2010
Voth’s group studied proton transport in water and Nafion based on the multistate empirical valence bond (MS-EVB) model to describe more exactly the Grotthuss hopping mechanism.26-29
Spohr investigated the effect on proton transport of charge delocalization in sulfonic acid groups using the modified EVB model by Kornyshev group.30,31However, most reports on PEMs
have focused on Nafion. Therefore, structural information on phase separation behaviors of hydrocarbon PEMs obtained using molecular simulation is rare.32
In the present study, sulfonated block copolyimides (SPIs) were chosen as representative hydrocarbon PEMs33-39to explore
the relationship among microscopic phase-separated structures, water channel formation, and macroscopic physical properties. We prepared SPIs with different compositions of hydrophilic and hydrophobic segments and characterized their densities, proton conductivities, and water uptakes. On the basis of the experimental data, molecular simulations were then performed, and the experimental and simulated data were compared. Nafion was used as a reference sample to compare phase separation properties and the resulting water channel formation. These comparisons of experimental and simulated data for PEMs provide valuable information on the design of hydrocarbon PEMs with the properties desired for a variety of applications. 2. Experimental Procedures
2.1. Materials.1,4,5,8-Naphthalenetetracarboxylic dianhy-dride (NTDA), triethylamine (Et3N), benzoic acid, and m-cresol
were purchased from Aldrich Chemical Co. (WI, U.S.A.) and used as received. 4,4′-Diaminodiphenyl ether (ODA) and 3,5-diaminobenzoic acid (DBA) were purchased from Tokyo Chemical Industry (TCI, Tokyo, Japan). 4,4′-Diaminodiphenyl ether-2,2′-disulfonic acid (SODA) was synthesized via direct sulfonation of ODA.40 DBA and SODA were sublimated
overnight at 80 °C in a vacuum oven before use.
2.2. Synthesis of Sulfonated Block Copolyimides.Table 1 shows the molecular compositions of the SPIs used in this paper. The hydrophilic segment contents ranged from 0.2 to 0.8 mol fraction. SPI-2 refers to SPIs with mole fractions of hydrophilic
and hydrophobic segments of 0.2 and 0.8, respectively. The synthetic route of SPI-2 is described in the next paragraph.33,41
For the formation of hydrophilic segments, 0.288 g (0.8 mmol) of SODA and 0.291 g (2.88 mmol) of Et3N were
completely dissolved into 4.2 g of m-cresol in a 250 mL three-neck flask under nitrogen atmosphere. Then, 0.322 g (1.2 mmol) of NTDA and 0.208 g (1.704 mmol) of benzoic acid were added and stirred vigorously at room temperature for 2 h. For the formation of hydrophobic segments, 2.422 g (3.2 mmol) of ODA, 0.680 g (6.72 mmol) of Et3N, and 9.8 g of m-cresol were
added into the above solution containing hydrophilic segments. After completely dissolving the ingredients into solution, the rest of the NTDA portion (0.751 g; 2.8 mmol) was introduced together with 0.486 g (3.976 mmol) of benzoic acid with consideration of their stoichiometry.
Then, the mixture was heated at 80 °C for 4 h and at 180 °C for 20 h. After casting onto a glass plate, the copolyimide solution was dried in an oven under vacuum conditions at 80 °C for 1 h and 150 °C for 10 h, successively. The cast films were soaked in 1 M MeOH aqueous solution at room temper-ature for 1 h to remove residual solvent. For the acidification of copolyimides in the triethylammonium salt form, the membranes were immersed in 1 M HCl aqueous solution at room temperature for 10 h and washed with deionized water to remove residual acid.
2.3. Characterization.Conventional titration methods (ASTM 2187) were used to measure ion exchange capacity (IEC). Dry membrane films (4 cm × 4 cm) were weighed and then immersed in a 0.01 N NaCl aqueous solution for 24 h. After protons were completely released from the sulfonic acid groups of the copolyimide membranes, the solution was titrated with a 0.01 N NaOH aqueous solution. The IEC values (meq g-1) were
calculated using the volume of the NaOH aqueous solution added in the acidic solution and the weight of each film.
Density was measured by buoyancy methods using a top-loading electronic Mettler Toledo Balance (Greifensee, Swit-zerland) with a density kit. The membrane samples were
TABLE 1: Model Construction Parameters
sample molar ratio composition
location of sulfonic acid group backbone structure name hydrophilic moieties hydrophobic moieties molecule molecular weight number of molecules ratio mass ratio volume ratio λa SPI-2 0.2 0.8 SPI 23222.7 1 83.2 80.0 13.0 water 18 260 16.8 20.0 SPI-3 0.3 0.7 SPI 24023.3 1 82.4 78.7 9.5 water 18 286 17.7 21.3 SPI-4 0.4 0.6 SPI 24823.8 1 81.5 77.2 7.9 water 18 314 18.6 22.8
main chain block copolymer SPI-5 0.5 0.5 SPI 25624.4 1 80.3 75.7 7.0 water 18 350 19.7 24.3 SPI-6 0.6 0.4 SPI 26425 1 77.4 72.8 7.5 water 18 450 22.6 27.2 SPI-7 0.7 0.3 SPI 27225.6 1 68.0 61.3 10.2 Water 18 713 32.1 38.7 SPI-8 0.8 0.2 SPI 28026.1 1 54.2 47.1 16.4 water 18 1314 45.8 52.9
side chain grafting polymer
Nafion-8 n/a n/a Nafion 22922.1 1 88.6 80.0 8.0
water 18 160 11.4 20.0
Nafion-16 n/a n/a Nafion 22922.1 1 79.8 67.0 16.0 water 18 320 20.2 33.0
aλ: the number of water molecules per sulfonic acid group.
weighed in air and deionized water at room temperature. The density was calculated using the following equation
where Wairand Wwaterare the weights of samples in air and water,
respectively.
Water uptake was measured using a dynamic vapor sorption analyzer (DVS- 1000, Surface Measurement System Ltd., London, U.K.) under 90% relative humidity (RH) at 25 °C (298 K). Water uptake (%) was obtained from the following equation
where Wwet and Wdry are weights of fully hydrated and dried
membranes, respectively.
Proton conductivity was measured at 25 °C (298 K) and under 95% RH conditions by a four-probe AC impedance method.42
The ohmic resistance (R) of membrane films was measured using an impedance/gain-phase analyzer (Solatron 1260; ONR, UK) and an electrochemical interface (Solatron 1287; ONR, UK). Proton conductivity (σ) was calculated using the following equation
where R is the ohmic resistance, l is the distance between reference electrodes, and S is the cross-sectional area of the membrane.
3. Simulation Procedures
3.1. Model Construction and Parametrization. Figure 1 shows the chemical structures and 3D models of the repeat units of Nafion and SPI. Specifically assigned charge and force field
typing procedures for each atom are described in Figure S1 of the Supporting Information. The commercial force field COM-PASS was used, and their potential parameters were listed in the literature.19,43,44All of the molecular simulations were carried
out using a Hewlett-Packard workstation and the Material Studio software package (Accelrys Inc., CA, U.S.A.).
SPIs chains with 50 repeat units and Nafion chains with 20 repeat units were built with varying compositions of hydrophilic and hydrophobic segments. For example, the SPI-2 chain consists of 10 sulfonated repeat units (the hydrophilic block) and 40 nonsulfonated repeat units (the hydrophobic block). Amorphous models were constructed at 298 K with one polymer chain to represent the nonhumidified condition or with one polymer chain and the corresponding hydronium/water mol-ecules to represent the humidified condition under periodic boundary conditions using Amorphous Cell modules in Material Studio. Table 1 outlines the model construction parameters, such as the mole ratio and compositions for polymer chain building and amorphous cell generation. The initial target densities of Nafion and SPI cells were 1.5 and 1.2 g cm-3, respectively.
For SPI cells, the option of ramp density from an initial value of 0.3 g cm-3was selected to avoid cell generation failure due
to the rigid structure of polyimide. Each cell was followed by the energy minimization step via the smart minimizer method, which is a combination of the steepest descent, conjugated gradient, and Newton methods in a cascade, where the conver-gence levels were set to 1000 kcal mol-1Å-1, 10 kcal mol-1,
and 0.1 kcal mol-1, respectively.
3.2. Molecular Dynamics (MD) Simulation.Using energy-minimized amorphous cells of Nafion and SPIs, molecular dynamics (MD) simulations were performed using a time step of 1.0 fs for equilibrating the cells and obtaining the final densities. The Ewald summation method was used to calculate the nonbond interactions (electrostatic and van der Waals) with an accuracy of 0.001 kcal mol-1. The Berendsen algorithm set
to a decay constant of 0.1 ps was used to control the temperature and pressure of each cell. Specific MD simulation procedures Figure 1. Chemical structures and 3D models of (a) Nafion and (b) SPIs.
Density(g cm-3) ) FwaterWair/(Wair- Wwater) (1)
Water uptake(%) ) (Wwet- Wdry)/Wdry× 100 (2)
σ(S cm-1) ) l/(RS) (3)
are as follows: (1) NPT (a constant particle number, pressure, and temperature) MD simulation at 400 K and 1 bar for 50 ps, (2) NPT MD simulation at 298 K and 1 bar for 50 ps, and (3) NVT (a constant particle number, volume, and temperature) MD simulation at 298 K for 10 ps. After comparing the simulated and the experimental densities, most SPIs had about 7% lower values, and therefore, further MD simulations were performed: (4) NPT MD simulation at 298 K and 10000 bar for 50 ps, (5) NVT MD simulation at 600 K for 20 ps, (6) NVT MD simulation at 298 K for 20 ps, and (6) NPT MD simulation at 298 K and 1 bar for 50 ps. Steps 4-7 were repeated until the simulated density and density changing rates had converged to within 3%. Finally, NVT MD simulation was carried out at 298 K for 10 ps for production of the SPI models. To evaluate the mobility of sulfonic acid groups and the proton in the hydronium form, NPT MD simulation was performed at 298 K at 1 bar for 1.2 ns.
We were unable to obtain experimental densities for humidi-fied models due to limitations of the buoyancy method for density measurement that we used in this study. Accordingly, MD simulations for the humidified model were performed following the procedures described above without comparison of densities.
3.3. Model Analyses and Property Calculations.Structural analyses were performed using the trajectory files of the final NVT MD simulations. The fractional free volume (FFV)45was
calculated according to the following equation
where Vtotalis the total volume of the unit cell and VvdWis the
van der Waals volume of the polymer chain, with both values obtained from the simulated models with the lowest energy.
Diffusivities (D) were calculated using the Einstein equation16,46
where ri(t) and ri(0) are the position vectors of atom R at time
tand 0, respectively. Here, mean-square displacement (MSD), ∑i)1NR 〈[ri(t) - ri(0)]2〉, represents the average of all chosen atoms of time origin in a dynamics trajectory, which was also used to compare the motilities of functional groups as well as to calculate diffusivities of protons.
4. Results and Discussion
4.1. Model Verification and Structural Properties.Nafion and SPIs have different polymer structures, as shown in Figure 1. As mentioned above, the main backbone of Nafion is a linear perfluorinated alkyl chain, and the sulfonic acid groups are located at the end of the side chain (Figure 1a), whereas SPIs have rigid aromatic backbones containing six-membered rings in the repeat unit, and the sulfonic acid groups are directly attached to phenyl rings in the main chain (Figure 1b). These structural distinctions affect not only properties that can be observed during experiments but also the model construction procedure that enables one to obtain reasonable properties for simulation studies.
The experimental and simulated densities of Nafion and SPIs are shown in Table 2. For Nafion, the simulated density quickly converged within a reasonable range, 3% of the experimental density, after simple NPT MD simulation steps at 400 and 298
K. However, for SPIs, large differences (over 7%) remained between simulated and experimental densities even after the same MD steps were applied due to rigidity and ring catenation and spearing problems. To minimize these errors in density, the compression and relaxation algorithm for packing models used by Dr. Hofmann’s group16,18 was modified and applied.
Finally, the simulated densities of SPIs were in good agreement with the experimental ones, within a 3% deviation.
The degree of sulfonation (DS) and density are known to exhibit a proportional relationship in sulfonated polymers.33,47,48
Our results are consistent with this observation, as shown in Table 2, but do not have the completely linear correlation between densities and the DS that is demonstrated in Figure 2, in which the density increases linearly with the increase in DS and then its rate of increase is reduced after a certain point, SPI-5. To explain this unexpected trend, the structural properties were further analyzed using the simulated results presented in Table 2. In general, the density of the polymer is initially affected by the atomic weights of constituent atoms. For example, Nafion consisting of fluorine atoms with heavy atomic weight has about 50% higher density than SPI-2 that has similar molecular weights (about 23 kDa; Table 1). However, as shown in Figures 2 and 3, although the molecular weights of SPIs increase linearly according to increases of the number of sulfonic acid groups, their densities show two different slopes at around a 0.5 molar ratio of hydrophilic content due to nonlinear increases of total volumes of simulated unit cells. Accordingly, other factors affecting volume should be investigated, such as the strength of interactions like hydrogen bonding between
FFV ) (Vtotal- 1.3VvdW)/Vtotal (4) D ) 1 6NRlimtf∞ d dt
∑
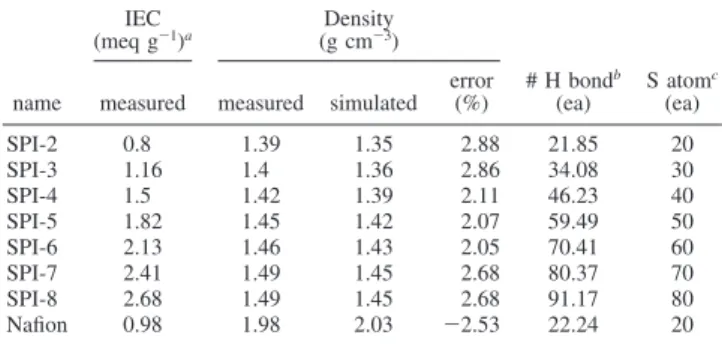
i)1 NR 〈[ri(t) - ri(0)]2〉 (5)TABLE 2: Model Verification and Structural Properties
IEC
(meq g-1)a (g cmDensity-3)
name measured measured simulated error (%) # H bondb (ea) S atomc (ea) SPI-2 0.8 1.39 1.35 2.88 21.85 20 SPI-3 1.16 1.4 1.36 2.86 34.08 30 SPI-4 1.5 1.42 1.39 2.11 46.23 40 SPI-5 1.82 1.45 1.42 2.07 59.49 50 SPI-6 2.13 1.46 1.43 2.05 70.41 60 SPI-7 2.41 1.49 1.45 2.68 80.37 70 SPI-8 2.68 1.49 1.45 2.68 91.17 80 Nafion 0.98 1.98 2.03 -2.53 22.24 20
aIEC (ion exchange capacity): the equivalent weights of sulfonic
acid groups per polymer gram. b# H-bond: the average number of
hydrogen bonds in simulated cells. Acceptor: N, O, S, and halogen atoms. Maximum hydrogen-acceptor distance: 2.5 Å.cS atom: the
number of sulfonic acid groups in the simulated cells.
Figure 2. Simulated density comparison of SPIs.
constituent molecules or atoms. Hydrogen bonding plays a particularly important role as strong physical interaction among the inter- or intramolecular interactions in molecules with polar atoms.23,24,29,49As a result, the consideration of hydrogen bonding
in SPIs having sulfonic acid groups can provide valuable information in understanding the contribution of a second factor on their densities. Figure 4 shows the number of hydrogen bondings per sulfonic acid group (#H-bondings/SO3H) in PEMs.
At first, #H-bondings/SO3H increases as the number of sulfonic
acid groups increases. However, after SPI-5, as the number of hydrophilic segments becomes greater than that of hydrophobic segments in a polymer chain, #H-bondings/SO3H decreases due
to the saturation of hydrogen bondings between sulfonic acid groups, which in turn weakens intermolecular interactions limiting the expansion of total volume. As a result, the increase in densities (molecular weight/total volume) of SPIs decelerates after SPI-5. In particular, this peculiar behavior about the reduction of #H-bondings/SO3H gives very interesting
informa-tion about water uptake of SPIs, which will be further discussed in the following section 4.2.
4.2. Water Uptake. Water uptake is one of the most important macroscopic properties of PEMs because water channel formation is essential for proton transportation. Gener-ally, PEMs with high water uptake exhibit good proton conduction. However, excessively swollen membranes are too weak to be employed in fuel cell system. Moreover, when the membranes are used in the system, it is impossible to obtain high electrochemical fuel cell performances for a long time because of the critical delamination in the interfaces between
those membranes and electrodes. It indicates that water uptake level control is an important issue to develop high-performance PEM materials.
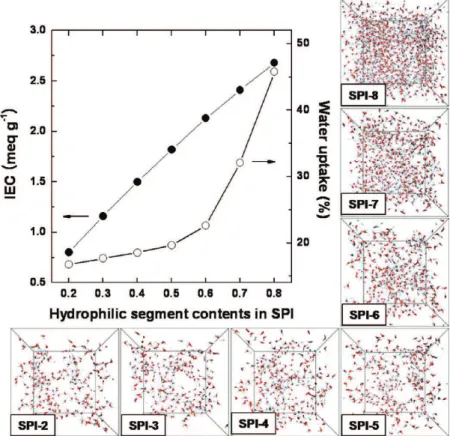
The water uptakes for the PEMs examined under 90% RH at 25 °C in this study, according to ion exchange capacities (IECs) and the distributions of water molecules, are shown in Figure 5. IECs are proportional to the number of sulfonic acid groups due to their definition (i.e., the mole equivalent of sulfonic acid groups per polymer gram).50 However, water
uptake increases gradually from SPI-2 to SPI-5, and then increases drastically for SPI-7 and SPI-8, as shown in Table 1. The mass ratio of water is about 17% higher at SPI-5 than that at SPI-2, but the ratios drastically increase by 35, 91, and 173% at SPI-6, SPI-7, and SPI-8, respectively, as compared to SPI-2. We studied the distributions of sulfonic acid groups to elucidate the relationships between water uptakes and PEM structures because water molecules are usually located in the vicinity of sulfonic acid groups in PEM chains and make hydrogen bonds with the fixed charged ions. Figure 6 shows the intermolecular pair correlation functions of sulfur atoms in SPIs without water molecules for nonhumidified conditions. The pair correlation function, also called the radial distribution function, indicates the probability of finding a particle A at a certain distance r from another particle B, which can give useful information about the distribution of particles such as atoms or molecules.20,51 As shown in Figure 6, the distances between
sulfur atoms located in another polymer chain decrease from SPI-2 to SPI-5 since more sulfonic acid groups occupy the simulated cells. However, as the ratio of hydrophilic segments with sulfonic acid groups becomes higher than that of hydro-phobic segments, the distances between sulfur atoms can no longer be closer (less than 3.5 Å). Instead, sulfonic acid groups acting as water attractive sites become more uniformly distrib-uted through the SPI cells, as indicated in Figure 6, where the graphs become flatter after SPI-5. Consequently, after hydration, the denser packing of water/sulfonic acid group clusters indu-ces the percolation behavior of water uptake,52,53which explains
the resulting exponential shape observed in Figure 5. Moreover, as #H-bondings/SO3H decreases after SPI-5 (as discussed in
section 4.1), more sulfonic acid groups are available in SPI-6, SPI-7, and SPI-8 to interact with water molecules through hydrogen bondings.
4.3. Phase Separation and Water Channel Morphology. Phase separation between hydrophilic segments including water molecules and hydrophobic segments in PEMs and the resulting water channel morphology are the most important factors controlling macroscopic characteristics such as water uptake, water swelling, and proton conductivity, which in turn are significantly affected by microscopic PEM structures such as constituent atoms, backbone structures, and the locations of sulfonic acid groups.
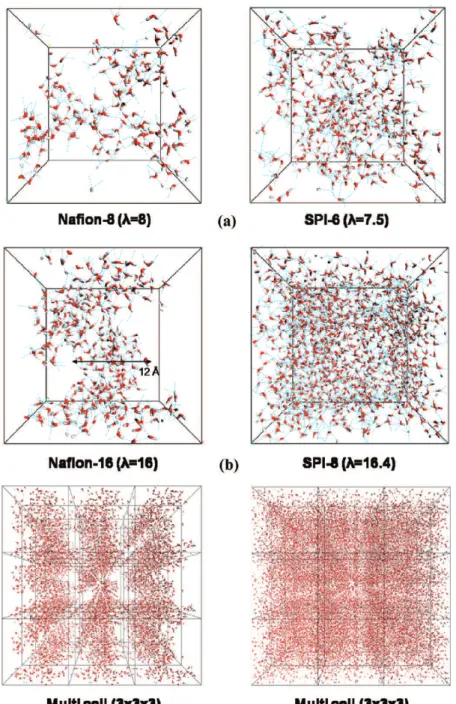
Figure 7 shows the distribution of water molecules in Nafion and SPIs according to their λ values (i.e., the number of water molecules per sulfonic acid group). Here, two absorbed water models with similar λ values (about 8 and 16) were selected among the respective SPI and Nafion models. Nafion-8 and Nafion-16 have the same structure, including the same number of sulfonic acid groups, but the only difference is the ratio of water molecules and Nafion, λ ) 8 (partially hydrated) and 16 (fully hydrated), respectively. When comparing Nafion and SPIs with similar λ values, we observe a remarkable contrast in water channel morphology. For λ ) ∼8, as shown in Figure 7a, Nafion (λ ) 8) forms strong phase separation and well-defined water channels despite having a relatively low λ value, whereas SPI-6 Figure 3. Gravimetric and volumetric analysis of SPIs.
Figure 4. Number of hydrogen bondings per sulfonic acid group in SPIs.
(λ ) 7.5) cannot form such distinct water channels despite higher mass and volume ratios of water molecules in the cell. The trends described above become even clearer when the λ value increases to 16, as shown in Figure 7b. For fully hydrated Nafion (λ ) 16), stronger phase separation and more separated water channels are observed than even those for Nafion (λ ) 8). However, water molecules are distributed through the SPI-8 cell in a disordered fashion, despite over 200 and 60% higher mass and volume ratios of water molecules in SPI-8 (λ ) 16.4) than those in Nafion (λ ) 16), respectively. The difference in water channel formation can be observed more conspicuously with expanded multicells (3 × 3 × 3) of Nafion and SPI.
In addition to the above morphological differences, Figure 8 shows the intermolecular pair correlation function of all atoms in the water channel in Nafion and SPIs cells under humidified conditions. In this paper, water channels in PEMs are supposed to consist of water molecules and hydronium ions, which means that the probability of finding other water molecules or
hydronium ions is strongly related to their density distribution in water channels. For example, if water molecules and hydronium ions form water channels or clusters with a diameter of r, the probability of finding another becomes higher and more concentrated over the range. Hydronium ions, H3O+, are one
of the complex forms of water molecules and protons and play an important role in proton transport, which will be further discussed in section 4.4. As shown in Figure 8, all peaks show their highest value within a range of 1.5-4 Å, irrespective of PEM types, which represents the distance from atoms in water molecules or hydronium ions to the atoms in the second coordinated ones. However, for SPIs, the probability becomes rapidly lower and flatter after 4 Å. In particular, the differences in peak intensities before and after 4 Å were significantly reduced in SPIs as water uptake increased exponentially, which means that water molecules and hydronium ions were uniformly distributed through the SPI cells without distinct water channel formation. In contrast, for Nafion, the probability was slowly reduced after 4 Å to over 12 Å, indicating that a higher ratio of water molecules and hydronium ions is located within a distance of about 12 Å in Nafion than that in SPIs, as shown in Figure 7b, not uniformly distributed through the cell.
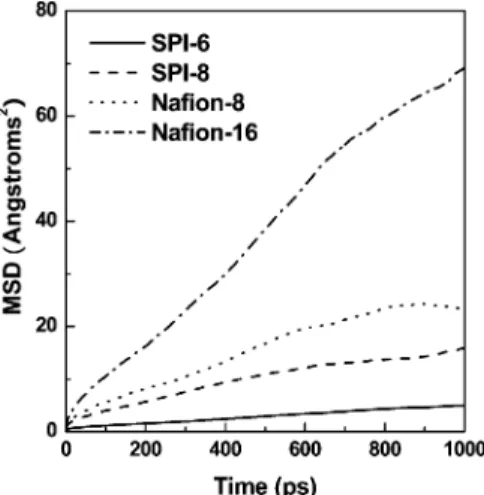
One of the possible explanations for the strong phase separation in Nafion is the mobility of sulfonic acid groups. Figure 9 shows the MSD of sulfur atoms in Nafion and SPIs, indicating the mobility of sulfonic acid groups or hydrophilic moieties containing the sulfonic acid groups in the each system. Under humidified conditions, the sulfur atoms in Nafion-16 and even those in Nafion-8 have much higher mobility than those in SPIs, although SPI-8 has many more water molecules which can act as plasticizers. In particular, the slope in Nafion 16 is almost five times higher than that in SPI-8 under humidified conditions. This slow polymer chain movement limiting the mobility of sulfonic acid groups in the SPI system is owed to Figure 5. Experimental water uptake and simulated water molecule distribution in SPIs. Colors: red (O), white (H), blue line (hydrogen bonding).
Figure 6. Intermolecular pair correlation function of sulfur atoms in nonhumidified SPIs.
its rigid chemical architecture as shown in Figure 1b. All SPIs are composed of rigid aromatic rings including naphthalene rings. The sulfonic acid groups were directly attached to the phenyl rings. Thus, the mobility of sulfonic acid groups in SPIs was severely hindered as compared to that in Nafion with sulfonic acid groups located at the terminal ends of its flexible aliphatic side chains, as shown in Figure 1a.
The constituent atoms that strengthen or weaken the interac-tions with water molecules also affect phase separation behavior in PEMs. For strong phase separation, interactions between atoms and water molecules are favorable in hydrophilic seg-ments but not in hydrophobic segseg-ments. For Nafion, Devanathan et al. demonstrated that the water molecules were inaccessible to the hydrophobic segment.54The atoms in the backbone have
much less affinity to water molecules due to the symmetrical arrangement of fluorine atoms around the carbon backbone (i.e., net dipole moment is 0), whereas oxygen atoms and some fluorine atoms in the hydrophilic side chains can form hydrogen
Figure 7. Comparison of the water molecule distributions in Nafion and SPIs with the similar λ values; (a) λ ) about 8 and (b) λ ) about 16. Colors: red (O), white (H), blue line (hydrogen bonding).
Figure 8. Intermolecular pair correlation function of all atoms in water/ hydronium molecules in humidified Nafion and SPIs.
bonds with water molecules. In contrast, SPIs have oxygen atoms even in the hydrophobic segments due to imide linkages and ether linkages, which can interact with water molecules via hydrogen bonds, as shown in Figure 10.
The effects of these structural differences are investigated more specifically in Figure 11. The probability of finding water molecules in the hydrophobic segments of SPIs rapidly increases to 4 Å and then shows almost saturated values regardless of their sulfonation levels, whereas the probability of finding water molecules in the hydrophobic segments of Nafion slowly increases and reaches the highest value at 11 Å. Consequently, there are much fewer water molecules penetrating into hydro-phobic segments in Nafion, and therefore, Nafion shows much stronger phase separation behavior than SPIs.
4.4. Proton Transport Behavior.Figure 12 illustrates the proton conductivity and water uptake properties of SPIs. In many cases, the diffusion or transport properties are explained by percolation theory.52,53Here, proton conductivity of SPIs also
shows percolation behavior, drastically increasing at a certain point, SPI-6, with the increase of DS, as shown in Figure 12. However, although water uptake has a strong relationship with proton conductivity and also shows percolation behavior as discussed in section 4.2, its trend is very different from that of proton conductivity, particularly from SPI-5 to SPI-8, where the number of hydrophilic segments is higher than that of hydrophobic segments. To explain these behaviors, an under-standing of proton transport mechanisms is required. There are two mechanisms, the vehicle mechanism and the hopping (or Grotthus) mechanism, that are widely accepted to explain proton transport behavior in PEMs.55-57 In the vehicle mechanism,
protons are transported through water channels in complex forms with water molecules such as H3O+, H5O2+, and H9O4+.
Accordingly, the effects of water uptake on proton conductivity can be explained via the vehicle mechanism. The hopping (or Grotthus) mechanism postulates that protons are transported by bond making and breaking with proton carriers such as sulfonic acid groups and water molecules via hydrogen bonding.
Figure 13 shows the simulated diffusivities of hydronium ions in SPI cells. In this simulation, a classical MD method was adopted using nondissociable hydronium ions (H3O+) as
rep-resentatives of the complex forms of protons and water for the purposes of simulation. Here, the diffusivities of hydronium ions Figure 9. Mobility comparison of sulfur atoms in the sulfonic acid
group of Nafion and the SPI under humidified conditions.
Figure 10. Snapshot of water molecules coordinated with the hydrophobic block in humidified SPIs. Colors: gray (C), red (O), white (H), blue (N).
Figure 11. Intermolecular pair correlation function of all atoms in water/hydronium molecules and all atoms in hydrophobic blocks in humidified Nafion and SPIs.
Figure 12. Comparison of experimental proton conductivity and water uptake of SPIs at 25 °C (298 K).
Figure 13. Diffusivity of hydronium ions in SPIs at 298 K. J. Phys. Chem. B, Vol. 114, No. 37, 2010 12043
in Nafion (2.6 × 10⁻⁶cm2s-1in Nafion (λ ) 16)) were included
as references, which are reasonably similar to the previously reported simulation results (0.68 × 10⁻⁶cm2s-1at 300 K (λ )
16)20and 1.15 × 10⁻⁶cm2s-1at 300 K (λ ) 15)58). As shown
in Figure 13, the diffusivity of hydronium ions exhibits similar trends to water uptake behavior because the proton transport mechanism in classical MD simulations is based on the vehicle mechanism. Actually, classical MD simulations have limited abilities to describe the hopping mechanism in which proton transport occurs via bond making and breaking because they do not adequately model electron-level reactions (i.e., bond making and breaking).20,59 As discussed in the Introduction,
many studies were performed to describe the hopping mecha-nism and obtained reasonable results.26-30 However, because
this study mainly focuses on the PEM morphology under hydrated conditions, such a model using excess protons is not applied. As a result, the diffusivity of Nafion in simulations is lower than that from the experimental results (about 7 × 10⁻⁶
cm2s-1 at 303.15 K60) due to the absence of the additional
driving force of the hopping mechanism. Accordingly, further analyses should be performed to explain the differences between proton conductivity and water uptake.
Intermolecular pair correlation functions of sulfur atoms in humidified SPIs are shown in Figure 14. In the hopping mechanism, as the hydrogen bonding acceptable sites such as sulfonic acid groups play an important role as proton carriers, their location is thought to affect proton transport significantly. As the DS increases, the distances between sulfur atoms become closer from SPI-2 to SPI-6 because water uptake increases more slowly than does the number of sulfonic acid groups. However, as water uptake drastically increases after SPI-6, the distance also increases, and the distribution of sulfur atoms becomes homogeneous. As a result, with SPI-6 as a critical point, sulfonic acid groups distribute more closely and more homogeneously than in SPI-5, enabling a percolation jump in proton conductivity between SPI-5 and SPI-6 via the hopping mechanism. 5. Conclusions
On the basis of experimental data for Nafion and the SPIs, molecular simulations were successfully performed to study structure-property relationships in PEMs, demonstrating density deviations within 3%. The constituent atoms and the number of hydrogen bonds were found to be very important factors governing densities. The water uptake of SPIs increases drasti-cally after SPI-6, probably due to the distribution of sulfonic acid groups in SPIs. Nafion has stronger phase separation than SPI, and the resulting water channel formation facilitated by
the higher mobility of sulfonic acid groups and water inacces-sibility to hydrophobic segments is a key factor explaining the differences in proton transport between Nafion and SPIs. We observed that proton transport shows percolation behavior, and this observation may be explained via the hopping mechanism as well as the vehicle mechanism.
Acknowledgment.This research was supported by the WCU (World Class University) program through the National Re-search Foundation funded by the Ministry of Education, Science and Technology (R31-2008-000-10092).
Supporting Information Available: Force field typing and partial charge assignment of Nafion and sulfonated block copolyimides (SPIs). This material is available free of charge via the Internet at http://pubs.acs.org.
References and Notes
(1) Larminie, J.; Dicks, A. Fuel Cell Systems Explained, 2nd ed.; Wiley: West Sussex, U.K., 2003.
(2) Steele, B. C. H.; Heinzel, A. Nature 2001, 414, 345–352. (3) Souzy, R.; Ameduri, B. Prog. Polym. Sci. 2005, 30, 644–687. (4) Liu, B.; Kim, D.-S.; Guiver, M. D.; Kim, Y. S.; Pivovar, B. S. In
Membranes for Energy ConVersion; Peinemann, K.-V., Nunes, S. P., Eds.;
Wiley-VCH Verlag GmbH & Co. KGaA: Weinheim, Germany, 2008; Vol. 2, pp 1-45.
(5) Hickner, M. A.; Ghassemi, H.; Kim, Y. S.; Einsla, B. R.; McGrath, J. E. Chem. ReV. 2004, 104, 4587–4612.
(6) Savadogo, O. J. New Mater. Electrochem. Syst. 1998, 1, 47. (7) Maier, G.; Meier-Haack, J. In Fuel Cells II; Scherer, G. G., Ed.; Springer: Berlin/Heidelberg, Germany, 2008; Vol. 216, pp 1-62.
(8) Kreuer, K. D. In Handbook of Fuel CellssFundamentals,
Technol-ogy and Applications; Vielstich, W., Lamm, A., Gasteiger, H. A., Eds.; John Wiley & Sons Ltd: Chichester, U.K., 2003; Vol. 3, pp 420-435.
(9) Kreuer, K. D. J. Membr. Sci. 2001, 185, 29–39.
(10) Mauritz, K. A.; Moore, R. B. Chem. ReV. 2004, 104, 4535–4585. (11) Kim, Y. S.; Einsla, B.; Sankir, M.; Harrison, W.; Pivovar, B. S.
Polymer 2006, 47, 4026–4035.
(12) Takimoto, N.; Wu, L.; Ohira, A.; Takeoka, Y.; Rikukawa, M.
Polymer 2009, 50, 534–540.
(13) Ryjkina, E.; Kuhn, H.; Rehage, H.; Mu¨ller, F.; Peggau, J. Angew.
Chem., Int. Ed. 2002, 41, 983–986.
(14) van Vlimmeren, B. A. C.; Maurits, N. M.; Zvelindovsky, A. V.; Sevink, G. J. A.; Fraaije, J. G. E. M. Macromolecules 1999, 32, 646–656. (15) Brovchenko, I.; Krukau, A.; Oleinikova, A.; Mazur, A. K. J. Am.
Chem. Soc. 2008, 130, 121–131.
(16) Hofman, D.; Ulbrich, J.; Fritsch, D.; Paul, D. Polymer 1996, 37, 4773–4785.
(17) Galperin, D. Y.; Khokhlov, A. R. Macromol. Theory Simul. 2006,
15, 137–146.
(18) Heuchel, M.; Hofmann, D.; Pullumbi, P. Macromolecules 2004,
37, 201–214.
(19) Wescott, J. T.; Qi, Y.; Subramanian, L.; Capehart, T. W. J. Chem.
Phys. 2006, 124, 134702.
(20) Venkatnathan, A.; Devanathan, R.; Dupuis, M. J. Phys. Chem. B
2007, 111, 7234–7244.
(21) Paddison, S. J. J. New Mater. Electrochem. Syst. 2001, 4, 197– 207.
(22) Paddison, S. J.; Elliott, J. A. J. Phys. Chem. A 2005, 109, 7583– 7593.
(23) Vishnyakov, A.; Neimark, A. V. J. Phys. Chem. B 2000, 104, 4471– 4478.
(24) Vishnyakov, A.; Neimark, A. V. J. Phys. Chem. B 2001, 105, 7830– 7834.
(25) Vishnyakov, A.; Neimark, A. V. J. Phys. Chem. B 2001, 105, 9586– 9594.
(26) Schmitt, U. W.; Voth, G. A. J. Phys. Chem. B 1998, 102, 5547– 5551.
(27) Day, T. J. F.; Soudackov, A. V.; Cˇ uma, M.; Schmitt, U. W.; Voth, G. A. J. Chem. Phys. 2002, 117, 5839–5849.
(28) Petersen, M. K.; Wang, F.; Blake, N. P.; Metiu, H.; Voth, G. A. J.
Phys. Chem. B 2005, 109, 3727–3730.
(29) Petersen, M. K.; Voth, G. A. J. Phys. Chem. B 2006, 110, 18594– 18600.
(30) Spohr, E.; Commer, P.; Kornyshev, A. A. J. Phys. Chem. B 2002,
106, 10560–10569.
(31) Walbran, S.; Kornyshev, A. A. J. Chem. Phys. 2001, 114, 10039– 10048.
Figure 14. Intermolecular pair correlation function of sulfur atoms in humidified SPIs.
(32) Komarov, P. V.; Veselov, I. N.; Chu, P. P.; Khalatur, P. G.; Khokhlov, A. R. Chem. Phys. Lett. 2010, 487, 291–296.
(33) Piroux, F.; Espuche, E.; Mercier, R.; Pin?i, M. J. Membr. Sci. 2003,
223, 127–139.
(34) Yin, Y.; Yamada, O.; Tanaka, K.; Okamoto, K. I. Polymer J. 2006,
38, 197–219.
(35) Fang, J.; Zhai, F.; Guo, X.; Xu, H.; Okamoto, K. I. J. Mater. Chem.
2007, 17, 1102–1108.
(36) Lee, C. H.; Park, C. H.; Lee, Y. M. J. Membr. Sci. 2008, 313, 199–206.
(37) Asano, N.; Miyatake, K.; Watanabe, M. J. Polym. Sci., Part A:
Polym. Chem. 2006, 44, 2744–2748.
(38) Miyatake, K.; Zhou, H.; Watanabe, M. Macromolecules 2004, 37, 4956–4960.
(39) Miyatake, K.; Zhou, H.; Matsuo, T.; Uchida, H.; Watanabe, M.
Macromolecules 2004, 37, 4961–4966.
(40) Fang, J.; Guo, X.; Harada, S.; Watari, T.; Tanaka, K.; Kita, H.; Okamoto, K.-i. Macromolecules 2002, 35, 9022–9028.
(41) Vallejo, E.; Pourcelly, G.; Gavach, C.; Mercier, R.; Pineri, M. J.
Membr. Sci. 1999, 160, 127–137.
(42) Lee, C. H.; Park, H. B.; Lee, Y. M.; Lee, R. D. Ind. Eng. Chem.
Res. 2005, 44, 7617–7626.
(43) Yang, J.; Ren, Y.; Tian, A.; Sun, H. J. Phys. Chem. B 2000, 104, 4951–4957.
(44) Sun, H. J. Phys. Chem. B 1998, 102, 7338–7364.
(45) Bondi, A. A. Physical properties of molecular crystals, liquids,
and glasses; Wiley: New York, 1968.
(46) Material studio online help; Accelrys Software Inc.: San Diego, 2008.
(47) Watari, T.; Wang, H.; Kuwahara, K.; Tanaka, K.; Kita, H.; Okamoto, K. I. J. Membr. Sci. 2003, 219, 137–147.
(48) Andzelm, J.; Sloan, J.; Napadensky, E.; McKnight, S.; Rigby, D.
Mol. Simul. 2006, 32, 163–172.
(49) Holzmann, J.; Ludwig, R.; Geiger, A.; Paschek, D. Angew. Chem.,
Int. Ed. 2007, 46, 8907–8911.
(50) Park, C. H.; Kim, H. K.; Lee, C. H.; Park, H. B.; Lee, Y. M. J.
Power Sources 2009, 194, 646–654.
(51) Vasudevan, V. J.; McGrath, J. E. Macromolecules 1996, 29, 637– 645.
(52) Park, H. B.; Ha, S. Y.; Lee, Y. M. J. Membr. Sci. 2000, 177, 143– 152.
(53) Hsu, W. Y.; Barkley, J. R.; Meakin, P. Macromolecules 1980, 13, 198–200.
(54) Devanathan, R.; Venkatnathan, A.; Dupuis, M. J. Phys. Chem. B
2007, 111, 8069–8079.
(55) Kreuer, K.-D.; Paddison, S. J.; Spohr, E.; Schuster, M. Chem. ReV.
2004, 104, 4637–4678.
(56) Kreuer, K. D. Chem. Mater. 1996, 8, 610–641.
(57) Park, C. H.; Shin, D. W.; Lee, Y. M.; Kang, P. H.; Nho, Y. C.
Macromol. Res. 2009, 17, 825–828.
(58) Jang, S. S.; Molinero, V.; C¸ agˇin, T.; Goddard Iii, W. A. J. Phys.
Chem. B 2004, 108, 3149–3157.
(59) Cukierman, S. Biochim. Biophys. Acta 2006, 1757, 876–885. (60) Zawodzinski, T. A.; Davey, J.; Valerio, J.; Gottesfeld, S.
Electro-chim. Acta 1995, 40, 297–302. JP105708M