Publisher’s version / Version de l'éditeur:
Vous avez des questions? Nous pouvons vous aider. Pour communiquer directement avec un auteur, consultez la
première page de la revue dans laquelle son article a été publié afin de trouver ses coordonnées. Si vous n’arrivez pas à les repérer, communiquez avec nous à PublicationsArchive-ArchivesPublications@nrc-cnrc.gc.ca.
Questions? Contact the NRC Publications Archive team at
PublicationsArchive-ArchivesPublications@nrc-cnrc.gc.ca. If you wish to email the authors directly, please see the first page of the publication for their contact information.
https://publications-cnrc.canada.ca/fra/droits
L’accès à ce site Web et l’utilisation de son contenu sont assujettis aux conditions présentées dans le site LISEZ CES CONDITIONS ATTENTIVEMENT AVANT D’UTILISER CE SITE WEB.
13th Annual Conference of the Computational Fluid Dynamics Society of Canada
[Proceedings], pp. 1-7, 2005-07-01
READ THESE TERMS AND CONDITIONS CAREFULLY BEFORE USING THIS WEBSITE.
https://nrc-publications.canada.ca/eng/copyright
NRC Publications Archive Record / Notice des Archives des publications du CNRC :
https://nrc-publications.canada.ca/eng/view/object/?id=5578ead2-29c5-46f6-8a62-4a7c195b964d https://publications-cnrc.canada.ca/fra/voir/objet/?id=5578ead2-29c5-46f6-8a62-4a7c195b964d
NRC Publications Archive
Archives des publications du CNRC
This publication could be one of several versions: author’s original, accepted manuscript or the publisher’s version. / La version de cette publication peut être l’une des suivantes : la version prépublication de l’auteur, la version acceptée du manuscrit ou la version de l’éditeur.
Access and use of this website and the material on it are subject to the Terms and Conditions set forth at
CFD investigation of balcony spill plumes in atria (Part II)
http://irc.nrc-cnrc.gc.ca
N a t i o n a l R e s e a r c h C o u n c i l C a n a d a
CFD inve st igat ion of ba lc ony
spill plum e s in a t ria (Pa r t I I )
N R C C - 4 8 1 5 3
M c C a r t n e y , C . J . ; L o u g h e e d ,
G . D . ; W e c k m a n , E . J .
A version of this document is published in / Une version de ce
document se trouve dans:
13
thAnnual Conference of the Computational Fluid
Dynamics Society of Canada, St. John’s, Nfld.,
July 31-Aug. 3, 2005, pp. 1-7
CFD Investigation of Balcony Spill Plumes in Atria (Part II)
C. J. McCartney
1, G. D. Lougheed
1and E. J. Weckman
2 1Institute for Research in Construction, National Research Council Canada Ottawa, ON, K1A 0R6, Canada
2
Department of Mechanical Engineering, University of Waterloo Waterloo, ON, N2L 3G1, Canada
Email: cameron.mccartney@nrc-cnrc.gc.ca
A
BSTRACTThis paper proposes an integrated method for using experimental data and CFD modeling to develop engineering correlations for atrium smoke management. Part I focused on the experimental program and validation of a CFD model of the experimental facility. Part II describes the extension of this model to a parametric study of balcony spill plumes.
Smoke management in buildings during fire events often uses mechanical ventilation systems to maintain smoke layer elevation above a safe evacuation path. Design of these systems requires accurate correlations for the smoke production or mass flow rate of the buoyant fire plume. One design issue is the mass flow rate of fire plumes which spill out from a fire compartment, under a balcony and up through an atrium or other large volume. Current engineering correlations for these balcony spill plumes (BSPs) are based on a combination of one-tenth scale test data and theoretical analysis. The suitability of these correlations for real-scale designs has been questioned. A combined program of full-scale experimentation and CFD modeling is being conducted to analyze the accuracy of these correlations.
A full-scale experimental facility was constructed with a 5 m by 5 m by 15 m fire compartment connected to a four-storey atrium. Propane fires in the compartment produced balcony spill plumes which formed steady-state smoke layers in the atrium. Experimental variables included fire size, compartment opening width, compartment fascia depth and draft curtain depth. A variable exhaust system was used to achieve various smoke layer heights for each of 100 experimental configurations.
Temperatures were measured in the compartment, atrium and exhaust system.
The experimental data was used to determine the atrium smoke layer elevation and balcony spill plume mass flow rate for each configuration and fire size. This data was compared against design correlations for atrium smoke management systems to evaluate their accuracy. This data set also provided validation data for a CFD model of the facility.
A CFD model of the experimental facility was implemented using the Fire Dynamics Simulator software (Version 3). Large-eddy simulations were performed with a constant radiative fraction and an infinitely fast mixture fraction combustion model. Data from these simulations was compared to the experimental data. The CFD model was then extended to a 50 m high atrium to overcome limitations in the experimental data. Grid sizes on the order of 10-1 m were evaluated in a grid sensitivity analysis with smoke layer elevation as the comparison variable. A parametric study focusing on the variation of plume mass flow rate with elevation was conducted using the same variables as the experimental program.
Results from the parametric study are being compared to existing engineering correlations. A new proposed correlation for the variation in balcony spill plume mass flow rate with elevation is under development.
1. I
NTRODUCTIONOver the past decade, NRC’s Fire Research program (FR) has conducted a number of joint research projects with the American Society of Heating, Refrigeration and Air Conditioning Engineers (ASHRAE) addressing smoke management systems in atria [1, 2, 3]. This research has concentrated on
developing effective solutions for balancing the economic and life safety costs of these systems through the development of fire safety engineering tools. This paper describes a current joint research project investigating smoke production rates of balcony spill plumes.
Until recently, atrium smoke management systems were designed assuming that the fire would occur on the atrium floor. It was further assumed that sprinklers would limit the size and thus the smoke produced by fires in compartments attached to the atrium. However, some North American model codes now call for consideration of smoke exiting from these attached compartments as balcony spill plumes.
2. B
ALCONYS
PILLP
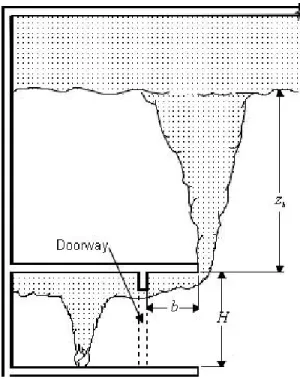
LUMESAtria with connected compartments are commonly found in office buildings and shopping malls. For a fire in a compartment that opens onto a balcony, smoke can flow under the ceiling and balcony and into the atrium as a balcony spill plume, or BSP (Figure 1). As this buoyant line plume rises into the atrium, entrained air increases the smoke production or mass flow rate of the plume. In order to size smoke exhaust fans to maintain a safe evacuation path, accurate calculation of the BSP mass flow rate is required.
Figure 1. Balcony spill plume concept.
Existing correlations relate BSP mass flow rates to fire compartment dimensions and fire size. These correlations are primarily based on data from one-tenth scale physical models of shopping mall atria [4, 5]. The correlation used in North American system design guides ([6, 7]) was developed by Law as a simple correlation for use by designers [8]:
m = Csp(QW2)1/3(zb + 0.25H) (1)
where m is the BSP mass flow rate (kg/s) at elevation zb (m), Csp is a scaling factor of 0.36 (-), Qc is the
fire’s heat release rate(kW), W is the plume width at the balcony edge (m), zb is the smoke layer elevation
above the balcony (m) and H is the balcony elevation above the top of the fire source (m).
There is considerable controversy over the accuracy of the various BSP correlations since they each predict significantly different mass flow rates, particularly for atria with high elevations. Smoke management systems designed using inaccurate smoke production rates may result in either reduced life safety or unnecessary costs. Recent research in this area [9, 10] has not reduced the controversy. Full-scale data for verification of BSP correlations is limited. These correlations, developed from scale models of low elevation atria, may not be applicable for full-scale atria with higher elevations. Data from full-scale fire experiments is needed to evaluate these correlations and, if required, develop new ones. NRC has initiated a joint research project with ASHRAE to determine the accuracy of existing balcony spill plume correlations and provide data for the development of new correlations. Results from this research project will provide input to North American design guides for atrium smoke management systems. A CFD modeling effort performed in parallel with the experimental program allowed extension of the experimental results to higher elevation atria.
3. E
XPERIMENTALP
ROGRAMThe experimental work underlying this modeling study has been described in a previous publication [11]. The main details are summarized below.
3.1. Experimental
Objectives
The main objective of the experimental program was to measure BSP mass flow rates produced by steady fires in a compartment with an attached balcony. The steady-state height of the atrium smoke layer above the balcony was the major dependent variable to be
measured. A mass balance occurs at this elevation between the BSP mass flow rate and the exhaust mass flow rate from the top of the smoke layer. The BSP mass flow rate at this elevation can therefore be inferred from the more easily measured exhaust system mass flow rate.
Elements of the fire compartment geometry (i.e. opening width, fascia depth and draft curtain depth) were varied. A variable exhaust system mass flow rate was used to achieve various atrium smoke layer depths for each geometry and fire size combination. BSP smoke production rates were calculated for each unique combination of geometry and fire size.
3.2. Experimental
Facility
Figure 2 below shows the experimental facility. A 5 m by 5 m by 12 m fire compartment was located at one end of a 12.2 m by 18.3 m by 12.5 m atrium. The front wall of the test compartment was modular in construction with opening widths ranging from 5 to 12 m. A removable 1.6 m fascia was installed at the top of the opening. A 4 m deep balcony was also installed with removable draft curtains. The dimensions of the test compartment, balcony and fascia were consistent with previous one-tenth scale experiments [5] and represented typical values found in North American atria.
Figure 2. Experimental facility.
A propane burner system was located at the center of the fire compartment and was used to achieve steady fires sizes over extended periods of time. A design fire size of 500 to 1 000 kW has been suggested for the majority of fire situations in sprinklered office buildings [1, 12]. Similarly, a design fire size of 2 500 kW covers most fire situations in retail malls [13]. Atrium smoke management system design guides ([5, 6]) suggest a design fire of 5000 kW for sprinklered retail applications. Based on this input, the experimental program included fire sizes in the range from 500 to 5 000 kW. The fire compartment was lined with non-combustible mineral fibre insulation to protect against repeated fire exposure and minimize conductive heat losses through the compartment boundaries.
A mechanical smoke exhaust system was located at the atrium ceiling with a variable capacity of 0 to 25 m3/s. This exhaust system was instrumented to measure the exhaust air mass flow rate. Temperature measurements were made in the atrium to determine the atrium smoke layer elevation. Additional temperatures were measured in the test compartment and at the compartment opening.
Approximately 100 tests were performed with various combinations of compartment geometry and fire size. Each test was conducted at five different exhaust flow rates in the range of 5 to 25 m3/s in order to achieve multiple steady-state smoke layer elevations. The exhaust flow rate was varied every 500 s since preliminary tests showed that the atrium smoke layer reached a steady-state condition within this time.
4. CFD
M
ODELINGIn parallel with the experimental program, CFD modeling was performed to supplement the experimental data. As a more general objective, the CFD modeling effort also provided information on the use of CFD modeling for the design and evaluation of atrium smoke management systems. Accurate modeling of free combustion processes is a complex and difficult task due to its highly turbulent nature and the wide range of timescales for the underlying physical processes. Heat transfer, especially radiation, has a greater relative effect on the flow than for most ambient temperature flows. Most of the major processes are also transient. The need to resolve small temporal variations makes Large-Eddy Simulation (LES) a more suitable model than Reynolds Averaged Navier-Stokes (RANS). The selection of appropriate CFD software is key to achieving accurate results for fire simulations. All dimensions in m
4.1.
Fire Dynamics Simulator (FDS)
The software chosen to model BSP dynamics is Fire Dynamics Simulator (Version 3) developed by the National Institute of Standards and Technology [14]. FDS is specifically designed to model free combustion fluid flow and includes mechanisms for modeling combustion stoichiometry, smoke production and transport, and fuel pyrolysis. An explicit predictor-corrector scheme with second order temporal and spatial accuracy is used. Spatial derivatives are approximated by second order central differences. Turbulence is modeled using a Smagorinsky form LES model. Low Mach number combustion equations [15] optimized for low-speed, buoyancy-driven flows are used to reduce computational requirements.
FDS uses a mixture fraction combustion model where the fraction of gaseous fuel throughout the flow domain determines where combustion may occur. Mass fractions of the major reactants and products are related to the mixture fraction via state relations which are in turn derived from a combination of simplified analysis and experimental data. Mixing-controlled combustion and an infinitely fast fuel-oxygen reaction are assumed.
The radiation transport equation for a non-scattering gray gas is solved using a finite volume method similar to that used for convective transport. A constant radiative fraction is used regardless of flame temperature or combustion product concentrations.
4.2. Atrium
Model
Preliminary experimental results indicated that the exhaust system capacity was not large enough to maintain the smoke layer more than 2 m above the balcony. Mass flow rate data over a larger range of elevations was required for proper evaluation of BSP correlations.
An atrium CFD model was developed to obtain data over a larger range of elevations. A fire compartment similar to the experimental facility was modeled with a higher elevation atrium. Since CFD model results allow direct calculation of the mass flow rate of the BSP at any elevation, the need to infer BSP mass flow rates from exhaust system mass flow rates was removed. The roof of the modeled atrium was therefore removed to allow free development of the plume over the entire height of the atrium. Similarly, the walls of the atrium were removed to reduce the speed of makeup air entering the atrium.
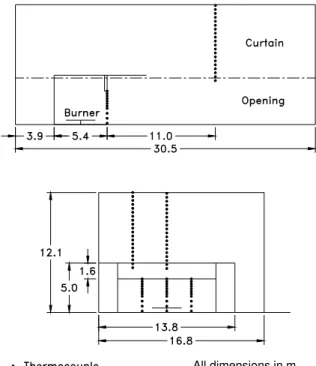
Figures 3 and 4 below show the geometry of the atrium CFD model. A 12 m wide by 5 m deep by 5 m high fire compartment was located at floor level in a 50 m cubic atrium. The fire compartment opening was varied between 5 and 12 m. A 5 m wide balcony projected from the fire compartment. Variable height draft curtains were located at the edges of the fire compartment opening and ran the full depth of the balcony. A variable height fascia was located at the fire compartment opening.
Figure 3. Atrium model geometry.
Figure 4. Fire compartment geometry. All surfaces were specified as inert and all flow domain boundaries except for the floor were specified as open boundary conditions. The fire was modeled as a steady release of propane throughout the simulation. One isometric computational mesh was defined over the entire flow domain. Simulation times of 300 s were chosen to achieve steady-state conditions. The fuel was specified as propane and a constant radiative fraction of 0.35 was used.
4.3.
Grid Sensitivity Analysis
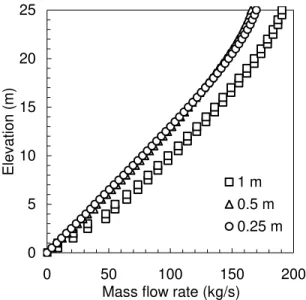
A grid sensitivity analysis was performed on the atrium model with two objectives: to determine the most efficient grid size and to determine the atrium width and depth required to fully contain the balcony spill plume. The former ensures accuracy with minimal computational requirements and the latter prevents BSP mass loss from the flow domain sides from affecting the vertical mass flow rate profiles. The accuracy of LES fire dynamics simulations depends primarily on the grid resolution around the fire and across plume boundaries. In particular, previous work by the author shows that accurate modeling of plume dynamics in atria requires a grid size in the range of 0.1 to 1.0 m [16].
A fire size of 2 000 kW and an opening width of 10 m were chosen as being in the middle of their respective ranges. The draft curtain and fascia depths were presumed not to affect the bulk plume flow as significantly as the other two parameters and were therefore ignored in the grid sensitivity analysis. The atrium height was reduced to 25 m to allow timely solution of the simulations with small grid sizes. Mass flow rates were calculated across horizontal sections of the flow domain over its entire height. Figure 5 shows the mass flow rate vs. elevation trends for various grid sizes. Since the results for grid sizes of 0.25 and 0.5 m were very similar, an optimal grid size of 0.5 m was chosen as the optimal grid size. 0 5 10 15 20 25 0 50 100 150 200
Mass flow rate (kg/s)
Elevation (m)
1 m 0.5 m 0.25 m
Figure 5. Mass flow rate profile variation with grid size.
To choose the atrium size, various simulations were performed of a 2 000 kW fire and a 10 m compartment opening using the optimal grid size of 0.5 m. The velocity field at the flow domain boundaries was examined to estimate the amount of mass escaping from the flow domain sides. An arbitrary criterion of flow speed < 0.5 m/s was chosen to represent minimal mass loss. Based on this criterion, a minimum atrium size of 50 m by 50 m was required to fully contain the plume. This atrium size was maintained for all subsequent simulations. The grid sensitivity analysis yielded a 50 m by 50 m by 50 m atrium with a grid size of 0.5 m for a total of 1 000 000 control volumes. These simulations took an average of 12.11 h to solve a simulation time of 300 s for an average efficiency ratio of 1:145. The simulations were performed on a Pentium IV workstation with a 2.5 GHz processor and 1.0 GB of RAM running Windows 2000.
4.4. Parametric
Study
The objective of the CFD modeling study was to obtain BSP mass flow rates data for different fire compartment geometries and fire sizes. A parametric study was planned using the same parameters as in the experimental program: fire size, compartment opening width, draft curtain depth and fascia depth. Parameter values were chosen to span the range of fire sizes spans the range of typical design fires used for commercial and retail applications and fire compartment geometries in typical North American atria. Table 1 below lists the values of these parameters. Fire size (kW) Compartment opening width (m) Draft curtain depth (m) Fascia depth (m) 1 000 5.0 0.0 0.0 2 000 8.0 2.0 2.0 5 000 10.0
Table 1. Parametric study parameter values.
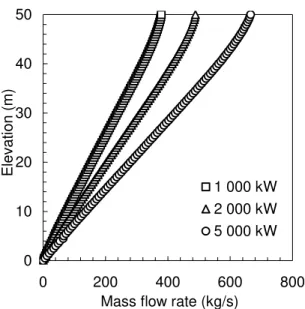
5. R
ESULTSFigure 6 below shows the BSP mass flow rate profiles for selected simulations. The profiles vary linearly with elevation, a characteristic of buoyant plumes which is supported by both fundamental dimensional analyses and experimental work [17]. This supports the conclusion that the modeling results represented here accurately model plume dynamics.
Each mass flow rate profile from the parametric study was fitted using linear regression to curves of the form: 0 10 20 30 40 50 0 200 400 600 800
Mass flow rate (kg/s)
Elevation (m)
1 000 kW 2 000 kW 5 000 kW
m = k z + m0 (2)
where m is the plume mass flow rate (kg/s), k is a proportionality constant (kg/s-m), z is the elevation above the balcony edge (m) and m0 is the offset
representing the plume mass flow rate already present at the balcony edge (kg/s). Steady state data was obtained by averaging over the period t = 120 to 300 s. Non-linear data at the top of the flow domain was removed by considering only data between z = 15 and 35 m. These subsets yielded linear regressions with minimum R2 values of 0.999. Table 2 below lists the linear regression parameters for selected simulations from the parametric study. Equivalent linear regression parameters for Law’s equation (1) can be defined as:
Figure 6. Mass flow rate profile variation with fire size.
k’ = Csp(QcW2)1/3 ; m0’ = (0.25H)Csp(QcW2)1/3 (3)
The mass flow rate trends in Figure 6 are nonlinear near the top of the flow domain. These non-linearities were found in all simulations and were greater for larger grid sizes. This nonlinear behaviour is attributed to the propagation of the open boundary condition at the top of the atrium into the flow domain. The zero pressure requirement at the boundary forces the flow within the domain to change. In reality, a small pressure difference due to buoyancy would be present at the top of the atrium. This is considered a modeling error that does not affect the flow dynamics in the rest of the flow domain. Note that these non-linearities were not due to BSP mass escaping from the flow domain since velocities at the flow domain boundaries under 0.5 m/s were verified for each simulation.
with variables defined above. Table 2 below also lists the linear regression parameters for Law’s equation.
The proportionality constants from the CFD simulations, k, are consistently smaller than those from Law’s equation, k’. Specifically, the average ratio of k/k’ is 0.58. This indicates that Law’s equation overpredicts the mass flow rate for BSPs. This agrees with anecdotal evidence that Law’s equation is conservative.
Based on the parametric study data, development of a new BSP correlation is pending. This correlation will be verified against data from the experimental program.
CFD study Law’s equation
Fire size (kW) Opening width (m) Fascia depth (m) Draft curtain depth (m) k (kg/s-m) m0 (kg/s) k’ (kg/s-m) m0’ (kg/s) 2 000 10 0 2 10.7 42.2 21.0 26.3 1 000 10 0 2 8.24 32.2 16.7 20.9 5 000 10 0 2 14.4 64.3 28.6 35.7 2 000 5 0 2 9.02 25.3 13.3 16.6 1 000 5 0 2 7.08 19.2 10.5 13.2 5 000 5 0 2 12.9 45.9 18.0 22.5 2 000 8 0 2 10.0 33.1 18.1 22.7 1 000 8 0 2 7.92 26.2 14.4 18.0 5 000 8 0 2 13.2 53.1 24.6 30.8
6. C
ONCLUSIONSComparison of balcony spill plume mass flow rates from CFD simulations and existing correlations indicated that the latter are conservative. A new correlation based on the CFD simulation is proposed. This work demonstrates the integrated use of both experimental data and CFD modeling to develop engineering correlations for atrium smoke management.
A
CKNOWLEDGEMENTSThe authors wish to acknowledge the staff at NRC’s National Fire Laboratory for their efforts in the design and construction of the experimental facility.
R
EFERENCES[1]. G. D. Lougheed, Expected size of shielded fires in sprinklered office buildings, ASHRAE Transactions, 103, (1), p. 395-410, 1997.
[2]. G. D. Lougheed, G. V. Hadjisophocleous, C. McCartney, B. C. Taber, Large-scale physical model studies for an atrium smoke exhaust system, ASHRAE Transactions, 105, (1), p. 676-698, 1999.
[3]. G. D. Lougheed, C. McCartney, B. C. Taber, Smoke movement for sprinklered fires, ASHRAE Transactions, 106, (Pt. 1), p. 605-619, 2000.
[4]. H. P. Morgan, N. R. Marshall, Smoke control measures in a covered two-story shopping mall having balconies as pedestrian walkways, BRE CP11/79, Building Research Establishment, Borehamwood, UK, 1979.
[5]. H. P. Morgan, N. R. Marshall, Smoke hazards in covered, multi-level shopping malls; an experimentally based theory for smoke production, BRE CP48/75, Building Research Establishment, Borehamwood, UK, 1975.
[6]. CIBSE, Relationships for smoke control calculations, Technical Memoranda TM19:1995, Chartered Institute of Building Services Engineers, London, 1995.
[7]. NFPA, Guide for smoke management systems in malls, atria, and large areas, NFPA 92B, National Fire Protection Association, Quincy, MA, 2000.
[8]. M. Law, A note on smoke plumes from fires in multi-level shopping Malls, Fire Safety Journal, Volume 10, p. 197-202, 1986.
[9]. M. Poreh, H. P. Morgan, N. R. Marshall, R. Harrison, Entrainment by two-dimensional spill plumes, Fire Safety Journal, Volume 30, No. 1, p. 1-19, 1998.
[10].P. H. Thomas, H. P. Morgan, N. Marshall, The spill plume in smoke control design, Fire Safety Journal, Volume 30, p. 21-46, 1998.
[11].C. J. McCartney, G. D. Lougheed, E. J. Weckman, CFD Investigation of balcony spill plumes (Part I), Proceedings of the 12th Annual Conference of the CFD Society of Canada, Ottawa, Canada, 2004.
[12].D. Madrzykowski, R. Vettori, A sprinkler fire suppression Algorithm. J. of Fire Prot. Engr. 4: 151-164, 1992.
[13].G. D. Lougheed, C. McCartney, B. C. Taber, Sprinklered mercantile fires, ASHRAE Transactions, 107, (1), p. 730-743, 2001.
[14].K. B. McGratten, et. al., Fire Dynamics Simulator (Version 3) – User’s Guide, National Institute of Standards and Technology, 2002. [15].R. G. Rehm, H. R. Baum, The equations of
motion for thermally driven, buoyant Flows, Journal of Research of the NBS, 83:297–308, 1978.
[16].G. V. Hadjisophocleous, C. J. McCartney, Guidelines for the use of CFD simulations for fire and smoke modeling, ASHRAE Transactions, 2005 (in press).
[17].G. Heskestad, Fire plumes, flame height, and air entrainment, The SPFE Handbook of Fire Protection Engineering (3rd ed.), p. 2-1 – 2-17, 2002.