Solute transfer across the sediment surface of a eutrophic
lake: I. Porewater profiles from dialysis samplers
Noel R. Urban *, 1, Christian Dinkel, Bernhard Wehrli
Limnological Research Center, Swiss Federal Institute for Environmental Science and Technology, EAWAG, CH-6047 Kastanienbaum, Switzerland
Key words: Pore water; fluxes; lake.
ABSTRACT
Porewater profiles often are used to identify and quantify important biogeochemical processes occurring in lake sediments. In this study, multiple porewater profiles were obtained from two eutrophic Swiss lakes using porewater equilibrators (peepers) in order to examine spatial and seasonal trends in biogeochemical processes. Variability in profile shapes and concentrations was small on spatial scales of a few meters, but the uncertainty in calculated diffusive fluxes across the sediment surface was, on average, 35 %. Focusing of Fe and Mn oxides toward the lake center resulted in systematic increases in porewater concentrations and diffusive fluxes of Fe2+and Mn2+
with increasing water depth; these fluxes are postulated to be regulated by the pH-dependent dissolution of reduced-metal phases. Despite higher concentrations of inorganic carbon, NH4+, Si
and P in pelagic compared to littoral sites, diffusive fluxes of these substances across the sediment surface increased only slightly or not at all with increasing water depth. Porewater profiles did reveal temporal changes in Fe2+, Mn2+, Ca2+and Mg2+that were an indirect result of the large,
seasonal changes in seston deposition, but no clear seasonal variations were found in diffusive fluxes of nutrients across the sediment surface. The intense mineralization occurring at the sediment surface was not reflected in the porewater profiles nor in the calculated diffusive fluxes. Calculated diffusive fluxes across the sediment surface resulted from decomposition occurring primarily in the top 5 – 7 cm of sediment. Diffusive fluxes from this subsurface mineralization were equal to the solute release from mineralization occurring at the sediment-water interface. Buried organic matter acts as a memory of previous lake conditons; it will require at least a decade before reductions in nutrient inputs to lakes fully reduce the diffusive fluxes into the lake from the buried reservoir of organic matter.
Introduction
In both the oceanographic and limnological studies, porewater profiles frequently are used to identify biogeochemical processes or to calculate process rates. Processes amenable to such study include mineral dissolution, authigenic mineral formation,
1 Present address: Dept. Civil & Mineral Engineering, Michigan Technological University,
Houghton, Michigan 49931, USA.
* To whom correspondence should be addressed. 1015-1621/97/010001-25 $ 1.50+0.20/0
organic matter decomposition, and microbial dynamics (e.g., Lerman, 1979; Froeh-lich et al., 1979; Berner, 1980). Solute concentrations may indicate the existence of mineral phases (e.g., Emerson, 1976; Cook, 1984) or of microbial processes (e.g., Lovely and Goodwin, 1988). Diffusive fluxes calculated from concentration gra-dients in porewater profiles have been equated to rates of microbial processes (e.g., Rudd et al., 1986; Lovely and Klug, 1986; Canfield, 1991), rates of mineral dissolu-tion or precipitadissolu-tion (e.g., Lerman and Liezke, 1977; Wersin et al., 1991), and rates of solute transfer from the sediments to the water column (e.g., Rudd et al., 1986, 1990; Carignan and Lean, 1991). Problems inherent in the interpretation of pore-water profiles include reproducibility, the effects of depth resolution, the assump-tion of steady state, internal element cycles, and spatial and temporal variability.
The objective of this paper is to demonstrate the spatial and temporal variability in porewater profiles. This serves not only to point out appropriate methodologies and interpretations of data, but also to illustrate the dynamics of the biogeochemi-cal processes involved in early diagenesis of lake sediments. Specifibiogeochemi-cally, compari-son of a large number of solute profiles from pore waters of two lakes allows us to address four questions. First, what is the uncertainty in measured concentrations and calculated fluxes? Reproducibility depends on both the precision of the techni-que and the spatial heterogeneity of the sediments. Artifacts of the dialysis sam-pling technique (Hesslein, 1976) have been examined previously (e.g., Carignan, 1984; Adams, 1991; Brandl and Hanselmann, 1991; Carignan et al., 1994). How-ever, although previous papers have presented replicate porewater profiles (e.g., Carignan, 1984; Carignan et al. 1994), the reproducibility has seldom been quan-titatively examined. Comparison of profiles among lakes (e.g., Rudd et al., 1986; Cook et al., 1987) or use of calculated diffusive fluxes in lake mass balances (e.g., Carignan and Lean, 1991; Rudd et al., 1990) requires knowledge of the uncertainty about individual measurements. The sampling of this study allows a preliminary estimate of the uncertainty due to small-scale spatial variability.
The second question addressed in this study concerns the sediment depth at which diagenetic reactions occur. Intense mineralization of organic matter occurs in the first 1 – 3 mm sediments (e.g., Lovely and Klug, 1986; Sweerts et al., 1986, 1989). On the other hand, Carignan and Lean (1991) reported that significant release of nutrients continued down to sediment depths of 50 cm in a mesotrophic lake. Fine-resolution sampling would be required to characterize sharp concentration gra-dients resulting from surface mineralization. Development of microelectrodes (e.g., Revsbech et al., 1980, 1988) and gel porewater collectors (Davison et al., 1991, 1994; Davison and Zhang, 1994) has begun to allow us to measure profiles for some spe-cies with a resolution of < 250 mm. Unfortunately, microelectrodes are not available for all species, and gel collectors can be employed only by differs in shallow lakes (Davison et al., 1994). The effects of coarse-resolution sampling on major ions gen-erally is ignored. In this study we compared fluxes calculated from profiles with 0.5 and 1.5 cm resolution and found few systematic differences. By comparison of diffusive fluxes calculated from these coarse-resolution profiles with fluxes mea-sured in benthic chambers we demonstrate the relative importance of surface and deep mineralization.
Third, systematic spatial variations in solute concentrations in pore waters and in diffusive fluxes across the sediment surface were investigated. Focusing of
organic matter (Davis, 1968; Lehman, 1975) could result in higher rates of organic matter decomposition and nutrient release in the deepest areas of lakes. Such a pattern was reported for one mesotrophic lake (Carignan and Lean, 1991) but was not observed in an oligotrophic lake (Sherman et al., 1994). Systematic spatial varia-tion in rates of decomposivaria-tion might offset systematic variavaria-tions in organic matter deposition.
Finally, this study examined the temporal variations in pore water profiles. Tem-poral variability could be problematic with regards to pore water measurements. Profiles are assumed to be at steady state for the calculation of diffusive fluxes (e.g., Lerman, 1979), and the long equilibration period for porewater dialysis sam-plers (2 – 3 weeks; Brandl and Hanselmann, 1991; Carignan et al., 1994) requires that no significant changes occur over this timeframe. However, large seasonal and annual variations in nutrient inputs to lake sediments occur. Sedimentation rates in summer may be more than 10-fold higher than in winter, and interannual variations in sedimentation rates may approach 25 % (Gächter et al., 1989; Urban et al., 1994). Such variability in inputs to sediments should result in a corresponding variability in element release to porewaters unless the diagenetic processes are much slower than the variations in inputs. Results from this study clarify the four questions above and point to serious limitations of the dialysis sampling technique.
Methods
Site description
The major focus of this study was Lake Sempach. This lake ocupies a deep, glacially-scoured river valley in central Switzerland. It has an area of 14.4 km2,
a maximum depth of 86 m, and an average depth of 46 m (Gächter et al., 1983). Because the catchment: lake area ratio (4.3) is small, the water retention time is relatively long (17 yr). Situated among rich farmlands, the lake receives consider-able nutrient inputs from agricultural runoff (Baumann, 1988) and is, consequently, eutrophic. Varved sediments, an indication of anoxia in bottom waters, have been deposited in the center of the lake since about 1930 to the present (Züllig, 1956, 1982; Gächter and Meyer, 1990). Installation of sewage treatment plants around the lake decreased total phosphorus concentrations from above 150 to around 100 mg/L (Stadelmann, 1988). For the past 10 years artificial aeration and forced circulation have been utilized in an attempt to reduce internal recycling of P (Gächter et al., 1989; Stadelmann, 1988). These restoration measures have succeeded in maintain-ing oxygen concentrations above 4 mg/L in the hypolimnion, but internal recyclmaintain-ing of P has not been reduced significantly (Gächter and Wüest, 1993).
To augment the discussion of profile reproducibility and spatial variability, addi-tional porewater profiles were obtained from Lake Baldegg. This nearby lake has a similar morphometry (max. depth 65 m; area 5.2 km2; Stadelmann, 1984), and is
similarly eutrophic. Laminated sediments in the center of L. Baldegg have been deposited since about 1880 (Niessen and Sturm, 1987; Züllig, 1982). Despite a reduction in P inputs and 10 years of artificial aeration, the lake remains highly eutrophic (Wüest et al., 1991).
Porewater collection and analysis
Porewater profiles were measured on a total of 10 occasions in L. Sempach between September 1989 and June 1993. On seven occasions (Sept. 1989, June 1990, July 1990, October 1990, April 1991, April 1992, June 1993) profiles were obtained from the deepest area (86 m) of the lake. Profiles from littoral areas (water depth < 20 m) were collected twice (March 1991, October 1992), and in August 1992, profiles were obtained from an intermediate water depth (50 m). In addition, porewater profiles from L. Baldegg were obtained in November 1992, January 1994, and March 1994 from pelagic regions (56 – 65 m water depth), and in November 1992 also from 25-m water depth.
Porewater equilibrators (peepers; Hesslein, 1976) were used on all occasions to obtain the profiles. Peepers consisted of a 50×15 cm solid, plexiglass frame into which were milled cells (1 or 0.5×10 cm) at a spacing of either 0.5 or 1.5 cm. The cells were filled with distilled, deionized water, and a 0.2 mm filter (HT 200, Tuffryn polysulfone membrane; Gelman Inc.) was laid over the surface of the frame and held in place by an outer frame of plexiglass. To remove oxygen from the water in the cells, the peeper was immersed in a tank of distilled water that was then purged for 24 hours with nitrogen (cf. Carignan et al., 1994). When the peeper is placed in the sediments, solutes from porewater in contact with the filter diffuse into the cells such that, after equilibrium is reached, concentrations inside each cell equal those at the corresponding depth in the porewater. A two week period was allowed for equilibration (Hesslein, 1976; Brandl and Hansel-mann, 1991). Peepers were mounted on a steel tripod that was lowered to the sediment surface. On several occasions, the orientation of the peepers was inspect-ed by means of a video camera mountinspect-ed on the same tripod. Exposure of the peeper to lake water following retrieval from the sediments lasted no more than five minutes.
The cells of the peeper were sampled onboard ship immediately upon retrieval from the lake. Water from within the cells was withdrawn into pipets and imme-diately injected into containers containing appropriate fixative agents. Samples for analysis of Fe, Mn and major cations were acidified with SuprapureTMHNO
3.
Samples for CH4analysis received NaOH to raise the pH above 10, and zinc acetate was added to samples for sulfide analysis. Samples for measurement of pH and alka-linity were stored in syringes until analyzed. The sampling of peepers was done as quickly as possible to prevent evasion of gaseous species and invasion of oxygen; the entire sampling generally required 15 – 30 min.
Analysis for all species generally was completed within 48 hours after retrieval from the lake. Major cations (NH+4, Ca2+, Mg2+, Na+, K+) and anions (Cl–, NO
3 –,
SO42 –) were analyzed by ion chromatography(Metrohm). Silica and PO 4 3 – were
analyzed photometrically with molybdenum blue (APHA); total P was measured identically following digestion with K2S2O8. Alkalinity was determined by acid titration to pH 4.3, CH4was measured by gas chromatography with flame ioniza-tion detecioniza-tion, and Fe and Mn were measured by atomic absorpioniza-tion spectrophoto-metry.
Calculation of the diffusive fluxes of solutes across the sediment-water inter-face generally is based on application of Fick’s Law to the concentration profile.
At steady state, the flux (F) is equal to the product of the concentration gradient (dC/dz) and the diffusion coefficient (D):
F = D · dC/dz (1)
The validity of the assumption of steady state will be discussed below in light of our results. Only in the diffusive boundary layer (DBL) can the molecular diffusion coefficient in water (D) be used. Because of the coarse resolution of the profiles, it was not possible to determine the concentration gradient in the DBL. Instead, concentration gradients within the sediments are used together with an effective diffusion coefficient (Deff), defined as:
Deff=fnD (2)
where f is the porosity, and n is a value between 1 and 3 (Lerman, 1979). Porosity,
measured as weightloss upon drying of sediments at 60 °C, was 0.92 for pelagic and 0.80 for littoral surface sediments. In this paper, we use a value for n of 1. Values of
D were taken from Li and Gregory (1974) and Lerman (1979) corrected to a
tem-perature of 5 °C. In this paper, only diffusion of major ions was considered; com-plexes (e.g., Furrer and Wehrli, 1993) and electrostatic interactions among ions (e.g., Lasaga, 1979) were ignored. Numerous authors select an arbitrary number of points from the concentration profiles and apply a linear regression to calculate the concentration gradient at the sediment surface (e.g., Rudd et al., 1986; Brandl and Hanselmann, 1991; Sherman et al., 1994). We followed this procedure only for solutes whose concentrations change sharply across the sediment surface (viz., NO3–, SO
4 2 –, PO
4
3 –, Fe2+, Mn2+). For many substances that are released during
decomposition (e.g., HCO3–, NH 4
+, Si, CH
4), concentration profiles follow a smooth
curve that can be fit to a second- or third-order polynomial (cf. Berner, 1980). The concentration gradient at the interface is equal to the first derivative of the poly-nomial at z = 0. The polypoly-nomial curve fitting smooths the profiles and minimizes the effects of measurement errors on the calculated fluxes.
One major uncertainty in calculating diffusive fluxes is the location of the sedi-ment surface within the porewater profile. We used the appearance of a brown layer of iron oxides on the peeper surface to indicate the depth of the sediment-water interface. The formation of iron oxyhydroxides does not necessarily occur at the sediment surface, but at the oxycline. The presence of a mat of Beggiotoa at the sediment surface in pelagic sites of both lakes Sempach and Baldegg strongly suggets that the oxycline lies at the sediment surface; observations with a video camera confirmed that the layer of iron oxyhydroxides occurred at the sediment surface in pelagic sites. Equating of the sediment surface and the oxycline may not be valid in littoral sediments. However, the depth of iron oxyhydroxide precipita-tion coincided with sharp changes in slopes of concentraprecipita-tion profiles even of species (e.g., Si) that should not be sensitive to oxygen.
Results
Identical peepers spaced three meters apart yielded solute profiles that were very similar in general shape and concentration (Fig. 1). To conserve space, Fig. 1 pre-sents only one set of replicate profiles for sulfate and one for phosphate; the remaining eleven sets of replicate profiles also showed very close correspondence between the concentration profiles. Such close correspondence was observed in both littoral and pelagic sediments of both L. Sempach and L. Baldegg, and in all months (April, June, August, October, November) for which such paired profiles were collected.
The variability among profiles also may be assessed by comparing concentra-tions below about 20 cm in the profiles. At this depth below the sediment surface, concentrations of many solutes (e.g., CH4, NH4+, Fe2+, HCO
3
–, Ca2+, SO 4
2 –) approach
constant values. Only for SO42 –did t-tests consistently (i.e., 5 of 5 pairs for SO 4 2 –, ≤1 of 5 for all other solutes) indicate that these “constant” concentrations were significantly different among pairs of replicate profiles. The range of variation (100×S. D./mean) in the concentrations varied from 3 % for Ca2+and Mg2+to 70 %
for SO42 –; relative standard deviations for all solutes except SO 4
2 –were below 20 %.
The large uncertainty in porewater SO42 –concentrations results from the low
con-centrations that are near the detection limit of the analytical technique; analytical errors are probably as large as the actual variability within the pore waters. It even has been suggested that the low concentrations of SO42 –measured at depth in lake
pore waters are artifacts that result from oxidation of reduced S by oxygen diffusing
Figure 1. Replicate porewater profiles. Replicability of profile shapes and concentrations gener-ally is good as shown here for o-PO4
3 –and SO 4
2 –. The PO 4
3 –profiles were from 86-m water depth
in L. Sempach in October, 1990; SO4
2 – profiles are from 50-m water depth in L. Sempach in
out of the peeper frame (Carignan et al., 1994). The similarity in solute concen-trations and profile shapes suggests that spatial variability is small over the scale of a few meters in both littoral and pelagic sediments during all seasons in these eutrophic lakes.
Despite the appearance of low spatial variability, there is a large uncertainty in the calculated diffusive fluxes across the sediment surface. On four occasions, one or more solute was measured in replicate porewater profiles obtained within 3 m of each other with identical peepers; for any single solute only one or two pairs of profiles were obtained. Relative errors among the diffusive fluxes calculated from these replicate profiles ranged from 3 % to 76 % (Table 1). These estimates of the uncertainty in fluxes are based on a limited number of replicate measurements. If the variance in the relative errors were the same for all solutes (additional data are needed to test this assumption), the relative standard deviation for all of the paired fluxes would be 37 %.
Systematic changes with water depth were observed in ion concentrations. Lit-toral porewater profiles were characterized by lower concentrations of Mn, Fe, P, Si, NH4+(Fig. 2) and alkalinity when compared to pelagic profiles. These differences in
concentrations were observed in both lakes Sempach and Baldegg on all sampling dates. Diffusive fluxes also differed significantly for many solutes between littoral and pelagic regions (Table 2; as discussed below, the absence of seasonal variations allows a comparison of littoral and pelagic sites across seasons). Diffusive fluxes of NH4+, Fe2+, and Mn2+were significantly greater in pelagic than in littoral regions.
Only the fluxes of SO42–and P were significantly larger in littoral than in pelagic
areas of one or both lakes (Table 2).
There was little evidence of seasonal changes in diffusive fluxes of most solutes across the sediment-water interface. Only for Mn2+, NO
3
–and Ca2+were diffusive
fluxes higher during the period of lake stratification than during the period of mixis. For all other solutes neither grouping of fluxes into stratified and non-stratified lake conditions nor into seasons of spring, summer, fall and winter revealed any signifi-cant trends. For solutes for which no systematic seasonal changes in fluxes occurred, all of the profiles gathered at the deepest site may be pooled to estimate the un-certainty in the average annual flux. The relative standard deviations among 7 – 11 fluxes calculated for the deepest site of L. Sempach ranged from 30 to 80 % for individual solutes.
While it is easy to assess the variability in diffusive fluxes, it is more difficult to assess the accuracy of the calculated fluxes. One factor that might contribute to inaccuracy in the calculations is the depth resolution with which the concentration gradient is assessed. In this study, profiles were collected with depth resolutions of Table 1. Variability among diffusive fluxes calculated from identical replicate peepers
Solute NO3– SO42 – Cl– Ca2+ Mg2+
Number of replicates 2 2 2 1 1
Relative error (%)a 18, 28 51, 76 4 – 18 17 3
a Relative error = 100 · (x
either 5- or 15-mm. On seven occasions, parallel profiles of some solutes were collected with the two peeper styles. For any given solute, no more than four such replicate profiles were measured. For 14 of the 25 paired profiles diffusive fluxes were higher in the profiles with the finer depth resolution (viz., 5 mm). However, for all individual solutes (except NO3–) as well as for all solutes collectively there was
no statistically significant difference (paired t-test) in the fluxes calculated from profiles with 5- and 15-mm resolution.
A further test of the accuracy of the calculated diffusive fluxes across the sedi-ment surface may be made by comparing fluxes calculated from porewater profiles with those measured in benthic chambers. As reported elsewhere (Wehrli et al., 1997), benthic chambers (Lander) after the design of Devol (1987) were deployed on multiple occasions in L. Sempach. These chambers allowed measurement of fluxes with a controlled rate of water mixing within the chamber and within a short enough time period (12 – 24 hrs) that oxygen depletion did not occur in the chambers. Linear increases or decreases in solute concentrations with time were observed in the Lander chambers. Comparison of diffusive fluxes from the deepest area of the lake (Table 3) indicates that porewater equilibrators and benthic chambers yielded significantly different results for all solutes except CH4and Fe2+.
For solutes with low net fluxes (Ca, Mg, Cl, SO42 –) and large concentrations in the
lake water, the large uncertainties in fluxes measured with the Lander preclude meaningful comparison with those calculated from porewater profiles.
Figure 2. Comparison of littoral and pelagic porewater profiles. Concentrations of all species released from decomposition of biomass (DIC, P, NH4+, Si, CH4) are higher in pelagic sites
(L. Sempach, 86-m water depth, April 1991) compared to littoral sites (L. Sempach, 15-m water depth, March 1991). Profiles of DIC and CH4are not shown. Higher concentrations of Fe and Mn
also are observed in the pelagic sites. Concentrations of NO3 –and SO
4
2–(not shown) are similar
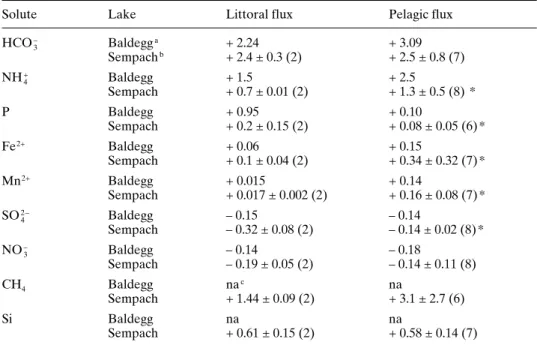
Table 2. Comparison of diffusive fluxes (mmol m–2d–1) in littoral and pelagic zones of lakes
Sempach and Baldegg.
Solute Lake Littoral flux Pelagic flux
HCO3 – Baldegga + 2.24 + 3.09 Sempachb + 2.4 ± 0.3 (2) + 2.5 ± 0.8 (7) NH4+ Baldegg + 1.5 + 2.5 Sempach + 0.7 ± 0.01 (2) + 1.3 ± 0.5 (8) * P Baldegg + 0.95 + 0.10 Sempach + 0.2 ± 0.15 (2) + 0.08 ± 0.05 (6) * Fe2+ Baldegg + 0.06 + 0.15 Sempach + 0.1 ± 0.04 (2) + 0.34 ± 0.32 (7) * Mn2+ Baldegg + 0.015 + 0.14 Sempach + 0.017 ± 0.002 (2) + 0.16 ± 0.08 (7) * SO42 – Baldegg – 0.15 – 0.14 Sempach – 0.32 ± 0.08 (2) – 0.14 ± 0.02 (8) * NO3 – Baldegg – 0.14 – 0.18 Sempach – 0.19 ± 0.05 (2) – 0.14 ± 0.11 (8) CH4 Baldegg nac na Sempach + 1.44 ± 0.09 (2) + 3.1 ± 2.7 (6) Si Baldegg na na Sempach + 0.61 ± 0.15 (2) + 0.58 ± 0.14 (7)
a Measurements made in November.
b Mean ± standard deviation based on all measurements at given sites (all months). Number of
measurements given in parenthesis; * following numbers indicates that littoral and pelagic rates are significantly (p < 0.05; non-paired t-test) different.
c na – not available.
Table 3. Comparison of diffusive fluxes (mmol m–2d–1± S. D.) across the sediment surface at the
deepest location in L. Sempach as measured with benthic chambers and calculated from porewater profiles
Solute Average flux as measured with Ratioa
Lander (n)b Porewater profiles (n)
HCO3– 13.7 ± 4.8 (7) 2.5 ± 0.8 (7) 5.5 CH4 1.6 ± 2.1 (6) 3.1 ± 2.7 (6) 0.5 NH4 + 2.7 ± 1.0 (6) 1.3 ± 0.5 (8) 2.0 NO3– – 1.9 ± 0.6 (8) – 0.14 ± 0.11 (8) 13.8 SO42 – + 0.4 ± 0.6 (5) – 0.14 ± 0.02 (8) – 2.8 PO4 3 – 0.3 ± 0.4 (7) 0.08 ± 0.05 (6) 3.7 Si 3.7 ± 0.4 (5) 0.6 ± 0.2 (7) 6.1 Fe2+ 0.8 ± 0.6 (8) 0.34 ± 0.3 (7) 2.5 Mn2+ 1.5 ± 1.9 (8) 0.16 ± 0.08 (7) 9.5
a Ratio = Lander flux/Peeper flux. b n = number of measurements.
Discussion
Depths of solute consumption and release
Numerous recent studies have pointed to the sediment surface as a site of intense diagenetic activity. Comparison of sedimentation rates with sediment accumulation rates has shown that much mineralization (as much as 85 % of inputs) occurs within a few millimeters of the surface (e.g., Baker et al., 1989; Höhener, 1990). Use of microelectrodes has demonstrated that oxygen penetration is limited to less than two millimeters in eutrophic lakes (e.g., Sweerts et al., 1989, 1991). Bacterial mats such as found on the surface of the sediments in L. Sempach have been shown to be sites of rapid oxygen consumption, sulfide oxidation, and nitrate reduction (e.g., Cohen et al., 1977; Jorgensen and Revsbech, 1983; Sweerts et al., 1990).
This study demonstrates that porewater profiles with a depth resolution of 5- to 15-mm do not reflect the rapid processes occurring at the sediment surface. This conclusion is supported by several lines of evidence. First, diffusive fluxes across the sediment surface as calculated from porewater profiles were much lower than those measured with benthic chambers (Table 3). Although this could be an artifact of the Lander technique (Wehrli et al., 1997), such discrepancies have been interpreted before as evidence of rapid surface reactions (e.g., Johnson et al., 1992; Thamdrup et al., 1994).
A second line of evidence is that the difference between sedimentation and burial is much larger than the diffusive flux out of the sediments of numerous sub-stances (Table 4). The diffusive fluxes for C, N, and P are only 30 – 90 % of those required to balance the sedimentation and burial fluxes. The discrepancy is greater for P (40 % of sedimented P is not measured in either the diffusive or burial fluxes) and N (28 %) than for C (4 %) as a result of the more rapid mineralization of organic N and P as well as the rapid release of P from Fe and Mn oxides that are reduced at the sediment surface (Hupfer et al., 1995). Diffusive fluxes of Fe2+are
higher than predicted due to the rapid oxidation of Fe(II) in the water column; the sedimentation rate for Fe is probably underestimated even by the trap immediate-ly (50 cm) above the sediment surface. The discrepancy between predicted and observed diffusive fluxes is most pronounced for Mn; diffusion (0.16 mmol m–2d–1)
plus burial (0.1 mmol m–2d–1) account for only 17 % of the amount deposited on the
sediment surface at the deepest site in L. Sempach. Furthermore, the Mn present even in the uppermost 2 mm of sediment at this site is already reduced (Friedl et al., 1997); clearly, the porewater profiles fail to reflect the initial, rapid reduction and efflux of Mn2+from the sediments. For N, P and Mn, the discrepancies between
diffusive, sedimentation, and burial fluxes are greater than the uncertainties in any of the fluxes.
A third indication that surface processes are not captured in the porewater pro-files is that the diffusive fluxes across the sediment surface of oxidized mineraliza-tion products (CO2+ HCO3–= 3.7 mmol m–2d–1) plus products potentially oxidized
in the hypolimnion (NH4+, CH
4, Mn2+, Fe2+; 9 mmol m–2d–1combined as oxygen
equivalents) equal only 87 % of the sum (15 mmol m–2d–1as oxygen equivalents) of
the hypolimnetic oxygen demand (11.4 mmol m–2d–1; Urban et al., unpub.), the
denitrification (1.9 mmol m–2d–1; Table 3). If mineralization rates are highest at the
deepest site of a lake (Carignan and Lean, 1991), then the discrepancy between consumption of electron acceptors and donors would be even larger for the entire hypolimnion. As indicated by the difference between fluxes of bicarbonate measured with benthic chambers and those calculated from porewater profiles (Table 3), the apparent electron imbalance results from a failure of the porewater profiles to indicate the large consumption of electron donors at the sediment surface.
A further indication that surface processes are not measured is that, as discussed below, the diffusive fluxes across the sediment surface failed to exhibit either the spatial or temporal trends expected. Spatial and temporal trends are expected to mirror trends in sedimentation of organic matter; the absence (or weakness) of such trends is taken as evidende that the porewater profiles fail to reflect all processes occurring in the sediments. Taken together these lines of evidence indicate that porewater profiles collected with peepers cannot be used to study processes at the sediment surface.
Although it must be regarded as a major limitation that porewater equilibrators cannot be used to measure surface phenomena, this result points to a second impor-tant conclusion of this study. If surface mineralization is not recorded by porewater profiles, then the calculated diffusive fluxes across the sediment surface must result from the slower decomposition that proceeds below the sediment surface. The porewater profiles themselves may be used to determine the locus of this decom-position. Because lake conditions have not changed over the past 2 – 3 years (the time required for porewater profiles to reach steady state to a depth of 20 cm), the first derivative of the concentration profiles is proportional to the diffusive flux, and the second derivative is proportional to the rate of production (or consumption) at each depth. Depth profiles of the second derivatives of porewater profiles of NH4+
Table 4. Comparison of sedimentation, diffusive, and burial fluxes (mmol m–2d–1) at the deepest
location in L. Sempach
Substance Sedimentationa Burialb Sedimentation – Burial Diffusive fluxc
Inorg. C 12d 18.2 – 6.2 Org-C 23.5e 9.6 13.8 Total C 35.5 27.8 7.7 6.8f N 3.2e 1.0 2.2 1.3 P 0.49e 0.21 0.28 0.08 Fe 0.90e 0.94 – 0.04 0.34 Mn 1.60e 0.10 1.50 0.16
a Taken from Urban et al. (1997).
b Taken from Urban et al. (1997). Sediment accumulation rate of 1070 g m–2yr–1based on 210Pb
dating of Wieland et al. (1993).
c Average based on all pore water profiles from 86-m depth (Table 4). d Based on Ca fluxes for periods 1988 – 1992 at 86-m depth.
e Based on flux (1988 – 1992) at 86-m depth. f Sum of HCO 3 –, H 2CO3 *, and CH 4diffusive fluxes.
(Fig. 3) demonstrate that production of ammonium continues to a depth of 5 – 7 cm. A depth of 5 – 7 cm corresponds to a sediment age of 10 – 15 years. Evidently, decomposition of sediments deposited 10 – 15 years ago is still contributing to the diffusive fluxes of nutrients crossing the sediment surface. Carignan and Lean (1991) reported that release of solutes to pore waters continued to a depth greater than 50 cm in a mesotrophic lake. Our results indicate that sediments deposited under eutrophic lake conditions will continue to release nutrients for one to two decades after they reach the lake bottom.
The subsurface mineralization revealed by the peeper profiles is a major contri-butor to the total solute flux across the sediment surface (Table 5). Assuming that the fluxes into benthic chambers (Lander; Wehrli et al., 1997) represent the sum of surface and subsurface mineralization, the difference between Lander and peeper fluxes equals the surface mineralization rate. For N subsurface mineralization is Figure 3. Depth profiles of ammonium concentration and production within sediments. From the second derivative of the concentration profile (left panel) in pore waters the production (or con-sumption) rate (right panel) of NH4
+is calculated. Shown here is the profile for July, 1990 at the
deepest site (86-m) in L. Sempach. The production profile shows that mineralization occurred primarily in the upper 5 cm of sediments (hatched area); the negative rate at the sediment surface reflects both oxidation and enhanced transport above the sediments. Analysis of all NH4
+profiles
about equal to that at the surface. Desorption of P from Fe and Mn oxides at the sediment surface causes the Lander P flux to exceed P mineralization (Hupfer et al., 1995); similarly, it is incorrect to equate the diffusive fluxes of P calculated from the porewater profiles with mineralization of P because much of the mineralized P is trapped within the sediments. Nevertheless, subsurface release of P equals nearly 40 % of that at the surface. Clearly, this slow mineralization of organic matter is quantitatively important and must be considered in efforts to decrease nutrient concentrations in lakes. Similarly, to predict the time required for lake recovery from eutrophic conditions, the kinetics of this slow decomposition must be deter-mined.
Spatial variation
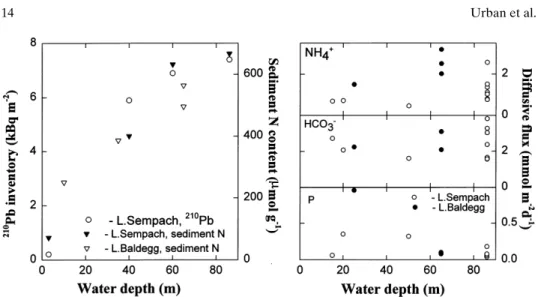
Systematic spatial variations in porewater concentrations and diffusive fluxes were expected as a result of sediment focusing. Higher wind energies delivered to littoral sediments cause resuspension of fine, organic-rich material that is focused to deeper areas of the lake where it accumulates (e.g., Davis, 1968; Bloesch, 1982; Bloesch and Uehlinger, 1986). Hence, inventories and net delivery of organic matter are higher at pelagic than littoral sites. That these processes operate in lakes Sempach and Baldegg is shown by the distribution of 210Pb and organic matter in the sediments
(Fig. 4 A). Concentrations of organic N at the sediment surface increase with increasing water depth as a result of the increasing fluxes of organic matter caused by particle focusing (Fig. 4). The increase in deposition and accumulation of organic matter is greatest between 10- and 50-m depth. Both lakes are characterized by steep slopes and relatively flat central basins (mean depth ≅one half of the maxi-mum depth for both lakes). If rates of mineralization were proportional to the rate of delivery of organic matter, the diffusive fluxes of nutrients and C as well as of electron acceptors should increase with increasing water depth, particularly over the transition (10 – 50 m) between littoral and pelagic sediments. Increasing diffu-sive fluxes of nutrients and inorganic carbon with increasing water depth have been reported previously by Carignan and Lean (1991) for a mesotrophic lake, but Table 5. Comparison of the magnitude of nutrient release from surface mineralization and from mineralization below the sediment surface
Nutrient Surfacea Subsurfaceb Total
mmol m–2d–1 mmol m–2d–1 % of deposition
carbon 19.0c 6.8d 81 %
nitrogen 1.4e 1.3 83 %
phosphorus 0.22 0.08 61 %
silica 3.1 0.6
a Lander flux minus diffusive flux calculated from porewater profiles. b Diffusive flux calculated from porewater profiles.
c Sum of HCO 3 –and H 2CO3*. d Sum of HCO 3 –, H 2CO3*and CH4.
Sherman et al. (1994) did not observe such a phenomenon in an oligotrophic lake. In L. Vechten oxygen consumption rates are higher in pelagic than in littoral sedi-ments (Sweerts et al., 1991), but diffusive fluxes of sulfate and nitrate have been reported to be similar in littoral and pelagic sediments (Cook et al., 1986, Rudd et al., 1986; Urban et al., 1994).
In this study, systematic changes with water depth were observed in solute concentrations in porewater profiles. Littoral porewater profiles were characterized by lower concentrations of Mn2+, Fe2+, P, Si, NH
4
+and alkalinity compared to pelagic
profiles (Fig. 2). These differences were observed in both late summer and winter and in both lakes of this study. Lower concentrations in the dissolved phase are mirrored by lower concentrations of organic C, N, P, Fe and Mn in littoral compared to pelagic sediments of these lakes (Höhener, 1990; Urban, unpub.; Hupfer, unpub.). Low concentrations in littoral sediments of organic C, N and P are caused largely by focusing of fine particles as discussed above. Biogeochemical as well as physical pro-cesses contribute to the focusing of Fe and Mn and the depletion of these elements in littoral sediments (e.g., Davison et al., 1980; Hilton and Gibbs, 1984). The parallel between concentrations in solid and dissolved phases may indicate a kinetic rather than equilibrium control of porewater concentrations (e.g., Davison, 1991).
Despite the documented focusing of organic matter in both lakes and the higher solute concentrations in pelagic porewaters (Fig. 2), the diffusive fluxes across the sediment surface of carbonate species and Si showed little or no increase with increasing water depth (Table 2, Fig. 4). Diffusive fluxes of NH4+across the
sedi-ment surface were approximately twofold higher in pelagic vs. littoral sites. The small or absent differences between littoral and pelagic sediments may result, in Figure 4. Spatial trends in organic matter deposition and mineralization. Concentrations of or-ganic matter in surface sediments (Höhener, 1989) and sediment inventories of 210Pb (Wieland
et al., 1993) increase with increasing water depth as a result of focusing of fine particulate material. However, diffusive fluxes of NH4+, HCO3–and P do not show parallel trends. Even when fluxes of
CO2and CH4are added to the fluxes of HCO3
–, no significant difference exists between littoral and
pelagic areas. The increase in NH4
+fluxes with increasing water depth is small in comparison to the
part, from the failure of the porewater profiles to reflect the rapid mineralization at the sediment surface. However, the inventories and concentrations of organic matter below as well as at the sediment surface are higher in pelagic than in littoral sites. If production of mineralization products (inorganic carbon, NH4+, P, Si) at
littoral sites with small inputs and pools of organic matter equals production at pelagic sites with large inputs and pools, then the specific mineralization rate (i.e., rate per unit of organic matter) must be higher in the littoral sites. Our data would, therefore, support the hypothesis of Hilton and Gibbs (1984) that mineralization in littoral sediments is more rapid than in pelagic sediments. If mineralization is to be considered as first order with respect to organic matter (e.g., Berner, 1980), then the rate constants for littoral and pelagic sites must be different. Different rate con-stants are thought to result from the different oxygen regimes in littoral and pelagic sediments; greater oxygen availability in littoral areas enhances the activity of bac-terial grazers (Lee, 1992) and the regeneration of other electron acceptors within the sediments and thereby accelerates sediment respiration.
Diffusive fluxes of NO3–, SO 4
2 –, and CH
4across the sediment surface also did not
show the expected increase with increasing water depth (Table 2). Three factors may contribute to this unexpected finding. First, given that the fluxes of inorganic carbon, Si, and P did not increase with increasing water depth, it is not surprising that fluxes of electron acceptors and fermentation products also did not increase. Second, as discussed below, profiles of NO3–and SO
4
2 –often show depletion above
the sediment surface in response to variations in mixing intensity of the water column. Variations in water mixing intensities in epilimnion and hypolimnion may affect the fluxes of these ions and counteract the expected spatial trend. Third, internal cycling of electron acceptors could obviate any relation between net diffu-sive fluxes and gross rates of electron acceptor consumption. Rates of sulfate reduction are 20 – 100 times higher than rates of diffusion of SO42 –into sediment of
L. Sempach as a result of sulfide oxidation within the sediments (Urban, 1994). Similar internal cycles exist for Mn (Thamdrup et al., 1994), Fe (Canfield et al., 1993), and N (Höhener and Gächter, 1994). The cycling of electron acceptors within the sediments or at the sediment-water interface causes the net fluxes of electron acceptors (except for O2) to be lower than the total rates of reduction and could obscure the spatial pattern in total reduction rates.
The difference between diffusive fluxes of Fe2+and Mn2+in littoral and pelagic
sites was highly significant (Table 2). Fluxes of Fe2+ were threefold higher at the
deepest site compared to littoral sites, and fluxes of Mn2+were 10-fold higher. This
would not be surprising if the differences in fluxes could be attributed to different rates of reductive dissolution of Fe and Mn oxides; much higher rates are expected at the pelagic sites due to focusing of these substances (e.g., Davison et al., 1980). However, the calculated diffusive fluxes of Mn and possibly of Fe appear to be a result of dissolution of carbonate phases. No Mn oxides could be detected by EXAFS (Extended X-ray Absorption Fine Structure Spectroscopy) in the upper 2 mm of sediments from the deepest site in L. Sempach; EXAFS, scanning electron microscopy, microprobe analysis, and porewater saturation indices all indicated that Mn was present as a mixed Mn-Ca carbonate (Friedl et al., 1997). As mentioned above, the reductive dissolution of Mn oxides occurring at the sediment-water interface is not recorded in the porewater profiles. Similarly, sequential extractions
indicated that more than 90 % of Fe in the surface sediments of L. Sempach was present as Fe(II) phases (Urban, unpub. data). As discussed below, the similarity in seasonal patterns of Fe2+and Mn2+diffusive fluxes as well as the similar depths of
Fe and Mn dissolution within the sediments suggests that both elements are con-trolled by the same processes. It would appear that the large fluxes of Fe and Mn oxides to pelagic sediments (Wehrli et al., 1995) results in rapid reductive dissolu-tion at the sediment-water interface, and some fracdissolu-tion of the reduced metals (~ 10 % for Mn, 90 – 100 % for Fe; Table 4) are retained as carbonates, phosphates and sulfides (Friedl et al., 1997). Dissolution of these phases controls the porewater concentrations and fluxes measured in this study.
Temporal patterns in porewater profiles and diffusive fluxes
Seasonal variations in deposition of organic matter (Fig. 5) are an important driving force for temporal changes in porewater profiles (Fig. 6). Unlike in shallow lakes where temperature may be a driving variable (Rudd et al., 1990; Urban et al., 1994), temperature remains constant (5 °C) year-round in the pelagic sediments in the
Figure 5. Seasonal variations in depositioin to and release from sediments of nutrients. Deposition of organic C, N and P (bars) as measured with sediment traps above the deepest area of L. Sem-pach shows strong seasonal variations in response to seasonal variations in primary production. In contrast, diffusive fluxes (filled circles) of HCO3–+ CO2, NH4+, and total P calculated from
pore-water profiles (86-m pore-water depth, L. Sempach) show no seasonal variations. Diffusive fluxes represent all measurements at one site over a 3-yr period
deep lakes of this study. However, increased deposition of organic matter in spring and summer months causes higher rates of organic matter hydrolysis and fermenta-tion during these seasons. Rates of acetate producfermenta-tion via fermentafermenta-tion are higher than rates of consumption in early summer, leading to development of a peak in acetate (as well as propionate and formate) concentrations within the first two centimeters of sediments (Fig. 6). The high rates of acetogenesis during this season imply high rates of CO2production. Increased concentrations of acetate and CO2 cause a decrease in pH in the upper sediments. A decline in pH immediately below the sediment surface was observed in all porewater profiles; aerobic respiration is confined to the upper 5 mm of sediments and is unlikely contribute to the pH decline in the peeper profiles. The pH decline indicates that production of CO2via fermentation exceeded consumption of protons during anaerobic respiration.
The seasonal changes in profiles of Ca and Mg (Fig. 7) are believed to result from the seasonal change in pH. The pH decline below the sediment surface pre-sent in all months induces some dissolution of carbonate minerals. The dominant carbonate mineral in L. Sempach is low-magnesium calcite (Kelts and Hsue, 1979). Hence a slight increase in concentrations of Ca and Mg occurs just below the sediment surface in all months. This concentration gradient is considerably steeper (Fig. 7), and diffusive fluxes are higher in summer, presumably as a result of higher rates of fermentation. Enhanced carbonate dissolution in summer also might be related to the higher rates of calcite deposition during May through July (Fig. 7); however, given that surface mineralization of organic matter is not reflected in the porewater profiles, it is unlikely that dissolution of calcite at the sediment surface Figure 6. Seasonal variations in porewater concentrations of Fe2+, Mn2+, and acetate. All profiles
were collected at 86-m water depth in L. Sempach. Transient peaks in concentrations of Fe2+and
Mn2+occurring at depths of 1.5 – 3 cm are thought to result from seasonal dissolution of carbonate
phases induced by enhanced rates of fermentation in summer. The solid triangles represent a profile of Fe2+measured in October one year after the profile depicted by the open triangles
is recorded either. Carbonate dissolution in these eutrophic lakes appears to be driven by fermentation as is observed in sediments of productive marine regions (e.g., Froehlich et al., 1979; Walter and Burton, 1990).
Seasonal changes in profiles of Mn and Fe also appear to be driven by the sea-sonal variations in fermentation. As mentioned above, both Fe and Mn are present primarily in reduced phases. Some dissolution or alteration of these phases evident-ly occurs in all months as evidenced by the increase in Mn concentrations within the upper 5 cm of sediments in all months (Fig. 6). Dissolution would appear to be enhanced in summer months leading to production of peaks in Mn concentrations at depths of 1.5 to 3 cm. In pelagic sediments of L. Sempach, Fe is divided nearly equally between sulfides and carbonates (Urban, unpub.). The similarity between seasonal patterns of Fe2+ and Mn2+ concentrations in pore waters suggests that
the seasonal variations in Fe2+also may be driven by dissolution of Fe carbonate
phases (cf. Wersin et al., 1991). Some caution must be exercised in interpretation of profile shapes, however. First, although low concentrations of Fe2+were observed
twice in autumn, this could result from exposure of the peeper to oxygen (e.g., Carignan et al., 1994). Furthermore, seasonal changes in porewater profiles imply that the assumption of steady state may not be valid for all profiles. The peaks in Fe2+ and Mn2+observed at 3 – 4 cm depth in the summer profiles may not reflect
production of dissolved Fe2+and Mn2+ at these depths at the time of sampling,
Figure 7. Seasonal deposition and dissolution of CaCO3. Deposition (A) of CaCO3(measured
with sediment traps at the center of L. Sempach) shows a marked seasonality with peak deposition in summer months. Porewater profiles of Ca (and Mg; not shown) from the deepest site in L. Sem-pach also show some seasonal features. Profiles are flatter in spring and fall, but show a marked kink at the sediment surface in summer that reflects higher rates of carbonate dissolution
but rather the remnant of a larger peak that had existed previously at shallower depths.
The foregoing discussion is not intended to deny the existence of a seasonal cycle of Mn and Fe reduction. Such cycling does occur in lakes Sempach and Baldegg as evidenced by the seasonal variations in deposition of Fe and Mn oxides (Wehrli et al., 1995; Friedl et al., 1997) and the discrepancies between burial and deposition rates (Table 4). As discussed above, the fact that diffusive fluxes of Mn2+across the
sediment surface are much lower than sedimentation fluxes of Mn oxides provides one line of evidence that the measured porewater profiles fail to capture those processes occurring within millimeters of the sediment-water interface.
The failure of the porewater profiles to reflect surficial processes must be born in mind when examining the seasonal variations in diffusive fluxes of all com-ponents across the sediment surface. Despite the large seasonal variations in inputs of organic matter, no seasonal variations were observed in the diffusive fluxes of inorganic carbon, NH4+, P, or Si (Fig. 5). The absence of seasonal variations
together with the disrepancies between rates of input, output and accumulation (Table 4) constitute strong evidence that surface mineralization is not reflected in the porewater profiles. The calculated diffusive fluxes of nutrients across the sedi-ment surface result from decomposition of organic matter deposited prior to the current year. There is little reason why this accumulated reservoir of organic matter should exhibit seasonal variations in rates of mineralization given that temperatures remain constant in the profundal sediments throughout the year.
The porewater profiles of NO3–and SO 4
2 –do change seasonally (Fig. 8). In early
spring and late fall, both NO3–and SO 4
2 –appear to penetrate slightly deeper into the
Figure 8. Seasonal variations in porewater profiles of NO3–and SO42 –. Depletion of both electron
acceptors begins higher above (NO3–) or within (SO42 –) the sediments during summer months. All
Figure 9. Seasonal variations in diffusive fluxes of electron acceptors. The points represent all measurements made in L. Sempach over a 4-year period (9/89 – 6/93). No clear seasonal trends are apparent. (Filled symbols indicate measurements from littoral sites; all other points were measured at the deepest location.)
sediments than in summer months. In summer months, NO3–depletion begins higher
above the sediment surface than in spring or fall. Such seasonal variations have been reported for several other lakes (e.g., Rudd et al., 1990; Sinke et al., 1992; Sherman et al., 1994), and generally are attributed to increased microbial activity in summer months in response to higher inputs of organic matter. The variations also could indicate temporal variations in the intensity of mixing of the water imme-diately above the sediments.
Curiously, the diffusive fluxes across the sediment surface of NO3–and SO 4 2 –do
not show any seasonal variations (Fig. 9). Sherman et al. (1994) also did not observe any seasonal variations in diffusive fluxes of SO42 –or NO
3
–in an intensive study of
Little Rock Lake. Although measured porewater profiles underestimate the con-centration gradients of these ions at the sediment surface, it also is clear that the dif-fusive fluxes of both of these species underestimate the gross reduction rates that
occur within the sediments. Rates of sulfate reduction in L. Sempach 100-fold greater than rates of SO42–diffusion into the sediments are made possible by high
rates of sulfide oxidation (sulfate regeneration in the mat of Beggiotoa on the sedi-ment surface). Similarly, Sweerts et al. (1991) reported that 27 – 36 % of the NH4+flux
out of the sediments of L. Vechten was oxidized to NO3–at the sediment surface. The
concentrations of both SO2 –4 and NO 3
–in sediment pore waters and immediately
above the sediment surface must be regarded as representing the balance between rates of reduction and regeneration (i.e., oxidation or reduced S and N). The concentration profiles are not, therefore, a satisfactory means for assessing the dynamics of microbial processes of sulfate reduction and denitrification (cf. Lovley and Klug, 1986; Brandl and Hanselmann, 1991).
Summary
Both methodological lessons as well as insights into biogeochemical dynamics of lake sediments may be drawn from this study. In L. Sempach the small-scale spatial variability of the porewater was small in a limited set of replicate profiles. Variabi-lity in diffusive fluxes across the sediment surface is probably element-specific, but averaged 35 %. This study clearly pointed out that porewater profiles with resolution of 0.5 to 1.5 cm do not record the processes occurring at the sediment sur-face. In both of the eutrophic lakes of this study, mineralization at the surface and mineralization below 0.5 cm depth contributed significantly to the recycling of nutrients to the water column. Consequently, any changes in nutrient deposition will require more than a decade to have their full effect; that is, the sediment’s memory of previous conditions will require some time to be erased.
Systematic changes in porewater chemistry and diffusive fluxes across the sedi-ment surface occurred with increasing water depth. Focusing of Fe and Mn oxides led to large differenes between fluxes of these metals from littoral and pelagic regions. Because the porewater profiles did not record surface mineralization, there were not systematic, spatial differences in the diffusive fluxes across the sediment surface of nutrients or inorganic carbon. Seasonal variations in diffusive fluxes across the sediment surface were minor for most solutes despite some marked changes in profile shapes. However, the seasonal variations in seston deposition did drive seasonal variations in rates of fermentation. These seasonal variations in microbial activity in turn caused seasonal variations in mineral dissolution as reveal-ed in the porewater profiles of Ca2+, Mg2+, Mn2+, and Fe2+. The small or absent
seasonal changes in diffusive fluxes of Fe2+and SO 4
2 –despite changes in rates of
reduction of both substances point to the fact that porewater profiles reflect only net reactions. The gross rates of opposing reactions can only be calculated from porewater profiles if the opposing reactions are spatially distinct in the profile. Whereas this is seldom the case in eutrophic lake sediments, porewater profiles generally will underestimate gross rates of microbial activity.
ACKNOWLEDGEMENTS
This work was made possible in part by a Humboldt Fellowship awarded to NRU. The authors thank Gabriela Friedl, Martin, Mengis, and Tobias Schaller for help with sample collection and analysis as well as for helpful reviews of the manuscript. We also thank René Gächter for his insightful review of the manuscript.
REFERENCES
Adams, D. D., 1991. Sediment pore water sampling. Chap. 7 in: A. Mudroch and S. D. MacKnight (eds.), CRC Handbook of Techniques for Aquatic Sediments Sampling, CRC Press, Boston, pp. 171 – 202.
APHA (Amer. Public Health Assoc.), 1984. Standard Methods for the examination of water and wastewater, 16th ed. Amer. Public Health Assoc., Washington, D. C., 1193 pp.
Baker, L. A., N. R. Urban, L. A. Sherman and P. L. Brezonik, 1989. Sulfur cycling in an experimen-tally acidified seepage lake. In: E. Saltzman and W. Cooper (eds.), Biogenic Sulfur. Amer. Chem. Soc., Washington. D. C., pp. 79 – 100.
Baumann, P., 1988. Weitergehenede Gewässerschutzmassnahmen im Einzugsgebiet der luzerni-schen Mittellandseen im Bereich der Landwirtschaft. Gas Wasser Abwasser 68 : 1 – 16. Berner, R. A., 1980. Early Diagenesis: A Theoretical Approach. Princeton Univ. Press, 241 pp. Bloesch, J., 1982. Inshore-offshore sedimentation differences resulting from resuspension in the
Eastern Basin of Lake Erie. Can. J. Fish. Aquat. Sci. 39 : 748 – 759.
Bloesch, J. and U. Uehlinger, 1986. Horizontal sedimentation differences in a eutrophic Swiss lake. Limnol. Oceanogr. 31 : 1094 – 1109.
Brandl, H. and K. W. Hanselmann, 1991. Evaluation and application of dialysis porewater samplers for microbiological studies at sediment-water interfaces. Aquatic Sci. 53 : 55 – 73.
Canfield, D. E., B. Thamdrup and J. W. Hansen, 1993. The anaerobic degradation of organic matter in Danish coastal sediments: iron reduction manganese reduction, and sulfate reduction. Geochim. Cosmochim. Acta 57 : 3867 – 3884.
Carignan, R., 1984. Interstitial water sampling by dialysis: Methodological notes. Limnol. Oceanogr. 29 : 667 – 670.
Carignan, R. and D. R. S. Lean, 1991. Regeneration of dissolved substances in a seasonally anoxic lake: the relative importance of processes occurring in the water column and in the sediments. Limnol. Oceanogr. 36 : 683 – 707.
Carignan, R., S. St.-Pierre and R. Gächter, 1994. Use of diffusion samplers in oligotrophic lake sediments: Effects of free oxygen in sampler material. Limnol. Oceanogr. 39 : 468 – 474. Cohen, Y., W. E. Drumbein and M. Shilo, 1977. Solar Lake (Sinai). 2. Distribution of
photo-synthetic microorganisms and primary production. Limnol. Oceanogr. 22 : 609 – 620.
Cook, R. B., 1984. Distributions of ferrous iron and sulfide in an hypolimnion. Can. J. Fish. Aquat. Sci. 41 : 286 – 293.
Cook, R. B., C. A. Kelley, J. G. Kingston and R. G. Kreis, 1987. Chemical limnology of soft water lakes in the Upper Midwest. Biogeochem. 4 : 97 – 118.
Cook, R. B., C. A. Kelly, D. W. Schindler and M. A. Turner, 1986. Mechanisms of hydrogen ion neutralization in an experimentally actified lake. Limnol. Oceanogr. 31 : 134 – 148.
Davis, M. B., 1968. Pollen grains in lake sediments: Redeposition caused by seasonal water circula-tion. Science 162 : 796 – 799.
Davison, W., 1991. The solubility of iron sulphides in synthetic and natural waters at ambient temperature. Aquatic Sci. 53 : 309 – 329.
Davison, W., G. W. Grime, J. A. W. Morgan and K. Clarke, 1991. Distribution of dissolved iron in sediment pore waters submultimillimetre resolution. Nature 352 : 323 – 324.
Davison, W., S. I. Heaney, J. F. Talling and R. Rigg, 1980. Seasonal transformations and move-ments of iron in a productive English lake with deep-water anoxia. Schweiz. Z. Hydrol. 42 : 196 – 224.
Davison, W., H. Zhang and G. W. Grime, 1994. Performance characteristics of gel probes used for measuring the chemistry of pore waters. Environ. Sci. Technol. 28 : 1623 – 1632.
Davison, W. and H. Zhang, 1994. In situ speciation measurements of trace components in natural waters using thin-film gels. Nature 367 : 546 – 548.
Devol, A., 1987. Deep Sea Res. 34 : 1007 – 1026.
Emerson, S., 1976. Early diagenesis in anaerobic lake sediments: chemical equilibria in interstitial waters. Geochim. Cosmochim. Acta 40 : 925 – 934.
Friedl, G., B. Wehrli and A. Manceau, 1997. The role of solids in the cycling of manganese in eutrophic lakes – new insights from EXAFS-spectroscopy. Limnol. Oceanogr., in prep. Froehlich, P. N., G. P. Klinkhammer, M. L. Bender, N. A. Luedtke, G. Health, D. Cullen, et al., 1979.
Early oxidation of organic matter in pelagic sediments of the eastern equatorial Atlantic: sub-oxic diagenesis. Geochim. Cosmochim. Acta 43 : 1075 – 1090.
Furrer, G. and B. Wehrli, 1993. Biogeochemical process at the sediment-water interface: measure-ments and modeling. Appl. Geochem. Suppl. 2 : 117 – 119.
Gächter, R., D. Imboden, H. Bührer and P. Stadelmann, 1983. Mögliche Massnahmen zur Restau-rierung des Sempachersees. Schweiz. Z. Hydrol. 45 : 246 – 266.
Gächter, R., A. Mares, E. Grieder, A. Zwyssig and P. Höhener, 1989. Auswirkungen der Belüftung und Sauerstoffbegasung auf den P-Haushalt des Sempachersees. Wasser, Energie, Luft 81 : 335 – 341.
Gächter, R. and J. S. Meyer, 1990. Mechanisms controlling fluxes of nutrients across the sedi-ment/water interface in a eutrophic lake. In: R. Bands and J. Giesy (eds.), Fates and Effects of In-Place Pollutants in Aquatic Ecosystems. Lewis Publ., Ann Arbor, pp. 131 – 162.
Gächter, R. and A. Wüest, 1993. Effects of artificial aeration on trophic status and hypolimnetic oxygen concentration in lakes. EAWAG News 34E : 25 – 30.
Hesslein, R. H., 1976. An in-situ sampler for close interval pore water studies. Limnol. Oceanogr. 21 : 912 – 914.
Hilton, J. and M. M. Gibbs, 1984. The horizontal distribution of major elements and organic matter in the sediment of Esthwaite Water, England. Chem. Geology 47 : 57 – 83.
Höhener, P., 1990. Der Stickstoffhaushalt von Seen, illustriert am Beispiel des Sempachersees. Ph. D. Diss., Swiss Federal Technical Institute, Zurich, 132 pp.
Höhener, P. and R. Gächter, 1994. Nitrogen cycling across the sediment-water interface in an euro-phic, artificially oxygenated lake. Aquatic Sci. 56 : 115 – 132.
Hupfer, M., R. Gächter and R. Giavanoli, 1995. Sorption and release of phosphorus on sediment-ing particles. Aquatic Sci. 57 : 305 – 324.
Johnson, K. S., W. M. Berelson, K. H. Coale, T. L. Coley, V. A. Elrod, W. R. Fairey, H. Iams, T. E. Kilgore and J. L. Nowicki, 1992. Manganese flux from continental margin sediments in a transect through the oxygen minimum. Science 257 : 1242 – 1244.
Jorgensen, B. B. and N. P. Revsbech, 1983. Colorless sulfur bacteria, Beggiatoa spp. and Thiovulum spp., in oxygen and H2S microgradients. Appl. Environ. Microbiol. 45 : 1261 – 1270.
Kelts, K. and K. J. Hsue, 1979. Freshwater carbonate sedimentation. In: Lerman, A (ed.), Lakes: Chemistry. Geology, Physics, Springer-Verlag, N.Y., pp. 295 – 324.
Lasaga, A. C., 1979. The treatment of multi-component diffusion and ion pairs in diagenetic fluxes. Amer. J. Science 279 : 324 – 346.
Lee, C., 1992. Controls on organic carbon preservation: The use of stratified water bodies to com-pare intrinsic rates of decomposition in oxic and anoxic system. Geochim. Cosmochim. Acta 56 : 3323 – 3336.
Lehman, J. T., 1975. Reconstructing the rate of accumulation of lake sediment: the effect of sedi-ment focusing. Quat. Res. 5 : 541 – 550.
Lerman, A., 1979. Geochemical Processes: Water and Sediment Environments. John Wiley & Sons, New York, 481 pp.
Lerman, A. and T. A. Liezke, 1977. Fluxes in a growing sediment layer. Am. J. Sci. 277 : 25 – 37. Li, Y. H. and S. Gregory, 1974. Diffusion of ions in sea water and in deep-sea sediment. Geochim.
Cosmochim. Acta 38 : 703 – 714.
Lovley, D. R. and S. Goodwin, 1988. Hydrogen concentrations as an indicator of the predominant terminal electron-accepting reactions in aquatic sediments. Geochim. Cosmochim. Acta 52 : 2993 – 3003.
Lovley, D. R. and M. J. Klug, 1986. Model for the distribution of sulfate reduction and methano-genesis in freshwater sediments. Geochim. Cosmochim. Acta 50 : 11 – 18.
Niessen, F. and M. Sturm, 1987. Die Sedimente des Baldeggersees (Schweiz) – Ablagerungsraum und Eutrophierungsentwicklung während der letzten 100 Jahre. Arch. Hydrobiol. 108 : 365 – 383.
Revsbech, N. P., B. B. Jorgensen and T. H. Blackburn, 1980. Oxygen in the sea bottom measured with a microelectrode. Science 207 : 1355 – 1356.
Revsbech, N. P., L. P. Nielsen, P. B. Christiansen and J. Sorensen, 1988. Combined oxygen and nitrous oxide microsensor for denitrification studies. Appl. Environ. Microbiol. 54 : 2245 – 2249.
Rudd, J. W., C. A. Kelly, D. W. Schindler and M. A. Turner, 1990. A comparison of the acidifica-tion efficiencies of nitric and sulfuric acids by two whole-lake addiacidifica-tion experiments. Limnol. Oceanogr. 35 : 663 – 679.
Rudd, J. W., C. A. Kelly, V. St. Louis, R. H. Hesslein A. Furutani and M. H. Holoka, 1986. Micro-bial consumption of nitric and sulfuric acids in acidified north temperate lakes. Limnol. Oceanogr. 31 : 1267 – 1280.
Sherman, L. A., P. L. Brezonik, L. A. Baker and E. P. Weir, 1994. Sediment porewater dynamics of Little Rock Lake, Wisconsin: geochemical processes, and seasonal and spatial variability. Limnol. Oceanogr. 39 : 1155 – 1171.
Sinke, A. J. C., A. A. Cornelese, T. E. Cappenberg and A. B. B. Zehnder, 1992. Seasonal variation in sulfate reduction and methanogenesis in peaty sediments of eutrophic Lake Loosdrecht, the Netherlands. Biogeochemistry 15 : 19 – 37.
Stadelmann, P., 1984. Die Zustandsentwicklung des Baldeggersees (1900 bis 1980) und die Aus-wirkung von seeinternen Massnahmen. Wasser, Energie, Luft 76 : 85 – 95.
Stadelmann, P., 1988. Der Zustand des Sempachersees. Wasser, Energie, Luft 80 : 81 – 96.
Sweerts, J. P., M. J. Baer-Gilissen, A. A. Cornelese and T. E. Cappenberg, 1991. Oxygen-consuming processes at the profundal and littoral sediment-water interface of a small meso-eutrophic lake (Lake Vechten, the Netherlands). Limmnol. Oceanogr. 36 : 1124 – 1133.
Sweerts, J. P., D. De Beer, L. P. Nielsen, H. Verdouw, J. C. Van den Heuvel, Y. Cohen and T. E. Cappenberg, 1990. Denitrification by sulphur oxidizing Beggiatoa spp. mats on freshwater sediments. Nature 344 : 762 – 763.
Sweerts, J. P., J. W. Rudd and C. A. Kelly, 1986. Metabolic activities in flocculent surface sediments and underlying sandy littoral sediments. Limnol. Oceanogr. 31 : 330 – 338.
Sweerts, J. P., V. St.Louis and T. Cappenberg, 1989. Oxygen concentration profiles and exchange in sediment cores with circulated overlying water. Freshwater Biol. 21 : 401 – 409.
Thamdrup, B., R. N. Glud and J. W. Hansen, 1994. Manganese oxidation and in situ manganese fluxes from a coastal sediment. Geochim. Cosmochim. Acta 2563 – 2570.
Urban, N. R., 1994. Retention of sulfur in lakes. In: Baker, L. A. (ed.), Environmental Chemistry of Lakes and Reservoirs. Amer. Chem. Soc. Washington, D. C., pp. 323 – 369.
Urban, N. R., P. L. Brezonik, L. A. Baker and L. A. Sherman, 1994. Sulfate reduction and diffusion in sediments of Little Rock Lake, Wisconsin. Limnol. Oceanogr. 39 : 797 – 815.
Urban, N. R., R. Gächter and J. Bloesch, 1997. The significance of C : N ratios in particles in lakes, Limnol. Oceanogr., in review.
Walter, L. M. and E. A. Burton, 1990. Dissolutioin of recent platform carbonate sediments in marine pore fluids. Am. J. Sci. 290 : 601 – 643.
Wehrli, B., G. Friedl and A. Manceau, 1995. Reaction rates and products of manganese oxidation at the sediment-water interface. In: C. P. Huang, C. O’Melia and J. Morgan (eds.), Aquatic Chemistry: Interfacial and Interspecies Processes. Amer. Chem. Soc., Washington, D. C., pp. 111 – 134.
Wehrli, B., C. Dinkel, R. Gächter, P. Höhener and N. Urban, 1997. Solute transfer across the sedi-ment surface of a eutrophic lake: Benthic chamber experisedi-ments. Aquatic Sci., in prep. Wersin, P., P. Höhener, R. Giovanoli and W. Stumm, 1991. Early diagenetic influences on iron
transformations in a freshwater lake sediment. Chemical Geol. 90 : 233 – 252.
Wieland, E., P. H. Santschi, P. Höhener and M. Sturm, 1992. Scavenging of Chernobyl 137Cs and
natural 210Pb in Lake Sempach, Switzerland. Geochim. Cosmochim. Acta 57 : 2959 – 2979.
Wüest, A., B. Wehrli, G. Friedl and W. Stumm, 1991. Sanierung des Baldeggersees: Bericht über die Sauerstoff- und Phosphorentwicklung von 1982 – 1990 mit spezieller Analyse des Jahres 1990. EAWAG, Dübendorf, Switzerland, unpub. report, 83 pp., Auftrag 4818.
Züllig, H., 1956. Sedimente als Ausdruck des Zustandes eines Gewässers. Schweiz. Z. Hydrol. 18 : 5 – 143.
Züllig, H., 1982. Untersuchungen über die Stratigraphie von Carotinoiden im geschichteten Sediment von 10 Schweizer Seen zur Erkundung früherer Phytoplankton-Entfaltungen. Schweiz. Z. Hydrol. 44 : 1 – 98.
Received 31 July 1995;