The CERN laser-ion source
By J. COLLIER,* G. HALL,* H. HASEROTH,*
H. KUGLER,* A. KUTTENBERGER,* K. LANGBEIN,*
R. SCRIVENS,* T. SHERWOOD,* J. TAMBINI,*
B. SHARKOV.f A. SHUMSHUROV,t AND K. MASEKJ
*CERN, 1211 Geneva 23, Switzerland tITEP, B. Cheremushkinskaya 25, Moscow, Russia
JPhysics Institute, Czech Academy of Sciences, Prague, The Czech Republic (Received 2 April 1996; accepted 17 April 1996)
This paper describes the first results of a feasibility study undertaken at CERN to deter-mine whether a laser-produced plasma can be used as a source of intense highly charged heavy ion beams. A variety of important measurements have been made, and the re-sults are encouraging. Furthermore, a beam of highly charged light ions produced by the laser ion source has been accelerated successfully in a radio frequency quadrupole (RFQ) structure.
1. Introduction
In 1986, light ions, namely O6+ and S12+, were accelerated successfully in the CERN complex of accelerators for the first time. The success of this light ion acceleration and its subsequent physics program encouraged the construction of a heavy ion accelerating facil-ity, known as the Lead Ion Accelerating Facilfacil-ity, which is now fully operational (Haseroth 1995; Angert et al. 1993). The lead ions are produced by an electron cyclotron resonance (ECR) source (Hill & Langbein 1995). Pb27+ ions are accelerated by the linac, stripped to Pb53+, and multiturn injected into the proton synchrotron booster (PSB). From there they pass to the proton synchrotron (PS), where they are stripped further to Pb82+ before being injected into the super proton synchrotron (SPS).
The next big accelerator to be built at CERN will be the Large Hadron Collider (LHC), and it is foreseen that heavy ions, in addition to protons, will form a major component of the physics program. It can be shown that the present facility has to be upgraded in its particle production by a factor of 20-30 and the emittance decreased to satisfy LHC de-mands (Lefevre & Pettersson 1995).
An alternative to the filling scheme in the reference above could be to generate short, high-current pulses in a laser-ion source (LIS) and to accelerate the ions in the LINAC, PSB or LEAR, PS, and SPS before the filling of the LHC. This paper describes recent developments with respect to this alternative solution.
2. Apparatus
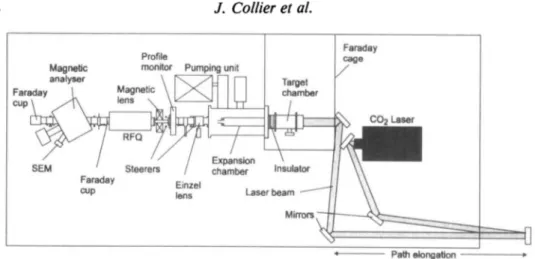
Figure 1 shows the general layout of the laser-ion source experiment at CERN. The CO2
laser is a Lumonics TEA-601A of the Transverse Excitation Atmospheric type, configured in an unstable confocal cavity arrangement. It generates a light pulse with an energy of 50 J at a wavelength of 10.6 /im (infrared). This pulse can be focused onto a solid target, where a plasma is formed.
Magnetic analyser
SEM
Profile
monitor Pumping unit
Target chamber
_ \ Steerers / chamber Insulator Faraday E i n 2 e |
cup |e n s Laser beam
Mirrors
Faraday
r
CO2 Laser
Path elongation
-FIGURE 1. Plan of experimental apparatus.
The chamber containing the target is connected to a variable high-voltage power supply (max. 100 kV) and is isolated from the main vacuum chamber by a ceramic insulator. The laser beam enters the target chamber through an NaCl window and is focused onto the get by a parabolic copper mirror of focal length 30 cm. The plasma is formed on the tar-get surface and expands through a 30-mm diameter hole in the copper mirror into the expansion region, which consists of a system of telescopic tubes directly connected to the tar-get chamber. This creates a region that is free of external fields for the expansion of the plasma.
At the end of this expansion region the ions are separated from the electrons and accel-erated by the electric field in the extraction assembly. The ion beam, which contains a vari-ety of charge states, then enters a low energy beam transport line (LEBT) for transverse matching to a radio frequency quadrupole (RFQ) accelerator, previously used to acceler-ate oxygen and sulphur ions (Wolf et al. 1986; Staples et al. 1983). The LEBT also con-tains two magnetic beam steerers and a retractable profile harp for profile and position monitoring.
The last section of the line is an analysis section comprising a 77° magnetic spectrom-eter with entrance and exit slits and several Faraday cups. The magnet has a bending radius of 0.4 m and a maximum bending force of 0.3 Tm. At the exit of the spectrometer the ions are detected using a secondary electron multiplier (SEM). A combination of a microchan-nel plate (MCP) and a phosphor screen can be used to produce an image of the beam.
The spectrometer can be used to measure the charge state distribution of the unacceler-ated ions as well as that of the accelerunacceler-ated ion beam. It also is used to measure the energy of the beam accelerated in the RFQ.
In principle, any solid material can be used as a target in the LIS. However, for the exper-iments described below, only two target materials were used. These are tantalum for heavy ion investigations and aluminum for the acceleration experiments with the light ion RFQ. Tantalum is used in preference to lead, primarily to limit the damage caused to the copper mirror and the NaCl entry window by the deposition of target material. Due to the higher melting point, far less material is evaporated off a tantalum target than is the case for lead. Tantalum has the additional advantage of isotopic purity, resulting in easier interpretation of the results. Lead and tantalum experiments give comparable results for ions of similar charge-to-mass ratios.
3. Heavy ion experiments
3.1. Laser-produced plasma
The most relevant properties of the plasma and the resultant ion beam are, in our case, the distribution of charge states, the energy distribution associated with each charge state, the ion current density at the source exit, and the ion beam emittance. Measurements of these properties are presented in the following sections.
3.2. Charge state distribution
The charge state distribution of the ions produced in the plasma can be measured using the magnetic spectrometer. For a given magnetic field the analyzer transports all ions with a given momentum per charge, which may be present for a number of charge states. This gives a time-of-flight (TOF) spectrum from which the individual charge states may be observed.
The complete charge state distribution is obtained by recording these spectra for a range of magnetic fields of the magnetic spectrometer. The individual TOF traces then are com-bined by computer to produce a 3D representation of the charge state distribution of ions. The spectra were recorded with a drift distance of 3.12 m from target to detector. Charge states up to Ta23+ were detected. The low charge states are dominant at longer drift times, and the high charge states are clustered together at early times.
Similar experiments using lead have shown a maximum charge state of 31 + . Exper-iments with aluminum and magnesium have shown maximum charge states of 11 + and 12+, respectively. Results obtained with an intermediate mass ion (copper) yield a maxi-mum of 16+.
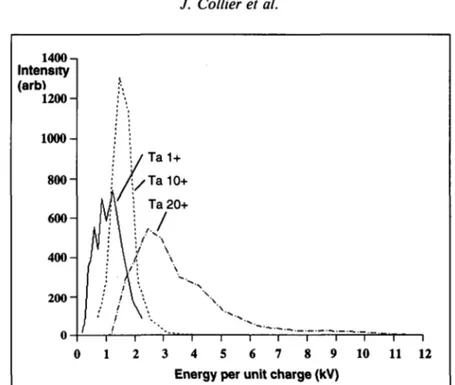
3.3. Ion energy distributions
From the data obtained, the energy spectrum for each charge state can be derived, assum-ing that all of the ions are created only durassum-ing the laser pulse. The splittassum-ing of the lines for the low charge states suggests that some secondary effects are present during the plasma expansion.
Figure 2 shows the distributions of energy per unit charge for Ta1+, Ta10+, and Ta20+ ions. The highest charge states, represented here by Ta20+, have an energy distribution of the order of 5 keV per charge. At a source potential of 50 kV, this would result in a 10% energy spread for the high charge state ions. This is undesirable, and experiments to reduce this energy distribution are summarized in Section 3.6.
3.4. Ion extraction and current density
The plasma expands a given distance through a region that is free of external fields before the ions are extracted. This is to allow the plasma density to fall to a value at which the ions can be extracted with voltages below 100 kV. The extraction system used consists of a three-electrode acceleration/deceleration arrangement that often is used in conventional ion sources (Coupland et al. 1973). The plasma is created at a positive source potential, and the ions are accelerated by a negative extraction electrode. The beam then is deceler-ated by the final grounded electrode of the extraction system. The negative potential of the extraction electrode is used to prevent the acceleration of secondary electrons into the source, as these electrons provide some compensation of the space charge of the acceler-ated beam. The negative voltage also allows the variation of the extraction voltage at a fixed source potential.
1400 Intensity (arb) 1200 1000-0 1 2 3 4 5 6 7 8 9 10 11 12
Energy per unit charge (kV)
FIGURE 2. Energy per unit charge distribution for Ta1 + , Tal 0 +, and Ta20+. Intensities measured using a secondary electron multiplier.
Figure 3 shows the current measured in a Faraday cup placed immediately after the ex-traction system, for the case of tantalum ion exex-traction. The drift distance before extrac-tion was set to 0.6 m; the electrode voltages were +60 kV, —10 kV, and 0 V; the outlet aperture diameter was 15 mm; and the extraction gap was 15 mm. The initial spike of the pulse had a duration of approximately 5 /*s and a current of 50 mA. It was followed by
250 H 200 < §•150
uioo
50 0 High charge states-t-f\
H 0 4 8 12FIGURE 3. Tantalum ion beam current measured in a Faraday cup.
16 20 time (us)
a second current maximum. This second part, however, contained only the low charge states and was therefore of minor interest. From the velocity distribution it can be deduced that after a drift of 0.6 m the high charge states are found only in the first current peak. The current density at the maximum of this initial peak is 29 mA cm"2. The average cur-rent density throughout the 5 jts of this peak is about 17 mA cm"2. Assuming an average charge state of 16+, the average extracted ion flux is 3.1 X 10¹⁰ ions/cm2 during this time.
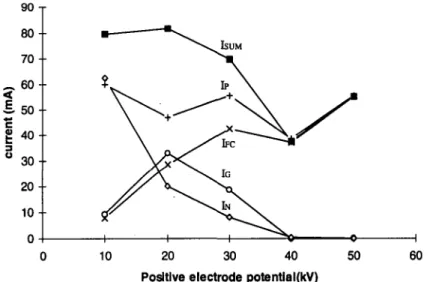
To ensure the extraction of all of the ions in the high charge state peak, it is important to choose a sufficiently high extraction voltage to match the ion current to the extraction system. The effect of the application of insufficient voltages can be seen in figure 4. The currents measured in the Faraday cup (IFC), the current in the high voltage line to the tar-get chamber (IP), the current measured on the negative electrode (IN), the current on the ground electrode (/G), and the sum of the currents (Isum = IFC + IN + IG) are plotted for a range of source potentials. For high extraction voltages the current leaving the target chamber (IP) roughly equals the current IFC measured in the Faraday cup. As the voltage is reduced, an ion current is measured on the negative and ground electrodes and ISUM becomes larger than IP, due to electron emission from the electrode surfaces.
Computer programs such as IGUN (Becker & Herrmannsfeldt 1991) and AXCEL (Jaeger
et al. 1975) can be used to simulate the extraction process in the static case, provided that
the plasma parameters are known. However, certain assumptions must be made, e.g., the initial ion velocity must be smaller than the electron velocity to avoid the creation of a negative plasma potential.
To study the temporal behavior, an attempt was made to simulate ion extraction using the program MAGIC (Goplen et al. 1994). This program allows the simultaneous treatment of electrons and various charge states of ions, and can be used to study the evolution of an expanding plasma. Figure 5 shows the result obtained for the extraction of tantalum ions using the conditions described in figure 3 and assuming an energy distribution accord-ing to the data in figure 2. Only two charge states, i.e., Ta10+ and Ta20+, were considered. (Note the expanded scale in r.)
ISUM
10 20 30 40
Positive electrode potential(kV)
FIGURE 4. Ion beam currents measured to the extraction electrodes and in a Faraday cup. IN =
nega-tive electrode, IG = ground electrode, IFC = Faraday cup current, IP = positive electrode,
IG-3.0 2.5 2.0 1.0 0.5 Plasma Electrons -10kV +60 kV -4
FIGURE 5. Simulation of ion extraction using the program MAGIC. Only three particle types are con-sidered: electrons, Tal0+, and Ta20+.
One can observe the formation of a concave boundary at which all electrons are reflected (the ion beam appears darker on the plot), comparable to the boundary found in other sim-ulation programs. A separation of the two charge states becomes visible at the entrance of the ground electrode. This is due to the assumption of initially equal ion velocities in the plasma, which results in a different rigidity of the different ions in the electric field. At higher beam currents the plasma boundary becomes convex, resulting in a diverging ion beam. These simulations show that the perveance of the extracted beam should be in the region 1-2 x I0~8 x {z/A)ul [A/V3/2] (with z = charge state and A = mass number). Therefore, a source potential of 60 kV should correspond to a 60-mA extracted beam current.
3.5. Charge state distribution of extracted beam
A charge state distribution analysis, similar to that described in Section 3.1, was per-formed on the extracted ion beam to determine if there was a significant change from the distribution found in the plasma.
The interpretation of the spectrum is more complicated than in the case without accel-eration. There are many additional lines in the low charge state region that last for long times. These satellite lines can be attributed to recombination (Hall et al. 1995). Further satellite lines are due to light ion contaminants, such as oxygen and carbon. High charge states are present very early during the ion pulse and appear well before the lower charge states and extraneous ions.
3.6. Beam emittance
The charge states of interest only are present for a few /*s during the first spike of the extracted ion pulse. Thus, to measure the emittance, it is necessary to use a device that can be activated for that specific part of the beam pulse only. Due to variations from pulse to pulse, and due to the low repetition rate, it is desirable to perform the measurement dur-ing a sdur-ingle shot.
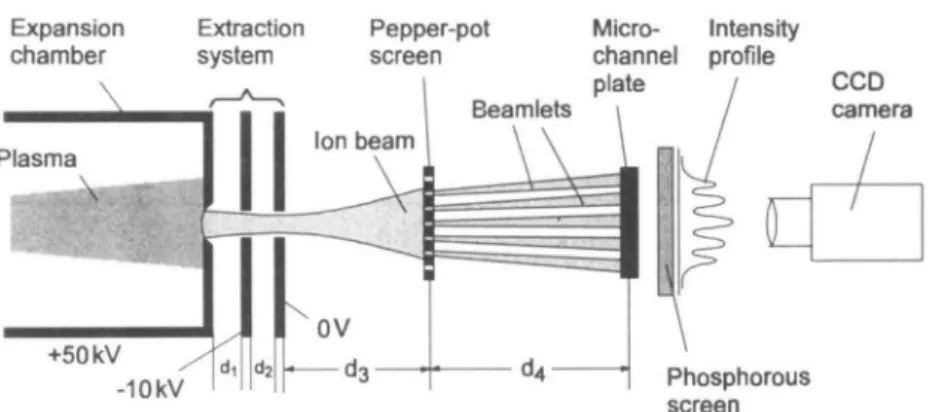
Expansion Extraction Pepper-pot Micro- Intensity chamber system screen channel profile
plate / CCD Beamlets i / camera
-10kV Phosphorous
screen
FIGURE 6. Emittance measurement using a pepper-pot screen. d\ = 15 mm, d2 = 15 mm, d}
25 mm, dA = 145 mm, aperture radius of extraction system = 7.5 mm.
The apparatus used is shown schematically in figure 6. The ion beam impinges on a foil containing a square array of holes each with a diameter of 80 pirn. This foil is positioned 25 mm after the final extraction electrode. The beamlets that pass through the holes are detected after a drift of 145 mm by means of a microchannel plate (MCP) and a phosphor screen assembly that turns the spatial pattern of the arriving beamlets into a light pattern on the screen. This pattern then is imaged onto the input plane of an image-intensified CCD camera and recorded by computer. The MCP is activated by a 1-kV pulse of ~800 ns duration that is positioned at the point of interest during the ion current pulse. The result-ing image intensity then is integrated in a vertical or horizontal direction and a phase space plot is constructed (Collier et al. 1995). The phase space plot is obtained during the 800-ns time window located at the peak of the 60-mA-high charge state pulse. The emittance is 100 mm.mrad for 90% of the beam current at an extraction voltage of 50 kV.
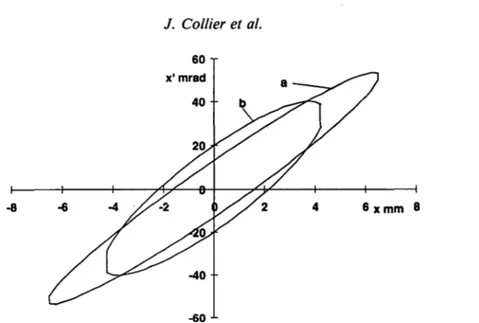
Measurements made at two different times and thus at different currents during the first pulse give the phase space ellipses shown in figure 7. The emittance remains constant but the shapes of the ellipses are different.
3.7. Reduction of energy spread
As was mentioned in Section 3.2, the high charge state ions in the plasma can have large energy distributions of the order of 5 kV per charge. This corresponds to a 10% energy spread at 50-kV extraction voltage. Experiments to reduce this energy spread have been ducted by using a source potential that increases in time. The early part of the pulse con-taining the high energy ions therefore is extracted using a lower voltage than the late part containing the ions with the lower energies. The energy spread of the resulting ion beam thus can be reduced.
Figure 8 gives an example of what can be achieved. The MCP/phosphor screen assem-bly was positioned at the exit of the magnetic spectrometer and the exit slits were removed. This provided a means of observing the image produced by two adjacent charge states of the accelerated tantalum ion beam. The energy spread can be estimated from the width of the produced images. Figure 8a shows the images of Ta18+ and Tal9+ for a beam extracted at a constant source potential of 63 kV. Figure 8b shows the same two charge states when the source potential is increased from 54 to 64 kV over a period of 8 ^s, coincident with the initial peak of the ion pulse. Figure 8c is a plot of the integrated intensities shown in figures 8a and 8b. A narrowing of the image is evident and corresponds to a reduction in energy spread from about 10% to approximately 3%.
-60 x
6 xmm 8
FIGURE 7. Transverse phase space ellipse for a Ta ion beam after 66-kV extraction, (a) Measured
during the current peak (45 mA). (b) Measured during the current tail (10 mA).
18+ AW 150 100 50 0 -18+ - Unmodulated M
- jh
Modulatedn\
l/M
I
I
B c 1 51 101 151 201 251 301 351 Distance on MCP (arb) (c)FIGURE 8. CCD camera images after spectrometer for (a) unmodulated and (b) modulated extrac-tion voltages, (c) Vertical integraextrac-tion of the images.
4. Light ion experiments
4.1. Light ion extraction and RFQ matching
The preceding discussions concerned the production of highly charged heavy ions and some of the properties of the heavy ion beams generated. The next step in the development of a pre-injector was to accelerate an ion beam in an RFQ structure, since RFQs form the first bunching and accelerating structure of modern linacs. At CERN such an accelerator, which formerly was used for the acceleration of sulphur and oxygen ions, was available. As this RFQ was designed for the acceleration of light ions only, the element chosen as a target material was aluminum. The RFQ input energy of 5.6 keV/u corresponds to a 15-kV extraction voltage for Al10+.
If light elements are used, the plasma density produced with the laser ion source is very high. Therefore, the length of the expansion chamber was set to the maximum possible with the present apparatus, to keep the total extraction current low. Two sets of extraction elec-trodes were used with either 10- or 15-mm apertures.
The ion current was measured at 10 /*s in a Faraday cup at a distance of 100 mm after the extraction system. The initial spike with a current of > 120 raA lasts for about 3 us in this case. At the required low source potential, this large current leads to a mismatch of the extraction system (cf. Section 3.3) and also results in a very high space charge of the beam. However, although 90% of the total current was lost, the highest transmitted cur-rents through the RFQ were obtained with these extraction conditions.
Following extraction, the correct input conditions for the RFQ were provided using the low energy beam transport line (LEBT). The first element in this line was an electrostatic Einzel lens. It had an aperture diameter of 100 mm and was located at a distance of 650 mm after the ground electrode of the extraction system. The amount of current entering this lens was approximately 15 mA, and a large amount of the total extraction current was lost on the relatively long drift. The second lens in the line that provides the final focusing to the RFQ is a pulsed magnetic solenoid lens with an inner diameter of 44 mm.
To optimize the lens parameters, the MCP was placed at the input plane of the RFQ and the beam profile was measured during the part of the ion pulse containing the required charge states. The gating facility allowed the determination of the correct settings of the two lenses for the relevant part of the current pulse. Apertures were used to fix the correct input angle for the RFQ.
4.2. RFQ acceleration
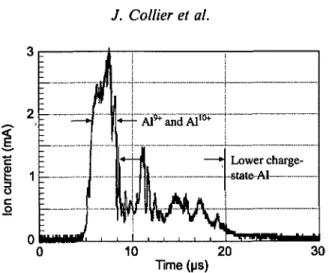
Once the optimum conditions were found, the ion current at the input plane of the RFQ was measured using an aperture-restricted Faraday cup. Approximately 5 mA were present during the first spike of duration 4 us. This part of the current pulse was known to con-tain the highest charge states. All0+, which was the largest component of the beam, was chosen as the nominal ion to be accelerated by the RFQ.
The RFQ was installed in the position of the MCP, and after a further optimization of the parameters the output current of the RFQ was measured using a Faraday cup at the RFQ exit (figure 9). Approximately 3 mA were accelerated by the RFQ. The charge state distribution of the output beam was found to contain Al9+ and Al10+ in approximately equal proportions. Theoretical calculations of the RFQ give 65% transmission under these space charge and energy spread conditions (Lombardi 1993).
5. Discussion and future developments
The results detailed in this paper have demonstrated a number of positive aspects of the use of a laser-produced plasma as an ion source. There has been a clear demonstration that
2 1 -o I 1 I 1 1 I 1 1 1 1 1
: -1 r
:
r
Lower charge-cfotp Al 10 20 Time (us) 30FIGURE 9. Aluminum ion current measured in a Faraday cup after the RFQ.
substantial quantities of high charge state heavy ions (6 x 10¹⁰ ions in 5 /*s) can be pro-duced by the laser ion source. The extraction of these ions from the plasma was accom-plished and the emittance of the resultant beam could be measured. The results achieved for tantalum, and also of lead ions from the LIS, encourage further development toward a source satisfying LHC requirements for luminosity. Although the energy spread of the high charge state heavy ions produced by the source is relatively large, a method of reduc-ing this to a more acceptable level has been found.
A high current, high charge state light ion beam has been produced and successfully accel-erated in a radio frequency quadrupole structure, an important milestone for the project.
The next stage in the development of the laser ion source experiment at CERN will be to demonstrate that a heavy ion beam produced by an LIS also can be accelerated in an RFQ. A dedicated RFQ structure is currently under construction for this purpose. Addi-tionally, work is progressing on the design of a laser that is capable of producing three times the output energy of the existing system with a repetition rate of 1 Hz.
REFERENCES
ANGERT, N. etal., eds. 1993 CERN Heavy-Ion Facility Design Report, CERN 93-1. CERN, Geneva.
BECKER, R. & HERRMANNSFELDT, W.B. 1991. Proc. 4th Int. Conf. on Ion Sources. Bensheim,
Ger-many, pp. 2756-2758.
COLLIER, J. et al. 1959 CERN PS/HI Note 95-07(Tech).
COUPLAND, J.R. et al. 1973 Rev. Sci. Instrum. 44(9), 1258.
GOPLEN, B. et al. 1994 Mission Research Corporation, MRC/WDC-R-326. Newington, Virginia.
HALL, G. et al. 1995 CERN PS/HI Note 95-19(Tech).
HASEROTH, H. 1995 1995 Particle Accelerator Conference, Dallas.
HILL, C.E. & LANGBEIN, K. 1995 Proc. ICIS'95, Vancouver.
JAEGER, E.F. & WHITSON, I.C. 1975 ORNL/TM-4990. Oak Ridge, TN.
LHC Study Group 1995 The Large Hadron Collider, Conceptual Design, P. Lefevre and T. Petters-son, eds. CERN AC 95-05(LHC).
LOMBARDI, A. 1993 CERN PS/HI Note 93-05.
STAPLES, J. et al. 1983 Conf. on High-Energy Accelerator. Batavia, IL, USA, August.