David 0. Wood Martha J. Mason
MIT Energy Laboratory Report No. MIT-EL 81-017 April 1981
Energy Model Analysis Program
Analysis Quality Report on the
EIA Annual Report to Congress 1978, Volume III: Coal Supply
by David 0. Wood Martha J. Mason
Submitted to
Office of Analysis Oversight and Access Office of Applied Analysis
Energy Information Administration Department of Energy
January 1980 (draft) April 1981 (final) MIT-EL 81-017
This research was supported by the Department of Energy under MIT-DOE Institutional Agreement No. EX-76A-01-2295.
This report was prepared as an account of work sponsored by the Department of Energy. Neither the United States nor any agency thereof, nor any of their employees, makes any warranty, expressed or implied, or assumes any legal liability or
responsibility for any third party's use or the results of such use of any information, apparatus, product, or process dis-closed in this report, or represents that its use by such third party would not infringe privately owned rights.
The material in this report draws heavily on an evaluation of the Coal and Electric Utilities Model documentation reported in Goldman et al. [1979], and on the Energy Model Analysis Program indepth evaluation of that model reported in EMAP[1980]. We acknowledge the contributions and support of Neil Goldman, James Gruhl, Michael Manove, and Fred
Schweppe. We also acknowledge the comments and substantive contributions of George Lady, Susan Shaw, and John Herbert, all of the EIA Office of Analysis Oversight and Access. Finally, we are seriously in debt to Mr. Peter Heron for editorial assistance in preparing and publishing this report.
prepare an Annual Report to Congress (ARC) which includes projections of energy supplies, consumption and prices, as well as the relation of
energy to other economic activity. As an aid to users of ARC, the EIA Office of Analysis Oversight and Access (OAOA) is preparing "Analysis
Quality Reports" on particular components of the energy information analysis system used in developing the ARC-78 projections. This report focuses on the Coal Supply Module used for the midterm projections of the ARC-78. The Coal Supply Module is part of the EIA's National Coal
Model. The review and analysis presented here is based upon the MIT Energy Model Analysis Program's (EMAP) evaluation of the documentation and implementation of the Coal Supply Module sponsored by OAOA, and an indepth evaluation of a related model--the ICF Coal and Electric
Utilities Model--which also employs the EIA Coal Supply Module. The indepth evaluation has been sponsored by the Electric Power Research Institute.
1. Introduction
2. Description of the Coal Supply Module in the National Coal Model and its use in ARC-78.
2.1 Review of Materials
2.2 Summary Description of the Coal Supply Module 2.3 Relation of Coal Supply Module to Midterm Energy
Market Model
3. Verification Analysis of the Implementation and Use of the Coal Supply Module in ARC-78
4. Evaluation of the Coal Supply Module in the National Coal Model and its use in ARC-78
4.1 Data
4.2 Logical and Mathematical Structure
5. Empirical Analysis of Key Uncertainties in Data and Structure 5.1 Sensitivity to Reserve Base (CDRB)
5.2 Uniform Versus Lognormal Distribution for Unallocated Reserves
5.3 Coal Royalties and Rents 5.4 Coal Production Costing
5.4 Potential Coal Production Rates and Mine Lifetime References
Appendix A.1 Analytical Formulation of the Coal Supply Cost Function and Associated Elasticities
Appendix A.2 The Concept of Minimum Acceptable Real Annuity Coal Prices--A Formulation
1-1 2-1 2-1 2-2 2-6 3-1 4-1 4-1 4-28 5-1 5-3 5-7 5-9 5-13 5-17 A-1 A-1 6
The Energy Information Administration (EIA) is charged by Congress to prepare and submit an Annual Report to Congress (ARC). In particular,
EIA is directed to prepare "..projections of energy production,
consumption and prices, in addition to their economic and other related consequences" (EIA[1979,p. xvii]). An important objective of the Annual Report is to organize and interpret factual materials to improve
understanding of the nation's energy-related condition, and to project future developments in the short, medium and long term. The EIA Annual
Reports are thus an important national resource for improving, understanding, and providing background for the development and interpretation of national energy policy.
ARC's mandate to present short, medium and long term projections requires that an information analysis system be developed and used to organize factual and analytical information, and to support developing projections. Users of the ARC must be assured that such systems exist, are understood by energy analysts in general, and have been evaluated and
found to represent good scientific practice for the purposes of the ARC. The EIA has developed or sponsored components of such an energy information analysis system. In preparing the ARC projections, many of these component systems have been used. Likewise, EIA is developing and applying procedures and guidelines for documentation and evaluation of these information analysis systems. A survey of these various activities is provided in Wood [1981].
The EIA Office of Analysis Oversight and Access (OAOA) is responsible for the review and evaluation of the ARC. As a means of combining its
organizing and presenting evaluative materials relating to particular information analysis systems used in preparing ARC projections. A
distinguishing feature of the "Analysis Quality Reports" is that they are explicitly intended for users of the ARC, not just for the conmunity of energy analysts familiar with the EIA's modeling systems.
The Energy Model Analysis Program (EMAP) of the MIT Energy Laboratory has been conducting documentation and model evaluation projects for EIA and other sponsors bearing on the Coal Supply Module employed in the preparation of ARC-78 midterm projections. EMAP was therefore contracted by OAOA "to prepare a report, using the results of any such validation projects in addressing the quality and usefulness of the projections of coal production for the years 1985, 1990 and 1995 given in the EIA Annual Report to Congress 1978, Volume III" (OAOA [1979]).
This "Analysis Quality Report" for the midterm coal supply projections used in the 1978 Annual Report to Congress (ARC-78) is organized as follows. In Chapter 2 we summarize the materials employed in the evaluation, and present a summary of how the coal supply module fits into the larger information analysis system employed in the ARC-78. In Chapter 3, the results of a verification analysis on the
implementation and application of the Coal Supply Module are presented. Chapter 4 presents a validation analysis of the data, logical and
mathematical structure of the Coal Supply Module, and Chapter 5 presents results from an empirical investigation of the sensitivity of projection results to uncertainties in the Coal Supply Module data and structure.
ITS USE IN ARC-78
The energy information analysis system underlying the midterm projection of ARC-78 is the EIA Midterm Energy Forecasting System
(MEFS). The MEFS includes as one component the National Coal Model which in turn includes a Coal Supply Module. In this chapter we first identify those aspects of the ARC-78 which reflect the NCM Coal Supply Module, the documentation of the Coal Supply Module (CSM), and relevant evaluation studies. Then a summary description of the CSM is presented, supported by a more technical description in Appendix A, and followed by a
description of how the outputs of CSM are transformed and used as inputs to the Midterm Energy Market Model (MEMM), the integrating model which combines the various modules into a system for generating the ARC-78 projections.
2.1 Review of Materials
This "Analysis Quality Report" focuses upon the Coal Supply Module (CSM) of the National Coal Model as used in developing midterm
projections in ARC-78. The main place in which the analysis based on the CSM is represented in ARC-78 is in Chapter 9 of Volume III, entitled
"Coal Supply." In this chapter, EIA provides some historical
perspectives and short-term projections. However, it is the section on mid-term projections for the years 1985, 1990, and 1995 which concern us here. Projections are made in ARC-78 concerning production quantities and prices for coal, by region/mine type and by region/coal type
(designated by sulfur content). In addition, the results of sensitivity tests are reported; these tests altered the price of imported oil, coal transportation costs, and production of western coal. The data presented
Supplement One to Volume III. In particular, Series C Tables 16 and 17 provided the less aggregated data upon which Tables 9.2 and 9.3 were based. In the next section of this report, we present results of a verification and error correction of the Coal Supply Module, and suggest how this may alter the projections made by EIA in Chapter 9. In Section 5 of this report, we turn to the sensitivity analysis, and suggest how uncertainty in model results may be affected.
2.2 Summary Description of the Coal Supply Module*
The supply curves employed in the Coal Supply Module (CSM) are based on the coal supply methodology that ICF, Inc. developed in its Coal
Supply Analysis for FEA's Project Independence Evaluation System (PIES).
A description of the methodology follows.
The coal supply sector of the CSM consists of price sensitive, multi-stepped coal supply curves for each coal type that exists within each supply region. The curves are used to simulate potential production levels available at various prices. Each step of a supply curve
represents a different type of mine. The length of each step gives the potential production level for each mine type. The height of each step
is called the "minimum acceptable selling price" (known as the
"reservation price" in economic terminology) and is based on average variable costs for existing mines and average total costs for new mines.
The supply curves are developed in six major steps. The first step defines appropriate coal supply regions and coal types. In the CSM there are 30 supply regions, aggregated into 12 regions as shown in Table 2-1.
ARC-78 COAL SUPPLY REGIONS Northern Appalachia
Pennsyl vani a Ohio
Maryland
West Virginia, North Southern Appalachia Al abama
Central Appalachia West Virginia, South Virigina East Kentucky Tennessee* Midwest West Kentucky Illinois Indiana East North Great Plains
North Dakota South Dakota
East Montana Central West
West North Great Plains Western Montana Wyomi ng Northern Colorado Gul f Texas Iowa Missouri Kansas Arkansas Oklahoma Rocky Mountains Colorado, South Utah Northwest Washington Southwest Arizona New Mexico* Alaska Alaska
*Minor problems exist in these regions, in that parts of the states fall into other jurisdictions. See Section 4.1.2.
categories, including two special sulfur levels designed specifically to allow for deep cleaning to meet either the New Source Performance
Standard (less than .60 pounds of sulfur per million BTUs) or State Implementation Plans (a one percent sulfur emission limitation for existing sources). All bituminous coals receive a standard level of washing. The supply regions and the coal types form the basis for allocating the Bureau of Mines (BOM) Demonstrated Reserve Base into regional coal type categories.
The second step estimates future output from existing mines (using existing production data and expected mine closings) by region and coal type. The third step determines the minimum acceptable selling price for the future output of these existing mines. For such mines capital has
been sunk so the minimum acceptable selling price covers only variable costs, i.e., revenues must cover variable operating expenses. The first
steps on each supply curve represent coal production from existing mines. The fourth step analyzes demonstrated reserves that have not yet been developed. The model allocates these uncommitted reserves by region and coal type to hypothetical model mine type categories, defined in terms of overburden ratio and mine size for surface mines and in terms of seam thickness, seam depth, and mine size for deep mines. For a given mine
type, region, and coal type the assigned stock of reserves is then translated into a potential production flow (annual production level) using mine lifetime and recovery factor parameters.
The fifth step estimates the minimum acceptable selling price (MASP) for each mine type in each region. This is the price that provides for the recovery and return on invested capital in addition to covering
producer would accept for his product and still operate profitably in the long run. The MASP is estimated using engineering mine-costing
algorithms as a function of key reserve characteristics (i.e., overburden ratio, mine size, seam thickness, and seam depth).
The last step arrays the mine types in each region for each coal type in order of ascending minimum acceptable selling price, thus generating a step-function supply curve. The height of each step is determined by the
MASP (on a per-annual-ton basis) of the associated mine type. The length of each step is determined by the annual potential production level of the mine type.
Estimates of the minimum acceptable selling price per ton of coal for each of approximately 190 hypothetical mine types are developed. This was accomplished by the construction of two "base case" model mines (one surface and one deep) and a matrix of cost adjustment factors for costing changes in key variables. The base case cost models were developed from existing mine cost studies by BOM and TRW and from information obtained by ICF through interviews with mining engineers and coal economists. The cost adjustment factors employed were based on extrapolations of
relationships observed in the existing mine cost models and judgments based on consultations with mining engineers. It should be understood that the costing methodology used in the Coal Supply Module does not take into account all possible cost-influencing variables such as roof, floor, water and gas conditions, however the model developers believe that the major influences on mining costs have been captured.
A more technical description of the Coal Supply Module is presented in Appendix A.
The basic documentation of the relation between the Coal Supply Module (SCM) of the NCM and the MEMM is Shaw et al. [1979], which also
includes a summary description of the CSM/NCM. As noted, the 30 NCM regions are aggregated into 12 MEMM regions and a raw data table is created with the following columns:
- minimum acceptable selling price in dollars per ton, including
all direct costs plus severance taxes, reclamation costs, and adjustments for Alaskan production where applicable;
- maximum level of production in millions of tons per year for each step in the supply curve for each type of coal;
- proportion of production from surface mines;
- present value of the intial capital investment in millions of
dollars per million tons of coal per year, or dollars per annual ton required between 1977 and the target year to open new mines;
- present value of the deferred capital investment in dollars per ton per year required between 1977 and the target year to open new mines.
The coal raw data tables are then input to the Coal Preprocessor which - formats the raw data for input to the LP
- converts data units:
-- Production: MMTon/year to MTon/Cal. Day -- Prices, costs: $/ton to M$/MTon
-- Capital costs: MM$/MMTon/year to MM$/MTon/Cal. Day -- Set mine retirement rate = 3.5% for regions 1-4, and
3-1
3. VERIFICATION ANALYSIS OF THE IMPLEMENTATION AND USE OF THE COAL SUPPLY MODULE IN ARC-78
In the preceding sections we have outlined the methodology and general design of the coal supply module of the NCM. At the initial startup of a model evaluation effort, preliminary understanding of the structure and formulation of a model is developed by reading and relying upon available model documentation. An essential next step, however, is to perform an analysis to verify that the methodology indicated in the documentation was actually implemented in the computer code in an
error-free fashion. Both the computer code and the documentation must be checked for internal consistency, as well as the accuracy of their
relation to each other. We term this process "verification." In this chapter we report on the results of the verification of the Coal Supply Module (CSM) and relate the implications of the verification results to the coal production projections reported in ARC-78.
The verification of the NCM consisted of three basic steps: a
comparison of the documentation with the computer code and data files, an analysis of the computer implementation, and an independent reprogramming of the coal production costing portion of the CSM.* This reprogramming utilized a logical sequence different from that in the NCM, and was a very effective verification method; correspondence of the two codes was assured by parallel runs that matched coal supply prices to five decimal places.
During the verification work, the M.I.T. analysts worked first with the computer code as it was received from the modelers. This version of
*The description here of the verification process and results is based primarily on Goldman et al. [1979).
several errors in the Base Case, and also identified a number of other issues relating to understandability of the programming. Many of the errors were then corrected at M.I.T., and the corrected version of the code was identified as the Corrected Base Case (CBC). Sensitivity
analysis was performed on both the Base Case and the Corrected Base Case in order to determine the effects of the errors as well as to determine the effects of changes in variables and parameters.
The following is a summary of the more important errors identified during the verification process. None of the errors by itself has been deemed to be of critical importance, although the summation of small
factors can sometimes lead to more significant perturbations in results than might be expected. The errors involved the following:
o an incorrect modeling of the deep-cleaning of all metallurgical coals, resulting in the double counting of deep-cleaning costs
for certain coal types, and other related problems;
o an incorrect escalation of base-year (1975) price data for existing mines;
o skipping one year of cost escalation between the base year and the case year (1985) in the calculation of real annuity coal prices;
o inappropriate method for approximating treatment of initial capital cost expenditures;
o an incorrect escalation of the property taxes and insurance component of coal mine operating costs;
o an incorrect calculation of base-year Union Welfare Costs for coal mines;
o changing the smallest seam thickness input value in the midst of cost calculations for deep mines;
o improperly allocating more than 100 percent of deferred capital over the lifetime of a mine when the lifetime is not perfectly divisible by four.
o In parts, the Supply Code relates to old code used for the PIES Coal Supply Analysis.. Such code may lead to user confusion; o Because of an undocumented "patch" that exogenously overrides
the coal supply curve output for Utah bituminous low-sulfur coal, this particular supply curve should be considered invalid for sensitivity runs involving regeneration of supply curves; o Real escalation of cost factors is not appropriately accounted
for in 1990 and 1995 case-year model runs; and
o The implementation of a change in the general rate of inflation is not at all straightforward and may lead to user confusion. Those errors that could be corrected without significantly changing the structure of the Coal Supply Module were corrected by the M.I.T. analysts. Such corrections related to the calculations of reserve fractions, coal cleaning costs, property taxes and insurance, definition of base year dollars, depreciation charges, welfare costs, smallest seam thickness, labor costs, allocation of deferred capital, Oklahoma
reclamation costs, and escalators for initial capital and existing mine prices.* The implementation of the corrections led to the development of the Corrected Base Case (CBC).
In order to determine the effects that the errors alone had on model results, Base Case output was compared with Corrected Base Case output. The results of this comparison are summarized in Tables 3-1 and 3-2 for two important factors--national coal production amounts and average coal production prices. In these tables, the percentage changes due to the effects of the corrections appear in parentheses. Some of the more interesting and signficant effects of the corrections include:
*A detailed discussion of the errors and their corrections may be found in Goldman et al. [1979).
NATIONAL COAL 1985 Metallurgical BC CBC Low Sulfur BC CBC Medium Sulfur BC CBC High Sulfur BC CBC Surface BC CBC Deep BC CBC Total BC CBC 153.49 163.57 (+6.6%) 291.71 284.83 (+2.4%) 412.13 411.75 (-.09%) 260.07 254.90 (-2.0%) 598.94 599.68 (-.12%) 518.44 515.37 (-.59%) 1117.38 1115.05 (-.21%) Table 3-1 PRODUCTION (MM TONS) 1990 154.33 169.93 466.29 459.77 550.35 544.92 342.63 330.45 776.73 779.49 736.87 725.58 (+10.1%) (-1.4%) (-1.0%) (-3.6%) (+.35%) (-1.5%) 1513.60 1505.07 (-.56%) 1995 164.01 173.23 (+5.6%) 577.21 623.49 (+8.0%) 664.65 641.73 (-3.4%) 456.07 437.12 (-4.2%) 913.39 962.60 (+5.4%) 948.54 912.97 (-3.9%) 1861.93 1875.57 (+.73%)
BC = Base case of model as transmitted to M.I.T.
CBC = Corrected base case of model after error correction by M.I.T. analysts.
Table 3-2
AVERAGE COAL PRODUCTION PRICES (1978 $/MMBtu)
1985 1990 1995 Metallurgical BC CBC Low Sulfur BC CBC Medium Sulfur BC CBC High Sulfur BC CBC Total BC CBC 1.64 1.66 (+1.2%) 0.83 0.85 (+2.4%), 0.99 1.02 (+3.0%) 1.00 1.04 (+4.0%) 1.07 1.10 (+2.8%)
BC = Base case of model as transmitted to M.I.T.
CBC = Corrected base case of model after error correction by M.I.T. analysts. (+1 .1%) (+1.3%) 1.76 1.78 0.79 0.80 1.03 1.07 1.18 1.23 1.10 1.14 (+3.9%) 1 .85 1.86 0.83 0.83 1.09 1.11 1.27 1.33 1.15 1.18 (+.54%) (0.0%) (+1.8%) (+4.7%) (+2.6%) (+4.2%) (+3.6%)
(a high of 4 percent in CBC-1995) for all case years. There are small decreases in total coal production in both 1985 and 1990, and small increases in 1995 (see Table 3-1).
o There is a consistent average coal production price increase of between 2 and 4 percent (Table 3-2).
Rather than examine the implications of the corrections in the abstract, however, the important task for EMAP analysts was to consider the effects of these corrections on the data and projections presented in ARC-78, Volume III. The direct way to accomplish this would have been to re-run the actual ARC-78 scenarios using corrected computer code. This was not feasible for the EMAP team. However, an approximation to the effect of the corrections on ARC-78 could be calculated because the CEUM, which EMAP could run, is a somewhat generalized version of the NCM with updated data. Both the NCM and the CEUM represent a subset of the MEMM; variables endogenous to MEMM are exogenous to NCM and CEUM, the most important being the supplies and prices of fuels competing with coal. Conditional on holding these variables constant, we assume that a change in the data/structure of the CSM has an equal proportional effect upon coal production and prices, whether calculated by NCM, CEUM, or MEMM. Hence, a "first order" estimate of the effect on ARC-78 of implementing the CSM verification corrections may be obtained by examining the change in the CEUM BC/CBC results.
The analysis was performed in the following manner. In ARC-78 Volume III, Tables 9.2 and 9.3, a series of results and projections is presented giving data on coal production for the three case years of 1985, 1990 and 1995. These results are developed for the EIA Series C data (median supply curve -- median demand curve), and are supported by Supplement One
displayed by region/coal type (sulfur content) and region/mine type. M.I.T. analysts developed for each of these same categories a percentage change factor of the difference between CEUM Base Case and Corrected Base Case results. Then that percentage change factor was applied to each of the results presented in the tables in ARC-78, and a "corrected" EIA figure was calculated. This analysis is presented in Tables 3-3 through 3-8. Tables 3-3 through 3-5 display the correction effects by coal type and region, and the latter tables display the effects by mine type and region.
In the analysis of these data, the first thing to notice is that although individual percentage changes vary widely due to the
corrections, the effects tend to cancel as the regions are aggregated. For example, in Table 3-3, metallurgical coal is increased by 17% in the Northern Appalachian region; however the other coal type amounts are decreased, such that the total amount of coal for that region is changed
by only 1.01%. This "cancellation" effect is also true when the regional totals are aggregated into the national total. Again looking at Table
3-3, although the regional subtotals were changed due to the corrections by varying amounts in both directions, the National total changed by only
0.1%.
Let us look more closely at the percentage changes due to the verification corrections by sulfur categories, national totals.
National Total 1985 1990 1995
Metallurgical +6.6% +10.1% +5.6%
Low Sulfur -2.4% -1.4% +8.0%
Medium Sulfur -0.1% -1.0% -3.4%
those coal types production was overestimated in ARC-78, an effect that tended to intensify as the years progressed. For the lowest sulfur categories, the trend is not consistent; however, by 1995, in both low sulfur categories, coal production was underestimated in ARC-78. In fact, this underestimation in 1995 of low sulfur coal production more than offset the overestimation of the higher sulfur coals. To rephrase this, the error analysis indicates that if the verification corrections were made on the ARC-78 scenarios, it is likely that the results would show more low sulfur coal production by 1995 and less high sulfur coal production, although the national total for all coals would not change significantly.
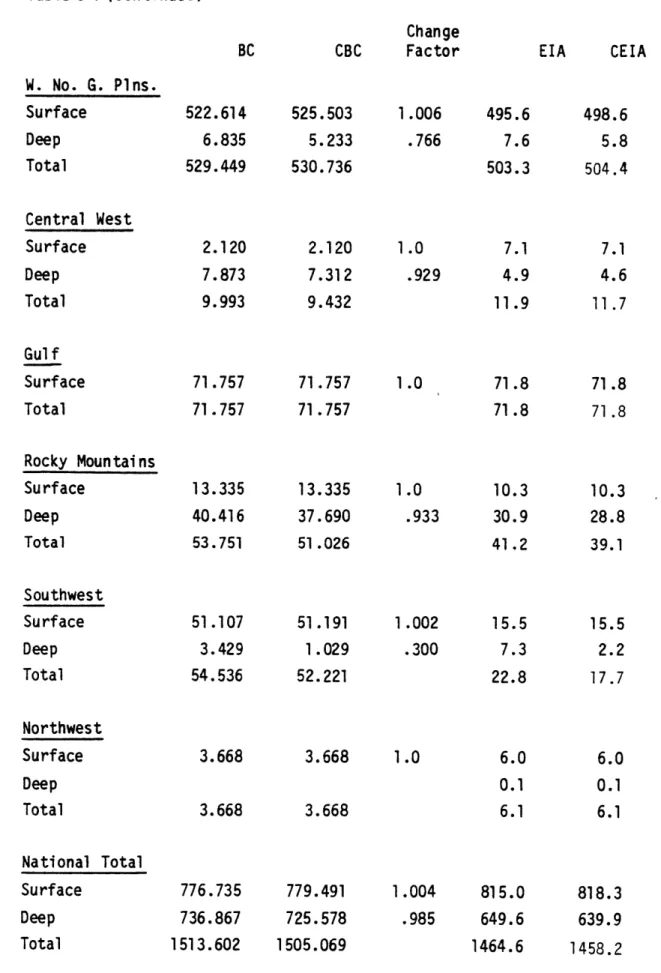
Turning to the projections concerning the production of coal by type of mine -- surface or deep -- displayed in ARC-78 Table 9.3, a similar analysis can be performed. In general the error corrections tended not to change the ARC-78 projections concerning surface-mined coal
significantly. Looking at Tables 3-6 through 3-8 it is evident that in those regions where surface production of coal was changed a few
percentage points due to error corrections, the total amounts involved tended to be small. More significant effects appear in the deep mining production numbers, for example in 1985 in Central Appalachia (+3.2%), in 1985 in the Midwest (-3.3%), in 1990 in Central Appalachia (+5.4%), in 1990 in the Midwest (-4.9%), and in 1990 in the Rocky Mountains (-6.7%). In 1995 the significant changes in deep coal production occur in Northern Appalachia (-7.2%), in Central Appalachia (+5.1%), in the Midwest (-4.4%) and in the Rocky Mountains (-5.6%). The summary table for the National totals is as follows:
Surface no change +0.4% +5.4%
Deep -0.6% -1.5% -3.8%
From this summary table it is evident that it is likely that correction of the verification errors in the EIA ARC-78 scenarios for Series C would produce higher figures for coal production from surface mines, and less coal production from deep mines.
In summary, it is evident that the verification corrections do have some effect on the results produced by model runs. Because the
analytical exercise performed above on the ARC-78 projections relies on the application of a factor to the EIA data, the "corrected" columns in Tables 3-3 through 3-8 should not be considered exact predictions of what would occur should the verification corrections actually be implemented on the ARC-78 scenarios. However, the likely direction and magnitude of such changes is suggested.
Table 3-3
1985
COAL PRODUCTION (MM TONS)
EFFECTS OF CORRECTIONS BY COAL TYPE AND REGION ON BASE CASE AND ARC-78 (EIA) DATA
(The column labeled "EIA" presents data from ARC-78 Vol. III, Supplement One, Table 17; also summarized in Vol. III, Table 9.2)
Corrected
Base Base Change "Corrected"
Case Case Factor EIA EIA
North App. Metallurgical 16.658 19.408 1.17 17.69 20.70 Low Sulfur .282 .202 .72 1.5 1.08 Med. Sulfur 84.383 84.074 .996 72.22 71.93 High Sulfur 73.904 73.504 .995 84.96 84.53 Total 175.227 177.188 176.37 178.24 Cent. App. Metallurgical 128.152 135.052 1.053 128.04 142.21 Low Sulfur 18.677 17.367 .929 33.64 31.25 Med. Sulfur 54.337 53.537 .985 70.58 69.52 High Sulfur 12.575 12.575 1.0 15.51 15.51 Total 213.741 218.531 247.76 258.49 South App. Metallurgical 4.444 4.744 1.068 4.53 4.84 Low Sulfur 4.080 3.280 .804 .96 .77 Med. Sulfur 12.031 11.951 .993 12.91 12.82 Total 20.555 19.975 18.40 18.43 Midwest Low Sulfur .720 .640 .889 .08 .07 Med. Sulfur 60.695 59.895 .987 54.99 54.28 High Sulfur 167.418 162.652 .972 167.47 162.78 Total 228.834 223.188 222.54 217.13
Table3-3 (continued)
Change
BC CBC Factor EIA CEIA
E. No. G. Pins. Low Sulfur 1.604 1.604 1.0 5.01 5.01 Med. Sulfur 21.531 21.531 1.0 22.66 22.66 High Sulfur .341 .341 1.0 Total 23.476 23.476 27.67 27.67 W. No. G. Plns. Low Sulfur 215.766 212.579 .985 145.95 143.76 Med. Sulfur 90.997 92.341 1.015 50.89 51.65 Total 306.762 304.920 196.84 195.41 Central West Metallurgical .243 .303 1.247 .23 .29 Low Sulfur .480 .400 .833 Med. Sulfur 1.375 1.647 1.198 .59 .71 High Sulfur 5.828 5.828 1.0 11.1 11.10 Total 7.927 8.178 11.92 12.10 Gul f Med. Sulfur 57.717 57.717 1.0 70.21 70.21 Total 57.717 57.717 70.21 70.21 Rocky Mountains Metallurgical 3.992 4.063 1.018 4.69 4.77 Low Sulfur 32.074 31.274 .975 24.56 23.95 Med. Sulfur 9.375 9.375 1.0 5.86 5.86 Total 45.441 44.712 35.11 34.58 Southwest Low Sulfur 18.022 17.480 .97 3.66 3.55 Med. Sulfur 16.016 16.016 1.0 16.03 16.03 Total 34.038 33.496 19.69 19.58
Table 3-3 (continued)
Change
BC CBC Factor EIA CEIA
Northwest Low Sulfur .10 .10 Med. Sulfur 3.668 3.668 1.0 6.02 6.02 Total 3.668 3.668 6.12 6.12 National Total Metallurgical 153.490 163.571 1.066 155.18 165.42 Low Sulfur 291.705 284.826 .976 215.44 210.27 Med. Sulfur 412.125 411.751 .999 382.93 382.55 High Sulfur 260.066 254.900 .980 279.03 273.45 Total 1117.384 1115.048 1032.58 1031.69
Table 3-4
1990
COAL PRODUCTION (MM TONS)
EFFECTS OF CORRECTIONS BY COAL TYPE AND REGION ON BASE CASE
AND ARC-78 (EIA) DATA
(The column labeled "EIA" presents data from ARC-78 Vol. III, Supplement One, Table 17; also summarized in Vol. III, Table 9.2)
Corrected
Base Base Change "Corrected"
Case Case Factor EIA EIA
North App. Metallurgical 21.446 27.676 1.287 19.72 25.38 Low Sulfur .441 .361 .819 1.43 1.17 Med. Sulfur 142.335 139.245 .978 116.04 113.49 High Sulfur 90.246 88.467 .980 110.29 108.08 Total 254.518 255.748 247.48 248.12 Cent. App. Metallurgical 123.308 131.929 1.070 134.43 143.84 Low Sulfur 17.916 16.395 .915 30.77 28.15 Med. Sulfur 30.724 31.764 1.034 50.59 52.31 High Sulfur 4.191 4.191 1.0 9.27 9.27 Total 176.140 184.280 225.06 233.57 South App. Metallurgical 5.121 5.841 1.141 5.45 6.22 Low Sulfur 5.120 4.560 .891 .96 .86 Med. Sulfur 4.410 4.330 .982 5.96 5.85 Total 14.651 14.731 12.37 12.93 Midwest Low Sulfur 1.040 1.040 1.0 .08 .08 Med. Sulfur 72.285 68.125 .942 60.52 57.00 High Sulfur 241.390 232.099 .962 229.86 221.13 Total 314.716 301.265 290.45 278.21
Table 3-4 (continued)
Change
BC CBC Factor EIA CEIA
E. No. G. Pins. Low Sulfur 6.140 5.922 .964 5.58 5.38 Med. Sulfur 23.945 23.945 1.0 26.60 26.60 High Sulfur .341 .341 1.0 Total 30.426 30.209 32.18 31.98 W. No. G. Pins. Low Sulfur 356.849 357.829 1.003 359.83 360.91 Med. Sulfur 172.600 172.907 1.002 143.44 143.73 Total 529.449 530.736 503.27 504.64 Central West Metallurgical .181 .253 1.398 .23 .32 Low Sulfur .880 .800 .909 Med. Sulfur 2.469 3.029 1.227 .59 .72 High Sulfur 6.463 5.350 .828 11.10 9.19 Total 9.993 9.432 11.92 10.23 Gulf Med. Sulfur 71.757 71.757 1.0 71.76 71.76 Total 71.757 71.757 71.76 71.76 Rocky Mountains Metallurgical 4.228 4.228 1.0 4.69 4.69 Low Sulfur 40.235 37.510 .932 29.75 27.73 Med. Sulfur 9.288 9.288 1.0 6.71 6.71 Total 53.751 51.026 41.15 39.13 Southwest Low Sulfur 37.670 35.355 .939 6.83 6.41 Med. Sulfur 16.866 16.866 1.0 16.03 16.03 Total 54.536 52.221 22.86 22.44
Table 3-4 (continued)
Change
BC CBC Factor EIA CEIA
Northwest Low Sulfur .10 .10 Med. Sulfur 3.668 3.668 1.0 6.02 6.02 Total 3.668 3.668 1.0 6.12 6.12 National Total Metal lurgical 154.334 169.927 1.101 164.52 181.14 Low Sulfur 466.290 459.771 .986 435.32 429.23 Med. Sulfur 550.347 544.924 .990 504.23 499.19 High Sulfur 342.631 330.448 .964 360.51 347.53 Total 1513.602 1505.069 .994 1464.58 1457.09
Table 3-5 1995
COAL PRODUCTION (MM TONS)
EFFECTS OF CORRECTIONS BY COAL TYPE AND REGION ON BASE CASE AND ARC-78 (EIA) DATA
(The column labeled "EIA presents data from ARC-78 Vol. III, Supplement One, Table 17; also summarized in Vol. III, Table 9.2)
Corrected
Base Base Change "Corrected"
Case Case Factor EIA EIA
North App. Metallurgical 28.900 29.860 1.033 25.24 26.10 Low Sulfur .560 .480 .857 1.40 1.21 Med. Sulfur 198.467 177.255 .893 149.67 133.66 High Sulfur 126.303 121.586 .963 144.02 138.70 Total 354.230 329.181 320.33 299.67 Cent. App. Metallurgical 126.865 134.891 1.063 140.35 149.19 Low Sulfur 17.910 16.360 .913 29.37 26.81 Med. Sulfur 19.280 20.160 1.046 42.95 44.93 High Sulfur 6.19 6.19 Total 164.055 171.412 218.86 227.12 South App. Metallurgical 6.060 6.060 1.0 6.36 6.36 Low Sulfur 5.520 5.120 .928 .96 .89 Med. Sulfur 1.280 .960 .75 2.45 1.84 Total 12.860 12.140 9.77 9.09 Midwest Low Sulfur 1.120 1.120 1.0 .08 .08 Med. Sulfur 78.160 76.020 .973 66.15 64.36 High Sulfur 310.499 296.801 .956 310.87 297.19 Total 389.780 373.942
Table 3-5 (continued)
Change
BC CBC Factor EIA CEIA
E. No. G. Pins. Low Sulfur 10.450 10.450 1.0 14.69 14.69 Med. Sulfur 14.624 14.624 1.0 67.01 67.01 High Sulfur 10.303 10.303 1.0 Total 35.377 35.377 81.70 81.70 W. No. G. Plns. Low Sulfur 452.035 501.899 1.11 534.20 592.96 Med. Sulfur 272.410 272.410 1.0 265.15 265.15 Total 724.446 774.309 799.35 858.11 Central West Metallurgical .360 .600 1.667 .29 .48 Low Sulfur 1.040 1.040 1.0 Med. Sulfur 4.457 5.129 1.15 .67 .77 High Sulfur 8.960 8.425 .940 15.90 14.95 Total 14.817 15.194 16.86 16.20 Gulf Med. Sulfur 61.750 61.750 1.0 71.76 71.76 Total 61.750 61.750 71.76 71.76 Rocky Mountains Metallurgical 1.820 1.820 1.0 4.69 4.69 Low Sulfur 38.580 37.250 .966 43.67 42.19 Med. Sulfur 10.291 9.491 .922 10.43 9.62 Total 50.692 48.561 58.79 56.50 Southwest Low Sulfur 49.994 49.770 .996 15.33 15.27 Med. Sulfur 2.980 2.980 1.0 16.89 16.89 Total 52.974 52.750 32.22 32.16
Table 3-5 (continued)
Change
BC CBC Factor EIA CEIA
Northwest Low Sulfur .14 .14 Med. Sulfur .950 .950 1.0 6.49 6.49 Total .950 .950 6.63 6.63 Alaska Low Sulfur 5.70 5.70 National Total Metallurgical 164.005 173.231 1.056 176.93 186.84 Low Sulfur 577.209 623.489 1.080 645.53 697.17 Med. Sulfur 664.649 641.729 .966 699.61 675.82 High Sulfur 456.065 437.115 .958 476.98 456.95 Total 1861.929 1875.564 1999.05 2016.78
Table 3-6
1985
COAL PRODUCTION (MM TONS)
EFFECTS OF CORRECTIONS BY MINE TYPE AND REGION ON BASE CASE
AND ARC-78 (EIA) DATA
(The column labeled "EIA" presents data from ARC-78 Vol. III, Supplement One, Table 16; also summarized in Vol. III Table 9.3)
Base Case North App. Surface Deep Total Cent. App. Surface Deep Total South App. Surface Deep Total Midwest Surface Deep Total E. No. G. Plns. Surface 41.971 135.257 175.227 49.541 164.200 213.741 8.393 12.162 20.555 58.724 170.110 228.834 23.476 Corrected Base Case 42.321 133.867 177.188 49.111 169.420 218.531 8.393 11.582 19.975 58.724 164.463 223.188 23.476 23.476 Change Factor 1.008 1.012 .991 1.032 1.0 .952 1.0 .967 1.0 EIA 71.9 104.5 176.4 99.9 147.9 247.8 9.9 8.5 18.4 60.3 162.2 222.5 27.7 "Corrected" EIA 72.5 105.8 178.3 99.0 152.6 251.6 9.9 8.1 18.0 60.3 156.8 217.1 27.7 Total 23.476 27.7 27.7
Table 3-6 (continued)
Change
BC CBC Factor EIA CEIA
W. No. G. Pins. Surface 303.125 304.483 1.004 192.4 193.2 Deep 3.637 .437 .12 4.4 .5 Total 306.762 304.920 196.8 193.7 Central West Surface 6.361 6.361 1.0 7.1 7.1 Deep 1.566 1.817 1.160 4.9 5.7 Total 7.927 8.178 11.9 12.8 Gulf Surface 57.717 57.717 1.0 70.2 70.2 Total 57.717 57.717 70.2 70.2 Rocky Mountains Surface 12.956 12.956 1.0 9.0 9.0 Deep 32.485 31.756 .978 26.1 25.5 Total 45.441 44.712 35.1 34.5 Southwest Surface 33.008 32.446 .984 15.5 15.3 Deep 1.029 1.029 1.0 4.2 4.2 Total 34.038 33.496 19.7 19.5 Northwest Surface 3.668 3.668 1.0 6.0 6.0 Deep 0.1 0.1 Total 3.668 3.668 6.0 6.1 National Total Surface 598.939 599.675 1.0 569.8 569.8 Deep 518.445 515.373 .994 462.8 460.1 Total 1117.384 1115.048 1032.6
Table 3-7 1990
COAL PRODUCTION (MM TONS)
EFFECTS OF CORRECTIONS BY MINE TYPE AND REGION ON BASE CASE AND ARC-78 (EIA) DATA
(The column labeled "EIA" presents data from ARC-78 Vol. III, Supplement One, Table 16; also summarized in Vol. III, Table 9.3)
Base Case North App. Surface Deep Total Cent. App. Surface Deep Total South App. Surface Deep Total Midwest Surface Deep Total E. No. G. Plns. Surface 16.272 238.246 254.518 22.936 153.204 176.140 2.797 11.854 14.651 39.703 275.012 314.716 30.426 Corrected Base Case 16.272 239.476 255.748 22.936 161.344 184.280 2.797 11.934 14.731 39.703 261.562 301.265 30.209 30.209 Change Factor 1.0 1.005 1.0 1.053 1.0 1.007 1.0 .951 .993 EIA 51.0 196.5 247.5 81.4 143.6 225.1 4.8 7.6 12.4 39.4 251.1 290.5 32.2 "Corrected" EIA 51.0 197.5 248.5 81.4 151.2 232.6 4.8 7.7 12.5 39.4 238.8 278.2 32.1 Total 30.426 32.2 32.1
Table 3-7 (continued) CBC W. No. G. Plns. Surface Deep Total Central West Surface Deep Total Gul f Surface Total Rocky Mountains Surface Deep Total Southwest Surface Deep Total Northwest Surface Deep Total 522.614 6.835 529.449 2.120 7.873 9.993 71.757 71.757 13.335 40.416 53.751 51.107 3.429 54.536 3.668 3.668 525.503 5.233 530.736 2.120 7.312 9.432 71.757 71.757 13.335 37.690 51.026 51.191 1.029 52.221 3.668 3.668 National Total Surface Deep Total 776.735 736.867 779.491 725.578 1.004 .985 815.0 649.6 818.3 639.9 1513.602 1505.069 EIA CEIA Change Factor 1.006 .766 1.0 .929 1.0 1.0 .933 1.002 .300 1.0 495.6 7.6 503.3 7.1 4.9 11.9 71.8 71.8 10.3 30.9 41.2 15.5 7.3 22.8 498.6 5.8 504.4 7.1 4.6 11.7 71.8 71.8 10.3 28.8 39.1 15.5 2.2 17.7 6.0 0.1 6.1 6.0 0.1 6.1 1464.6 1458.2
Table 3-8
1995
COAL PRODUCTION (MM TONS)
EFFECTS OF CORRECTIONS BY MINE TYPE AND REGION ON BASE CASE AND ARC-78 (EIA) DATA
(The column labeled "EIA" presents data from One, Table 16; also summarized in Vol'.
Base Case North App. Surface Deep Total Cent. App. Surface Deep Total South App. Surface Deep Total Midwest Surface Deep Total 4.530 349.700 354.230 10.200 153.855 164.055 12.860 12.860 28.500 361.280 389.780 Corrected Base Case 4.530 324.651 329.181 9.770 161.642 171.412 12.140 12.140 28.500 345.442 373.942 Change Factor 1.0 .928 .958 1.051 .944 1.0 .956
ARC-78 Vol. III, Supplement III, Table 9.3) EIA 45.3 275.1 320.3 74.1 144.8 218.9 2.3 7.5 9.8 38.3 338.8 377.1 "Corrected" EIA 45.3 255.3 300.6 71.0 152.2 223.2 2.3 7.1 9.4 38.3 323.9 362.2 E. No. G. Plns. Surface Total 35.377 35.377 35.377 35.377 1.0 81.7 81.7 81.7 81.7
Table 3-8 (continued)
Change
BC CBC Factor EIA CEIA
W. No. G. Pins. Surface 712.445 762.308 1.070 787.3 842.4 Deep 12.001 12.001 1.0 12.0 12.0 Total 724.446 774.309 799.3 854.4 Central West Surface 7.1 7.1 Deep 14.817 15.194 1.025 9.8 10.0 Total 14.817 15.194 16.9 17.1 Gul f Surface 61.750 61.750 1.0 71.8 71.8 Total 61.750 61.750 71.8 71.8 Rocky Mountains Surface 12.661 12.661 1.0 11.6 11.6 Deep 38.030 35.900 .944 47.2 44.6 Total 50.692 48.561 58.8 56.2 Southwest Surface 46.974 46.750 .955 16.4 15.7 Deep 6.000 6.000 1 .0 15.8 15.8 Total 52.974 52.750 32.2 31.5 Northwest Surface 0.950 0.950 1.0 6.5 6.5 Deep 0.1 0.1 Total 0.950 0.950 6.6 6.6 National Total Surface 913.387 962.596 1.054 1142.2 1203.9 Deep 948.542 912.968 .962 856.8 824.2 Total 1861.929 1875.564
ITS USE IN ARC-78 4.1 Data
4.1.1 Introduction
In this section we describe the data base underlying the Coal Supply Model used in ARC-78. First we summarize the exogenous variables of the model, both those used in calibrating the model's parameters and data, and those over which the model user has more direct control. We then discuss those variables which were changed between various scenarios in ARC-78. It should be noted that most of the model's variables are not explicitly documented in the ARC-78 materials. It is our understanding that the version of the data base established in ICF [1977) was the data base used for ARC-78, except where explicitly modified. The most
important change was the adjustment between the medium and high estimates of geological reserves in which resources of unknown quality are included in the high estimate, but excluded from the medium estimate.
4.1.2 Independent Variables, Data Sources, and Synthetic Data
Procedures in the Coal Supply Module of the National Coal Model The component of the National Coal Model with which we are concerned in this evaluation is the Coal Supply Module used to generate coal supply curves for the MEMM. The documentation of the procedures underlying the supply curves has been summarized above, and the model's detailed
mathematical formulation is presented in Appendix A. The data inputs are described in ICF [1977).
To summarize, the procedures used in constructing the coal supply model data base and generating the coal supply curves are as follows:
categories.
o Estimate existing 1980 production and selling price from existing mine capacity by coal type and region.
o Assign BDRB to model mine categories, and convert stocks of reserves into production flows;
o Calculate minimum acceptable selling price for each model mine type; and
o Combine potential production flows and supply prices into supply schedules by region and coal type.
(1) Supply regions and coal types
There are thirty NCM coal supply regions which, with minor
exceptions, map into the MEFS supply regions. The NCM supply regions and the NCM/MEFS mapping were presented in Table 2.1. The exceptions are a part of Tennessee in BOM District 13 which is in MEFS Southern
Appalachia, and that part of New Mexico in BOM District 17 which is in the MEFS Rockies region. The NCM documentation reports that these exceptions are minor, and that the addition of two NCM regions to deal with this problem was not justified. However, the question remains how the incompatibility is treated in aggregating NCM to MEMM regions. Are MEMM regions redefined in the aggregation so that
o MEFS Central Applachia is overstated, o MEFS Southern Appalachia is understated, o MEFS Southwest is overstated,
o MEFS Rockies is understated,
or is an adjustment made to preserve the MEFS definition; if the latter is the case, how is the adjustment made? The documentation does not address this point.
NCM regions were developed to account for the "importance of state mining laws and taxes" which require that each supply region include no more than one state. Regions (by or within state) were defined so as to have relatively homogeneous coal types (ICF [1977, p. 111-2]). However, there is no formal analysis reported as to the definition of homogeneity, and how this definition was employed in defining regions.
Coal types are defined in the NCM in terms of Btu and sulfur content. Five Btu content levels (on a wet basis) are defined in Table 4.1. Eight sulfur levels are defined in terms of pounds per MMBtu. Sulfur levels were chosen to fit into the classification scheme to meet clean air standards as follows.
o Levels 1 and 2: < .6 lbs/MMBtu -- meets the New Source Performance StanaTards (NSPS)
o Level 3: .61 -.63 lbs/MMBtu -- can be deep cleaned to meet NSPS o Level 4: .64 -.83 lbs/MMBtu -- approximately 1% sulfur which
meets requirements of some state implementation plans (SIPS) o Level 5: .84 -.92 lbs/MMBtu -- can be deep cleaned to meet 1%
sulfur level
o Level 6: .93 -1.67 lbs/MMBtu -- corresponds roughly to the 2% sulfur content level, which is also a break-point for certain SIPS
o Level 7,8: > 1.68 lbs/MMBtu -- sulfur content such as to require scrubbing.
While the NCM employs the full detail of coal types in developing coal supply curves by regional coal type, the aggregation for use in MEMM distinguishes low, medium and high sulfur content as follows: (see
ARC-78, Vol. III, p. 157)
o Low sulfur = 0-0.67 lbs/MMBtu o Medium = .67 -1.68 lbs/MMBtu o High > 1.68 lbs/MMBtu
Table 4-1
Btu Content Categories and Codes
Millions of Btu's per ton
> 26 23-25.99 20-22.99 15-1 9.99 <15 Code Z H M S L Approximate Rank of Coal Bituminous Bituminous Bituminous Sub-bituminous Lignite
Tnis classification obviously does not represent an aggregation of the more detailed WCA classification, and so there is an undocumented
adjustment that must have been made in the transition from the
aggregation of the NC4 supply curves by type to the MEFS classification.
The primary source of reserves data is the BO Public Reserves Data Tape. This tape provides tonnage by coal beds by county, plus
information on the quality of the coal, including heat and sulfur
content, for all demonstrated reserves. The total coal tonnage contained on the data tape is similar to, but not exactly the same as, that
contained in two BOM publications, "The Reserve Base of U.S. Coal by Sulfur Content 1. The Eastern States" (IC 868J) and "The Reserve Base of U.S. Coal by Sulfur Content 2. The lestern States" (IC 8693). The model documentation states that since it was not possible to judge wnich data source was more accurate, the 80M data tape was used for the model. Table 4-2 presents data from the two sources -- the tape and the publications -- for comparison.*
The comparison of these sources has shown that there are indeed some substantial differences between the tape and the publications. The first issue involves the heat content of the coal. As shown in Table 4-1 and described in the text of ICF[1977](p. 111-7) the average Btu content for each of the five heat categories was calculated for the model from the 80M tape. The tape contains dry heat content and a measure of moisture
*For the purposes of the comparison, some simple data manipulation was performed. Some of the states on the tape data were divided into two sections; where this occurred, the 1977 edition of Coal Data was used to determine which counties were within each 80t district; the totals from tne various coal categories for each individual county were then combined to derive the data for that section of the state. Consequently, it was possible to keep the data organized by PIES regions.
PIES Regions Bituminous Sub- Lignite Unknown Total Bituminous Sub-bituminous Lignite Total Total
bituminous Unknown Assigned Unknown Assigned Unknown Assigned Unknown Assigned TOTAL Northern Appalachia Pennsylvania 21271 2593 23864 2299 21581 2299 21581 23880 Ohio 17753 3319 21072 1872 19205 1872 19205 21077 Maryland 914 115 1029 35 1013 35 1013 1048 W. Virginia, north 12723 8846 21569 2749 17392 2749 17392 20141 Total 52661 14873 67534 6955 59191 6955 59191 66146 Central Appalachia: W. Virginia, south 14407 3556 17963 1862 16895 1862 16895 18757 Virgnia 2899 738 3637 245 3267 245 3267 3512 Kentucky, east 7901 5003 12904 2729 10188 2729 10188 12917 Tennessee 751 235 986 88 899 88 899 987 Total 25958 9532 35490 4925 31247 4925 31247 36172 Southern Appalachia: Alabama 1704 1278 2982 213 1742 1027 - 1240 1742 2982 Midwest: 12201* 12201* Illinois 38471 27042 65513 14256 51409 14256 51409 65665 1290* 1290* Indiana 7587 2870 10457 1504 9119 1504 9119 10623 Kentucky, west 7460 5157 12617 2816 9808 2816 9808 12624 Amended Total 16307* 16307* Total 53518 35069 88587 18576 70335 18576 70335 88911 Central West: Iowa 1044 751 1063 2858 '549 2336 549 2336 2885 Missouri 3678 5773 9451 4081 5406 4801 5406 9487 Kansas 529 843 1372 383 1005 383 1005 1388 Arkansas 430 68 498 42 495 32 - 74 495 569 Oklahoma 834 413 1247 450 844 450 844 1294 Total 6515 751 8160 15426 5506 10086 32 - 5538 10086 15624 Gui f: Texas 2828 444 3272 444 2828 444 2828 3272
*Two sets of figures were provided for Illinois anc the assumption that coal in the ground is basicall already mined. The asterisked number was amended "...personal knowledge and judgment...". (see BOM
I Indiana. The larger number is based on y equivalent in sulfur content to that
from that assumption by BOM using
IC 8680, p.8)
Table 4-2 (Continued)
A Comparison of Corresponding Data from the BOM Coal and the 1975 BOM Information Circular
Reserves Data Tape
Tape (106 tons) Publication (million short tons)
PIES Regions Bituminous Sub- Lignite Unknown Total Bituminous Sub-bituminous Lignite Total Total
bituminous Unknown Assigned Unknown Assigned Unknown Assigned Unknown Assigned TOTAL East Northern Great Plains: North Dakota 12576 3412 15988 15 15988 15 15988 16003 South Dakota 200 227 427 1 427 1 427 428 Montana, east 1530 1747 3277 702 - 1464 2111 2166 2111 4277 Total 14306 5386 19692 702 - 1480 18526 2182 18526 20708 Western Northern Great Plains: Montana, west 4511 96345 3237 104093 - 1384 - 99212 - 3523 - 104119 104119 Wyoming 9273 39717 4318 53308 22 4502 3038 45774 3060 50276 53336 Colorado, north 659 1537 2196 - 127 .606 1592 606 1719 2325 Total 13784 136721 9092 159597 22 6013 3645 146577 - 3523 3667 156113 159780 Rockies: Colorado, south 4925 7722 12647 4924 4887 1010 1538 5934 6425 12359 Utah 793 230 2982 4005 478 3564 478 3564 4042 Total 5718 230 10704 16652 5402 8451 1010 1538 6412 9989 16401 Southwest: Arizona 329 21 0 350 - 350 - 350 350 New Mexico 4368 0 4368 28 1749 - 2615 28 4364 4392 Total 4697 21 0 4718 28 1749 - 2965 28 4714 4742 Northwest: Washington 98 51 1341 1950 22 229 21 1674 2 6 45 1909 1954 Alaska: Alaska 2386 6790 9176 - 1201 - 10148 296 - 11645 11645 National Total: 164653 140160 17134 102669 425076 41649 190246 5378 162902 2985 25178 50012 378326 428338 NOTE: May not total due to rounding
content; the Btu content on a wet basis was obtained by multiplying the average dry heat content by one minus the average moisture content. No information is provided on the variance associated with the average Btu content, so we do not know how representative the average is for each heat content in each of the 30 regions.
The classification of coal on the data tape into either the
bituminous, subbituminous, or lignite categories was made on the basis of tne coal heat content. In contrast to the tape, the publications
classify coal on the basis of percent of fixed carbon and volatile matter, as well as heat content (see Table 4-3). Therefore, it is
difficult to determine whether the type of coal in each classification is consistent between the tape and the publications. Using the heat value information alone, the treatment appears inconsistent. For example, the tape places coal in the 15-15.99 MMBtu/ton range in the subbituminous class, while the publications' range for subbituminous coal is 21-23
Mdttu/ton (10,500-11,500 Btu/lb).*
A second important point to note regarding the two data sources concerns the allocation of coal of unknown sulfur content. As noted in
the model documentation and displayed in Table 4-2, the tape tends to report mucn more coal of unknown sulfur content than the publications. This difference can be easily seen by comparing the regional totals, wnere in general the tape reports about twice as mucn coal of unknown
sulfur content as the publications. State totals vary significantly as well. In est Virginia, North for example the tape shows that 41% of the *Al though the tape provides three categories of bituminous coal, the publication lists only one; therefore for the comparative purposes of
BOM Definitions of Coal Classification Anthracite Semianthracite Bituminous Subbituminous Lignite
A hard, black lustrous coal having
92 percent or more but less than 98 percent fixed carbon, and 8 percent or less but more than 2 percent volatile matter, on a dry, mineral-matter-free basis.
A coal intermediate between anthracite and bituminous coal. It is nonagglomerating and contains 86 percent or more but less than 92 percent fixed carbon, and 14 percent or less but more than 8 percent volatile matter, on a dry, mineral-matter-free basis.
A solid, brittle coal relatively high in gaseous constituents and having 69 percent or more but less than 86 percent fixed carbon, and 31 percent or less and more than 14 percent volatile matter, on a dry, mineral-matter-free basis. The calorific value ranges from
10,500 to over 14,000 Btu per pound on a moist, mineral-matter-free basis, but the calorific
value does not determine the classification provided the fixed carbon is 69 percent or more; it is commonly agglomerating. Coal of
a Btu content in the range of 10,500 to 11,500 per pound, and nonagglomerating, is classified as subbituminous.
Coal of a rank greater than lignite but less than that of bituminous coal and distinguished from lignite by its black color and its lack of a distinctly woody structure and texture, and from bituminous coal by its loss of moisture and slacking when exposed to weath-ering. Fixed carbon is less than 69 percent, and volatile matter is more than 31 percent on a dry, mineral-matter-free basis. The calorific value and nonagglomerating characteristic
determine the classification provided the fixed carbon is less than 69 percent.
A brownish-black coal in which the alteration of vegetal material has proceeded further than peat but not so far as subbituminous coal. The Btu content is less than 8,300 on a moist, mineral-matter-free basis.
total coal is of unknown sulfur content while the publications show only 13.7% in that category. Uther states with pronounced percentage
differences are Kansas, North and South Dakota, Northern Colorado, Utah, Washington, and Alaska. This difference in the amount of coal considered to be of unknown sulfur content amounts to a significant quantity at the
national level. The tape reports 102,669 x 106 tons, while the
publications report only 50,012 x 106, a difference of over 50 billion
tons of coal. Less important, on the tape the coal of unknown sulfur
content is not identified by its classification (bituminous,
subbituminous, or lignite), but is considered as an unclassified total, while in the publications coal of unknown sulfur content is identified by classification. Thus, the publication reports less unknown coal, but at
a greater level of detail.
Anotner minor disparity between the two data sources is that in many
regions the publications show a greater diversity of coal type; for
example the tape shows Alaska having only SUDDituminous reserves, while
tne publications indicate Alaskan reserves in the bituminous,
suboituminous and lignite categories. The publications also list coal in states not indicated on the tape. These states are Georgia, Michigan, North Carolina, and Oregon; this coal is mostly bituminous and amounts to
only about an additional 152 million tons (see Table 4-4).
While the details differ between the two data sources, the state and
national totals for coal are very similar. The national total in the
publications is 3,262 x 106 tons larger than that on the tape, a difference of less than one percent between the two sources. Looking just at the total coal quantities, the modelers' choice of the tape over
4-11
Table 4-4
Coal Tonnage Figures Not Included In the BOM Coal Reserves Tape
the publications does not appear to be of great consequence. However, to tne extent that the other differences between the two data sources are important to the model (particularly the coal heat content and the distribution of coal of unknown sulfur content), that choice could have an impact on model results.
Once the sulfur content was determined from the BO data tape, it was converted from percentage content to pounds per MI4Btu, using the
calculated average 8tus for the region. Further, sulfur content was adjusted under the assumption that "a standard level of cleaning" was applied to all bituminous coals. Citing the BOi RI 7633 "Sulfur Reduction Potential of Coals in the United States" (RI 7633), the
Publication (not listed on tape) (106 short tons) State Bituminous Sub-bituminous Lignite Unknown Total
Unknown Total Unknown Total Unknown Total
Georgia .17 .50 .17 .50
Michigan 7.03 118.20 7.03 118.20
North 31.62 31.62 31.62 31.62
Carolina
following reduction factors were applied. o > 2.5 lbs/MMBtu -- 35% reduction o .84 - 2.6 Ibs/MMtu -- 15% reduction o .61 - .83 lbs/MMBtu -- 5% reduction o < .6 lbs/Ml8tu -- 0% reduction
Finally, in the Central west region both bituiiinous and lignite coals were adjusted by the above sulfur reduction percentages since in that
region the subbituminous coals can in fact be beneficiated.
Thus the basis for the allocation of BOM-demonstrated reserves to NCI4 supply regions and coal types is the BOM Reserves tape classifying coal types by average Btu content, and significantly adjusting sulfur content downward under the assumption of standard cleaning. Reviewing
BOM RI 7633, it is difficult to ascertain why the particular percentage reduction factors were employed. The sulfur reduction potential reported there seems to vary substantially by region, and no effort is devoted to developing average or "standard" sulfur reduction estimates. Most
imaportantly, sulfur reduction potential appears to depend upon the yield factor chosen, that is, how much coal is lost during tne cleaning
process. In general, higher yields are associated with lower sulfur reduction potential. The particular factors chosen by ICF and employed in ARC-78 are nowhere explained in any documentation we have reviewed, and do not appear to be justified by RI 7633.
(2) Estimating 1980 mine capacity
1980 mine capacity is derived based on an estimate of 1975 production capacity by region, coal type and method of mining, to which is applied
4-13
an estiaate of mine closings between 1975 and 1980. 1975 production capacity by region, coal type, and method of mining (surface vs. deep) was estimated oy using BOM weekly production reports aggregated to NCM regions, and distributed by heat and sulfur content. The distribution was ootained by use of the FPC's fon.i 423 data for 1974 scaled to be consistent with the national estimate of utility coal shipments in 1975. Characteristics for non-utility coal shipments were based on the BO's "dituminous Coal and Lignite Shipments by Ranges of Sulfur Content Calendar 1970" classified by NCM sulfur category and region.
Classification by dtu content was assigned (no source), with coking and export shipments assigned to the Z category (dTU content > 26 million per ton) and the residential/industrial assigned to the H category (23-26 MAdtu per ton). Non-utility coal shipments were scaled up from 1970 to the national estimate in 1975. The estimated distribution by heat and sulfur content was then used to distribute the actual production in each
4CM region. If this procedure produced an estimate of production when in fact no reserves for that coal type existed within the region, a stepwise adjustment procedure was applied, in which first the sulfur level was held constant and the Btu content was allowed to increase or decrease by one category. dut if this did not resolve the problem, then a similar one-step procedure was made in sulfur content. If the problem still remained, the coal type was changed to that type requiring the fewest
"jumps" in neat and sulfur content category.
Finally, regional production was distributed by mining procedure based on tne proportion of surface-to-total reserves.