Publisher’s version / Version de l'éditeur:
Vous avez des questions? Nous pouvons vous aider. Pour communiquer directement avec un auteur, consultez la première page de la revue dans laquelle son article a été publié afin de trouver ses coordonnées. Si vous n’arrivez pas à les repérer, communiquez avec nous à [email protected].
Questions? Contact the NRC Publications Archive team at
[email protected]. If you wish to email the authors directly, please see the first page of the publication for their contact information.
https://publications-cnrc.canada.ca/fra/droits
L’accès à ce site Web et l’utilisation de son contenu sont assujettis aux conditions présentées dans le site LISEZ CES CONDITIONS ATTENTIVEMENT AVANT D’UTILISER CE SITE WEB.
Research Report (National Research Council of Canada. Institute for Research in
Construction), 2003-04-01
READ THESE TERMS AND CONDITIONS CAREFULLY BEFORE USING THIS WEBSITE.
https://nrc-publications.canada.ca/eng/copyright
NRC Publications Archive Record / Notice des Archives des publications du CNRC :
https://nrc-publications.canada.ca/eng/view/object/?id=607f7d53-f669-4218-b080-5a96b466b381 https://publications-cnrc.canada.ca/fra/voir/objet/?id=607f7d53-f669-4218-b080-5a96b466b381 For the publisher’s version, please access the DOI link below./ Pour consulter la version de l’éditeur, utilisez le lien DOI ci-dessous.
https://doi.org/10.4224/20378855
Access and use of this website and the material on it are subject to the Terms and Conditions set forth at
Structural Response Model for Wood Stud Wall Assemblies - Theory
Manual
Structural Response Model for Wood Stud Wall Assemblies –
Theory Manual
Bénichou, N.; Morgan, D.
IRC-RR-128
April 2003
http://irc.nrc-cnrc.gc.ca/ircpubsWALL ASSEMBLIES
THEORY MANUAL
Version 1.0.0
Research Report No. 128
Prepared by
Noureddine Bénichou Dave Morgan
April 2003
Fire Risk Management Program
Institute for Research in Construction National Research Council
TABLE OF CONTENTS
Page
LIST OF FIGURES ... ii
LIST OF TABLES ... iii
NOMENCLATURE ... iv
1.0 INTRODUCTION ...1
2.0 BEHAVIOUR OF WOOD-STUD WALLS UNDER FIRE EXPOSURE...2
3.0 DESCRIPTION OF THE MODEL ...3
3.1 Thermal Response Sub-model ...3
3.2 Structural Response Sub-model...3
3.2.1 Elastic buckling load calculation ...3
3.2.1.1 Stud rigidity ...4
3.2.1.2 Modulus of elasticity for each element ...4
3.2.1.3 Overall modulus of elasticity...4
3.2.1.4 Location of the centroid ...5
3.2.2 Calculation of deflection ...5
3.2.2.1 Out-of-plane deflection along the stud ...5
3.2.2.2 Maximum out-of-plane deformation...6
3.2.2.3 Eccentricity of the centroid of the resisting member (ec) ...6
3.2.2.4 Eccentricity of the Applied Load (ep) ...6
4.0 SOLUTION PROCEDURE ...7
5.0 SIMULATION EXAMPLE – COMPARISON OF MODEL PREDICTIONS WITH EXPERIMENTAL DATA ...8
6.0 REFERENCES ...10
LIST OF FIGURES
Page Figure 1. Structural Response Model Flow Chart...7 Figure 2. Fire Resistance versus Time...9 Figure 3. Maximum Deflection versus Time ...9
LIST OF TABLES
Page Table 1. Assembly Details ...8 Table 2. Comparison of Test Results and Model Predictions...8
NOMENCLATURE
Variable Description
Ai Element area (mm2)
bi Element width (mm)
Di Element length (mm)
ec Eccentricity of the centroid (mm)
ep Eccentricity of the axial load (mm)
E Modulus of elasticity of resisting member (MPa)
E0 Modulus of elasticity of the stud at ambient temperature (MPa)
Ei Element modulus of elasticity (MPa)
ET Temperature/moisture-dependent modulus of elasticity (MPa)
I Moment of inertia (mm4) k Effective length factor
kL Effective length of the stud (mm) L Actual length of the stud (mm) M0 Initial moment at ends (N·mm)
P Axial load (N)
Pcr Critical buckling load (N)
t Time (min)
T Current temperature (oC) Tc Charring temperature (oC)
Ti Element temperature (oC)
x Height on the stud (mm)
y Out-of-plane deflection along the stud (mm) yi Location of element centroid (mm)
ymax Maximum mid-height deflection (mm)
Y Location of stud centroid (mm)
1.0 INTRODUCTION
To minimize the costly consequences of fire, load-bearing wood-framed assemblies, such as other building fire barriers, are required to exhibit acceptable fire resistance to contain the fire within the compartment of fire origin. This containment will delay fire spread to other compartments, as well as provide for safe evacuation and rescue operations. The fire resistance of wood-frame assemblies can be evaluated by subjecting loaded assemblies to the standard ULC/S101-M891 tests or using calculation methods.
The National Research Council of Canada (NRC) and the Canadian wood industry have joined in a collaborative effort to develop an analytical model to predict the fire resistance of lightweight wood-frame wall assemblies exposed to standard and real fires. The model is comprised of two sub-models: a heat transfer sub-model and a structural response sub-model.
This report describes the theoretical framework of the structural response sub-model, which predicts the time to failure and deflection of structurally-loaded wood-framed wall assemblies. This report also presents a sample example of a simulation through the comparison between experimental and analytical predictions.
2.0 BEHAVIOUR OF WOOD-STUD WALLS UNDER FIRE EXPOSURE
By exposing a wood-frame wall to fire, the temperature in the gypsum board protection begins to increase first. After some time, the studs start to heat up, then they char. This causes the studs to deflect away from the fire. The deflection of the studs and the gypsum board increases gradually, leading to opening of the gypsum board joints. The gypsum board, attached to the studs, disables any lateral torsional buckling of the studs, so the wood studs deflect around its strong axis. As the opening increases, the wood studs become more exposed and the charring rate increases. For load-bearing wood walls, the heating and onset of charring of the stud create an eccentric load that can either be allowed to move or stay in place depending on the wall-end conditions (hinged vs. fixed conditions). As the cross-section area of the load-bearing studs starts diminishing (thickening of the charred area), the wall studs start experiencing excessive deflection and the load cannot be held by the studs any longer (buckling failure); this defines the structural failure of the wall. For non-load-bearing walls, assembly failure is governed mainly by excessive temperature rise on the unexposed side of the wall.
3.0 DESCRIPTION OF THE MODEL
The fire resistance of a wood-frame wall is determined by the thermal and structural performance of the wall when exposed to fires. The fire resistance model, described here, consists of two sub-models: a heat transfer sub-model that predicts the temperature profile inside the wood-stud wall and the time to insulation failure, and a structural response sub-model which calculates the degradation of the mechanical properties at elevated temperatures, cross-section reduction, the deflection of the wood studs, and the time to structural failure of the assembly. The two sub-models are physically independent, but the time-dependent temperature distribution and the extent of char as predicted by the thermal sub-model are used by the structural sub-model. Presently, the structural sub-model is based on the critical buckling-load on a single stud.
3.1 Thermal Response Sub-model
The thermal response is predicted by a heat transfer sub-model, developed by Forintek Canada Corp. The sub-model, called WALL2D, will not be explained in this report, as it has been published elsewhere.2,3
3.2 Structural Response Sub-model
The structural fire performance of wood-frame assemblies is affected by the rate of charring, degradation of the mechanical properties of the wood at elevated temperatures, and the load sustained by the assemblies.
3.2.1 Elastic buckling load calculation
To determine the structural response, a critical buckling load sub-model is implemented with WALL2D. The sub-model uses the temperature distribution predicted by WALL2D as an input, then calculates the deflection and the critical elastic buckling-load for a wood-stud wall. The buckling of the wood studs is restricted to the strong axis because of the lateral support by the gypsum board. The critical elastic buckling-load, assuming both ends of the studs are pinned, is given by:
( )
22
kL EI
Pcr =
π
(1)where Pcr is the elastic buckling-load (N), E is the modulus of elasticity of the resisting
member (MPa), I is the moment of inertia (mm4), and kL is the effective stud length (mm), with k = 1 in this case. The values of the moment of inertia and modulus of elasticity change with time. For the moment of inertia, WALL2D provides an estimation
of the remaining cross-section of the stud, thus allowing for calculation of the time-dependent moment of inertia. For the modulus of elasticity, the change with temperature is obtained from the literature.4 Structural failure is assumed to occur when the load applied on the wall exceeds the critical buckling-load.
3.2.1.1 Stud rigidity
The structural sub-model calculates the rigidity (product of the modulus of elasticity and the moment of inertia) at a particular time, for each stud in the wall and based on meshing the stud, as follows:
(
)(
)
i 2 i m i i i m i 3 i i i b D Y y E 12 D b E EI=∑
+∑
− (2)where bi is the element width (mm), Di is the element depth (mm), Y is the stud centroid
(mm), yi is the element centroid (mm), and Ei is the temperature/moisture-dependent
modulus of elasticity of the element (MPa).
3.2.1.2 Modulus of elasticity for each element
The modulus of elasticity at a particular time is given by the following equation:
− − ⋅ − ⋅ ⋅ = 20 ) 20 ( 4 . 0 1 106 0 C i T T E E (3)
where E0 is the modulus of elasticity of the stud at ambient temperature (MPa), T is the
temperature (°C) at time t, and Tc is the charring temperature (°C).
3.2.1.3 Overall modulus of elasticity
The overall modulus of elasticity of the stud at a particular time is given by:
∑
∑
= ==
1 1 i i i i i TA
A
E
E
(4)where Ai is the area of the element (mm2) and ET is the overall modulus of elasticity
(MPa).
3.2.1.4 Location of the centroid
The location of the centroid of the stud, at a particular time, is given by:
∑
∑
= ==
1 1 i i i i iA
A
y
Y
(5) 3.2.2 Calculation of deflectionThe stud’s deflection is estimated using the theory of elasticity. At ambient conditions, the applied force and the centre of resistance of the wood stud are assumed to act at the centroid of the stud’s cross-section. As temperatures start to increase, the fire-exposed side of the wood stud begins losing some of its strength and the unexposed side remains strong. This unbalance in strength results in a shift of the centre of resistance towards the cooler area, thus creating an eccentricity of the centroid, ec. Due to this
eccentricity, a moment is created. In addition, the elements reaching a temperature in the range of 280-300°C start charring, leading to a shift, ep, of the applied force from its
original position. The net eccentricity is calculated as the difference between ec and ep.
The deflection of the stud, as predicted for a hinged-hinged eccentric column, can be calculated as explained below.
3.2.2.1 Out-of-plane deflection along the stud
Considering the stud as a beam-column structure, the differential equation giving the deflection can be written as follows:
0
=
′′
+
′′′
′
P
y
y
EI
(6)The general solution is:
D
Cx
kx
B
kx
A
y
=
cos(
)
+
sin(
)
+
+
(7)Solving this equation gives the deflection at any height (x) on the stud at a particular time:
Ψ
Ψ
Ψ
−
Ψ
−
Ψ
=
)
cos(
)
cos(
2
cos
2
8
)
(
2 2 0x
L
EI
L
M
x
y
(8) with cr P P 2π
= Ψ (9) 5and
)
(
0
P
e
ce
pM
=
−
(10)where P is the applied load (N), Pcr is the critical buckling load (N), L is the length of the
stud (mm), EI is the rigidity of the stud (N·mm2), ec is the eccentricity of the centroid of
the resisting member (mm), and ep is the applied load eccentricity (mm).
3.2.2.2 Maximum out-of-plane deformation
The maximum out-of-plane deformation occurs at L/2. Substituting x = L/2 gives:
(
)
Ψ
Ψ
Ψ
−
−
=
)
cos(
)
cos(
2
8
2 2 maxEI
L
e
e
P
y
c p (11)Equation (10) can be simplified as follows:
(
)
(
cr)
p c P P EI L e e P y / 1 1 8 2 max × − − = (12)where ymax is the maximum lateral deflection (mm).
3.2.2.3 Eccentricity of the centroid of the resisting member (ec)
The eccentricity ec due to the unbalance in the strength at a particular time is calculated
by:
∑
∑
= = = 1 1 i i i i i c E E y e (13)3.2.2.4 Eccentricity of the Applied Load (ep)
The eccentricity ep of the applied load at a particular time, based on the area of
remaining elements, is calculated as follows:
∑
∑
= = = 1 1 i i i i i p A A y e (14) 64.0 SOLUTION PROCEDURE
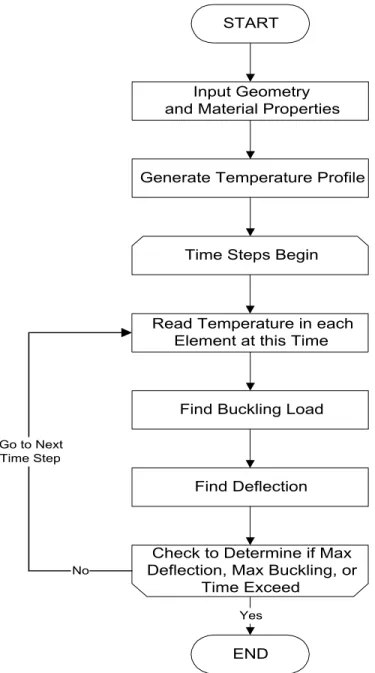
Details of the solution procedure used by the model are shown in Figure 1. The model marches through time using a user-specified time step. It first calculates the load limit for one stud, then begins the time steps. The rigidity of the stud and its centroid is calculated for each time step, as well as the buckling load and deflection. At the end of each time step, the program determines whether the maximum deflection, the maximum buckling or the time has been exceeded.
The model loops through the calculations until the end time, defined by the time-temperature input data or the failure of the stud. The output of the model is the time to failure and the out-of-plane deflection of the stud with time.
START
Input Geometry and Material Properties
Generate Temperature Profile
Find Buckling Load
Go to Next Time Step
Time Steps Begin
Find Deflection
END Yes
Check to Determine if Max Deflection, Max Buckling, or
Time Exceed No
Read Temperature in each Element at this Time
Figure 1. Structural Response Model Flow Chart
5.0 SIMULATION EXAMPLE – COMPARISON OF MODEL PREDICTIONS WITH EXPERIMENTAL DATA
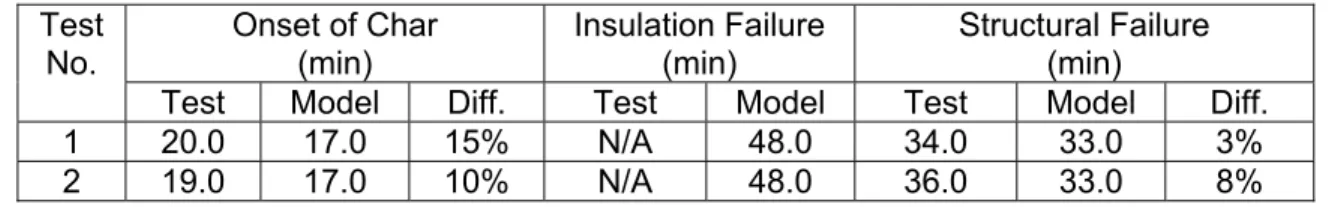
At this stage of the development, the model predictions are limited to load-bearing wood-stud walls, protected by gypsum board only. Fire resistance tests for 2 duplicate assemblies are used to evaluate the predictions by the fire resistance model. Table 1 gives details of the assemblies. The comparison figures will be shown for time to structural load failure and out-of-plane deflection for Test No. 1 only. The predictions of time-temperature curves generated by the heat transfer have been used to calculate the reduction in load carrying capacity of the studs and the degradation in the modulus of elasticity, which was assumed to be equal to 7000 MPa at ambient temperature. Temperatures on the unexposed sides did not reach the insulation failure criterion, as both assemblies failed by structural instability at 34 and 36 minutes for Tests 1 and 2, respectively. Table 2 summarises the model predictions and experimental results. The model predicts conservatively the onset of charring, with a difference of about 15% for Test 1 and 10% for Test 2.
Table 1. Assembly Details Test No. Stud Size
(mm)
Stud Spacing (mm)
Lining Thickness (mm)
Lining Type Load per Stud (kN)
1 38x89 400 12.7 Type X 8.45
2 38x89 400 12.7 Type X 8.45
Table 2. Comparison of Test Results and Model Predictions Onset of Char (min) Insulation Failure (min) Structural Failure (min) Test No.
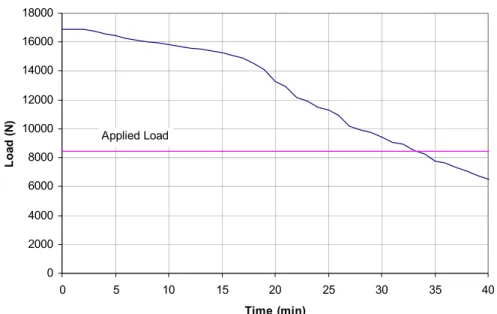
Test Model Diff. Test Model Test Model Diff. 1 20.0 17.0 15% N/A 48.0 34.0 33.0 3% 2 19.0 17.0 10% N/A 48.0 36.0 33.0 8% To measure the performance of the structural response model, the theoretical predictions of the structural fire resistance and deflection at mid-height are evaluated. Figure 2 illustrates the critical elastic buckling-load versus time as predicted by the structural response sub-model. The fire resistance decreases with increasing time because the value of the modulus of elasticity decreases with time and the cross-section of the studs reduces after charring. The intersection of the horizontal line, at the level of the applied load (8.45 kN), with the elastic buckling-curve, represents the theoretical time to structural failure of the wall. This time is 33 minutes, while the times to structural failure measured experimentally are 34 and 36 minutes for Tests 1 and 2, respectively. Therefore, the model predictions are very close to the test results, with the analytical time to structural failure slightly underestimated by 3% and 8% for Tests 1 and 2, respectively. Table 2 also shows a summary of the model predictions and experimental results for the two tests.
Fire Resistance vs Time 0 2000 4000 6000 8000 10000 12000 14000 16000 18000 0 5 10 15 20 25 30 35 40 Time (min) Lo a d ( N ) Applied Load
Figure 2. Fire Resistance versus Time
The mid-height deflections are also plotted versus time for both the analytical predictions and the test results (Figure 3). As shown in this figure, the deflection is very small in the first 30 minutes. After this, the model predictions and the test measurements start increasing at a faster rate. The rate of increase in the model predictions is similar to that of the test results. The rate in the model, however, starts a few minutes later. The model slightly overestimates the deflection at 33 min.
Maximum Deflection vs Time
-20 0 20 40 60 80 100 120 140 160 180 0 5 10 15 20 25 30 35 40 Time (min) D e fl e c ti o n (m m ) Model prediction Experimental data
Figure 3. Maximum Deflection versus Time
6.0 REFERENCES
1. CAN/ULC-S101-M89, Standard Methods of Fire Endurance Tests of Building Construction and Materials, Underwriters' Laboratories of Canada, Scarborough, Ontario, 1989.
2. Mehaffey, J.R.; Cuerrier P.; Carisse, G. “A Model for Predicting Heat Transfer Through Gypsum-Board/Wood-Stud Walls Exposed to Fire,” Fire and Materials, Vol. 18, 1994, pp. 297-305.
3. Takeda, H.; Mehaffey, J.R. “WALL2D: A Model for Predicting Heat Transfer through Wood-Stud Walls Exposed to Fire,” Fire and Materials, Vol. 22, 1998, pp. 133-140. 4. Bénichou, N.; Takeda, H.; Sultan, M.A.; Mehaffey, J.R. "Modeling the fire resistance
of loadbearing wood-stud wall assemblies," 4th International Scientific Conference on Wood and Fire Safety, Svolen, Slovakia, pp. 33-43, May 2000.