Publisher’s version / Version de l'éditeur:
Noise Control Engineering Journal, 44, 2, pp. 79-91, 1996-04-01
READ THESE TERMS AND CONDITIONS CAREFULLY BEFORE USING THIS WEBSITE. https://nrc-publications.canada.ca/eng/copyright
Vous avez des questions? Nous pouvons vous aider. Pour communiquer directement avec un auteur, consultez la
première page de la revue dans laquelle son article a été publié afin de trouver ses coordonnées. Si vous n’arrivez pas à les repérer, communiquez avec nous à PublicationsArchive-ArchivesPublications@nrc-cnrc.gc.ca.
Questions? Contact the NRC Publications Archive team at
PublicationsArchive-ArchivesPublications@nrc-cnrc.gc.ca. If you wish to email the authors directly, please see the first page of the publication for their contact information.
NRC Publications Archive
Archives des publications du CNRC
This publication could be one of several versions: author’s original, accepted manuscript or the publisher’s version. / La version de cette publication peut être l’une des suivantes : la version prépublication de l’auteur, la version acceptée du manuscrit ou la version de l’éditeur.
Access and use of this website and the material on it are subject to the Terms and Conditions set forth at
Digital frequency-weighting filters for evaluation of human exposure to
building vibration
Hunaidi, O.; Guan, W.
https://publications-cnrc.canada.ca/fra/droits
L’accès à ce site Web et l’utilisation de son contenu sont assujettis aux conditions présentées dans le site LISEZ CES CONDITIONS ATTENTIVEMENT AVANT D’UTILISER CE SITE WEB.
NRC Publications Record / Notice d'Archives des publications de CNRC:
https://nrc-publications.canada.ca/eng/view/object/?id=cf257c8f-a7bc-4dcb-9d67-d5762efbf9bd https://publications-cnrc.canada.ca/fra/voir/objet/?id=cf257c8f-a7bc-4dcb-9d67-d5762efbf9bdhttp://www.nrc-cnrc.gc.ca/irc
Digit a l fre que nc y-w e ight ing filt e rs for e va lua t ion of hum a n e x posure
t o building vibra t ion
N R C C - 3 8 9 6 8
H u n a i d i , O . ; G u a n , W .
A p r i l 1 9 9 6
A version of this document is published in / Une version de ce document se trouve dans:
Noise Control Engineering Journal, 44, (2), pp. 79-91, April 01, 1996
The material in this document is covered by the provisions of the Copyright Act, by Canadian laws, policies, regulations and international agreements. Such provisions serve to identify the information source and, in specific instances, to prohibit reproduction of materials without written permission. For more information visit http://laws.justice.gc.ca/en/showtdm/cs/C-42
Les renseignements dans ce document sont protégés par la Loi sur le droit d'auteur, par les lois, les politiques et les règlements du Canada et des accords internationaux. Ces dispositions permettent d'identifier la source de l'information et, dans certains cas, d'interdire la copie de documents sans permission écrite. Pour obtenir de plus amples renseignements : http://lois.justice.gc.ca/fr/showtdm/cs/C-42
Digital frequency-weighting filters for evaluation of human exposure to
building vibration
M. Osama AI-Hunaidi and Wei Guans)
(Received 1995 March 09; revised 1995 December 26; accepted 1996 January 18)
According to some International and National Standards, frequency weighting is the preferred method for evaluation of buman exposure to broadband vibration in buildings. The weighting functions are defined b)' prot,Qtype filters that may be implemented in analog or digital form. For this paper, frequency-weighting functions specified bytheISO 8041 and BS 6841 Standards were simulated in software as time-domain digital IDters. Simulation procedures, software implementation, and verification of tolerance requirements are presented. The digital filters implemented here conformed closely to specifications in the Standards.AFORTRAN subroutine is provided for calculating the coefficients of the digital filters.
Primary subject classification: 49.1; Secondary subject classification: 49.3
1. INTRODUCTION
Building vibration induced by road and rail traffic, ma-chinery. and construction activities can reach magnitudes that may be annoying to building occupants. The Interna-tional Organization for Standardization (ISO) and several countries have published Standards that provide guidance on evaluation of human response to vibration in buildings, e.g., International Standard ISO 2631-2,1 British Standard BS 6472,2 and American National Standard ANSI S3.29.3 Criteria for human exposure to vibration are defined in those Standards in terms of root-meao-square (nus) accel-eration and velocity in one-third-octave bands with mid-band frequencies in the range from I to 80Hz.
According to the above Standards, broadband vibration signals (i.e .• vibrations with spectra covering more than one one-third-octave band) may be evaluated using (l) the rat-ing method or (2) the frequency-weightrat-ing method. In the rating method. a measurement of one-third-octave-band vi-bration is evaluated with respect to a criterion vivi-bration at each one-third-octave band in the specified frequency range, This evaluation can be perfonued by means of one-third-octave-band filters or by one-third-octave-band digital-filtering software.4
For the frequency-weighting method. measured vibra-tion signals are frequency-weighted according to the equal-human-response curves specified in the Standards. Frequency-weighted vibration signals are then evaluated with respect to a criterion in the frequency range where humans are most sensitive to vibration, i.e.. at the lowest vibration criterion for the equal-hum an-response curves specified in the Standards. Because of research evidence suggesting that there are summation effects for vibrations at different frequencies,Ifrequency weighting is the preferred
method in ISO 2631-2 and BS 6472. There is no clear preference given in ANSI S3.29 for an evaluation method. Frequency weighting is achieved by passing vibration signals through filters that conform to a specified frequency response. The filters may be realized in anal.og or digital
ollnstilute for Research ill Construction, National Research Council. of CamuJa, Ouawa. Olltario KJAOR6,Canada.
form. Frequency weightings are provided in ISO 2631-2, BS 6472. and ANSI 53.29 as curves composed of straight lines with slopes of - 3,0, and +6 dB per octave. The lines are "asymptotic approximations" to the mathematical equations of the frequency キ・ゥァィエゥョセウ specified in ISO 80415and British Standard BS 6841. The full equations are normally preferred over the asymptotic approximations for design of frequency-weighting filters.6
For this paper, prototype analog frequency-weighting filters specified in ISO 8041 and BS 6841 were simulated by software in the fonn of time-domain digital filters. SimUlation of filters by software is economical and reliable as it eliminates a piece of hardware that could be subject to various environmental effects and the need for periodic calibration. The weighting functions simulated in this paper included those specified in ISO 8041 forX-,y-, and z-axis whole-body mechanical vibration. The weightings Wb and Wd specified in BS 6841 for evaluation of the effect of whole-body vibration with respect to human perception and discomfort were also implemented. The frequency weight-ings are applicable to measurements of acceleration. 2. FREQUENCY·WEIGHTING FILTERS
In ISO 8041 and BS 6841, frequency-weighting func-tions are defined as analog filters in the form of a Laplace transfonu. The number afpoles, resonance frequencies, and transfer functions are all specified by definitions. The speci-fied filters consist of two parts: (a) a frequency-band-limiting filter, and (b) a frequency-weighting filter. The transfer functions of these filters H(s) , where s is the Laplace operator, are given in the Standards as described in the next sections.
The design-goal frequency weightings described below are nondimensional quantities as given in ISO 8041 and BS 6841. However, the tolerances around the design goals are specified in decibels. Tolerances are discussed in Sec. 5. A. ISO 8041
The
band-limiting filter forX-.y-,and z-axis whole-bodyvibration is defined in ISO 8041 by the following expres-sion:
(5)
(4)
(27T/. 100"s)'
h「ャHsIセ (I)
[S'+
fi
27T/,IO-o's+(2 7T1i IO- o·,),)[s'+fi
27T/. 100"s+(2 7T/, 10°')')'The frequency-weighting filter for z-axis whole-body vibration is defined from
r 0.42 + 0.045s
hLwHウIセ
I+
0.044s+(0.03s)2' (2)and the frequency-weighting filter forx- and y-axis whole-body vibration is defined from
rw I
+
0.08sH (s)- (3)
xy - I + 0.125s+(0.08s)2·
In Eq. (I),II andI, are!helower and upper limiting frequencies, respectively. These frequencies are specified, in hertz, by the following fonnulas for the exact one-third-octave midband frequencies:II セ 100' IN, andI. セ 100' IN, , whereNIand
N. are integer numbers equal to 0 and 19, respectively.
B. BS 6841
The band-limiting filter for both frequency weightings Wb and Wd is defined in BS 6841 from 47T'I's'
h「ャHsIセ ,
(s'+ (27T/,/Q,)s+ 47T'I;>(s'+ (27T/,IQ,)s+ 47T'I;)'
The frequency-weighting Wbfor z-axis whole-body vibration is defined from
r (s+ 27Th)(s'+(27T/5IQ3)s+ 47T'I;) 2WtkiGjセ
H w(s ) - -;-...,--,--;:;---;-c:::-::-C-:-:--,=':":""=;:::--::-;-;:-C-=:-:-:--,,,,
b - (s'+ (27TJ./Q,)S+ TWtGOセIHウGK (27T/6IQ.)s+ TWtGOセIG
hi;
and the frequency-weighting Wdfor x- and y-axis whole-body vibration is defined from
mance of activities, rather than to discomfort and
percep-tion.
(6)
whereQi andbi are constant coefficients, andMandNare the number of zeros and poles, respectively.
The equivalent expression forEg. (7) in the time domain
3. CONVERSION OF FILTERS
To simulate analog filters by software, they have to be first converted into digital filters. In filter design, the trans-fer function of a digital filter is usually represented in the fonn of a z transformH(z)while the transfer function of an analog filter is represented in the form of a Laplace
trans-fonnH(s). The relationship between the input and output of
a digital filter, in the
z
domain, is given by(8) (7) (9) yHコIセhHコIxHコIL M N ケHエゥIセ
L
b,x(ti_,)-L
Qjy(ti-j). k==O j=lwhereX(z) and Y(z) are the ztransforms of the input and output signals, respectively, andH(z) is the z transform of the filter response.
Transfer functionH(z) can be expressed in the form of a rational function of two polynomials in liz as
M セ b;Z-i ;=0 hHコIセ ' N '
-l+Lajz-i
;""1 is rw s+
27Th 2WtkOセ Hd HウIセ , , 2 --,--:...:. s+
(27T/.IQ,)s+ 47T I. 13In Eqs. (4) and (5),lu (n セ I to6) designates a reso-nance frequency (or cutoff frequency) of the filter, Qu(n セ
I to 4) designates a filter selectivity, and K represents a gain or amplification. For a specific frequency weighting, coefficients
I"
Qu' andKare all constants.ForHb' inEg. (4)./, セ 0.4Hz./, セ 100Hz, andQ, セ
0.71.
Forhセキ inEg.(5),13 セ 16 Hz'/. セ 16 Hz./
s
セ 2.5 Hz, 16 = 4 Hz, Q, セ 0.55,Q3セ 0.90, qNセPNYUL and Kセ 0.4. ForH';
inEg.(6)'/3 セ 2Hz,l.セ 2Hz,Q,
セ 0.63, andK = I.
Frequency weightings Wband Wdspecified in BS 6841 differ from those specified in ISO 8041. The ISO weighting for x- and y-axis vibration and the BS weighting Wd are almost identical except that the fonner extenM to I Hz whereas the latter extends to 0.5 Hz. For z-axis vibration, the frequency range that bas maximum sensitivity extends from about5to 16 Hz inthe BS weightingWbinstead of4
to 8 Hz as in the ISO weighting. For frequencies greater than 16 Hz, the BS weighting indicates greater sensitivity to acceleration (about two times greater) than the ISO weighting. Frequency weighting Wgprovided in BS 6841 for zCaxis vibration (not considered here) is consistent with the z-axis weighting provided in ISO 8041. However, BS 6841 recommends the use of theWgweighting for evalua-tion of human exposure to vibraevalua-tion with respect to
perfor-(12)
whereyi is the frequency-weighted acceleration of the ith data sample in the segment and N is the number of data
points in the segment. After all data segments have been processed, the greatest rrns acceleration of all time seg-ments is determined and then output to the screen of the .monitor or to a file. The averaging process represented by Eq. (13) is linear, i.e., all data points have an equal inftu-to discard a small part at the beginning of filtered signals before a valid result was obtained. The lower the predomi-nant frequency in the vibration signal, the longer the effect of the rise time of the filter. For the filters implemented in this paper, the rise time was about I s at 0.8 Hz.
For situations in which the number of samples of the vibration signal is too great to fit into available computer memory, the signal can be separated into as many time segments as necessary. Thus, there is no limitation on the duration of the input signal. However, a "save-and-add" scheme has to be applied in order to maintain correct initial conditions prior to the processing of each segment of the signal. That is, the lastN points of the unfiltered segment
and the lastM
+
I points of the weighted segment are saved and then added (i.e., appended) to the beginning of the next segment. This procedure ensures that distortions caused by the rise time of filters are restricted only to the initial part of the signal, rather than to each segment.Computer code for a FORTRAN77 subroutine for gen-erating the coefficients of filters specified by the ISO and BS Standards is provided in the Appendix. The subroutine was incorporated into the program TOAP" that is an inter-active PC program for perfonning one-third-octave-band analyses of multi-channel vibration measurements. In the TOAP program, the user provides the following informa-tion: format of data files, numbers of channels to be ana-lyzed, type of analysis (i.e., one-third-octave, frequency-weighted, or both), and the type of frequency weighting if specified. In addition, there are four other parameters speci-fied by the USer that dictate the manner in which the signals are processed. The first one is the segment length or inte-gration time which is converted by the program to number of data points. The other three parameters are processing start time, number of time integration windows, and the number of initial time integration windows to be discarded. Other information such as sampling frequency, gains, and sensitivities of the instruments and recording equipment are read directly from header files created by the data-acquisition system. The TOAP program could access data files of signals acquired by several versions of cononer-cially available software.
Data are processed one channel at a time for the speci-fied number of integration time windows in a loop-like fashion. The first integration time window begins at the starting sample specified by the user. Each subsequent time window is read from the raw data starting at the time when the previous window ends.
After the filtering process is completed at the end of
each segment, root-mean-square accelerationsYrms are
cal-culated from wherex(ti ) and y(t,) are input and output signals,
respec-tively, at timeti •The design of a digital filter involves the detemlination of coefficientsai andbi ,and the numbersM
and N from the given analog filter. Different techniques
・セゥウエ for converting an analog filter transfer function H(s) into a digital filter transfer H(z). Both the bilinear
transfor-mation method' with frequency pre-wrapping, and the im-pulse invarialll method' were used for this paper.
The frequency band-limiting filters defined by Eqs. (J) and (4) are 4-pole Butterworth bandpass filters that repre-sent the combination ofセ 2-pole Butterworth lowpass filter and a 2-pole Butterworth highpass filter. The bilinear trans-formation method with frequency pre-wrapping, which is the most frequently used method for converting filters with constant gain in the passband, was employed for converting these filters. In this method, the
z
transform is obtained from the Laplace transform by applying the mapping (i.e., change of variables) indicated by27ff, z-I
s;tan(7ff,T) z+I' (10)
where
f,
is the cutoff frequency of the filter and T is thesampling interval in the time domain.
The frequency weighting filters defined by Eqs. (2), (3), and (6) have 2 poles, and the one by Eq. (5) has 4 poles. Because of the complicated properties in their frequency responses, these filters were converted into digital filters by the impulse invariant method. For this method, the Laplace transform of the filter is first expanded in the form
N K.
H(s);L - ' , (II)
i=! s+Sj
where
K
i is a constant, Si is the ith pole, andN
is thenumber of poles. The digital filters are then found from
N
セ K·z
H(z);
セ
z-e'-""
where H(z) is the transfer function of the filter in the z domain, and T is the sampling interval in the time domain.
4. IMPLEMENTATION IN SOFlWARE
Formulas for calculating the coefficients
a,
andbiof the time-domain digital filters were deducedbyrearranging the transfer functions (in thez
domain) in a form similar to that of Eq. (8), i.e., a rational function of two polynomials inlIz. The resulting coefficients of the polynomials, and
con-sequently the formulas for calculating the coefficients 0i
and bi,are functions of the sampling interval T. The cum-bersome task of rearranging transfer functions and deduc-ing the formulas of filter coefficients was performed by means of the symbolic calculation software Maple V.'
Given the sampling interval T of a vibration signal, filter
coefficients were calculated from the deduced formulas. Measured accelerations were then frequency weighted by applying Eq. (9), first passing the vibration signal through the band-limiting filter and then passing the resulting signal through the frequency-weighting filter. Because of the rise time in the response of the filters, it was usually necessary
[ (
I)N
]112
Yrms=
N
ゥセ
y; .
(13)10
ISO 8041 (z-axis weighting)
digital filter
en
::J:5
"0o
E
1
0.1
0.1
1
frequency (Hz)
10
100
Fig. J - Digital filter response and z-axis acceleration frequency weighting as defined in ISO 8041 .. 500-Hz sampling frequenc)'.
ence on the result. This procedure is appropriate for con-tinuous signals. For transient signals, however, exponential-time-weighted averaging is normally used to capture the effect of the transient features, in particular the signal's maximum value.
5. TOLERANCE VERIFICATION
Tolerances specified in ISO 8041 for frequency weight-ings of whole-body vibration in Ihex,y,or z directions are as follows:' 0 dB at 8 Hz, ±I dB for the frequency range from 1.25to 63 Hz, ±2 dB for frequency ranges from 0.5
10
to I Hz and from 80 to 160 Hz, and +2 to -00 dB
else-where.
In BS 6841, tolerances are specified6as follows: Within
the nominal frequency bands and one-third of an octave in from the frequency limits, the tolerance of the combined frequency weighting and band limiting should be less than
± 1 dB. Outside this range the tolerance should be less
than ± 2 dB. One octave outside the nominal frequency
bands the attenuation may extendto infinity.
For frequency weightings Wband Wdfor which nominal frequency bands are from 0.5 to 80 Hz and the correspond-ing lower and upper nominal frequency limits are 0.4 and
ISO 8041 (x,y-axes weighting)
digital filter
セ
:5
"0o
E
1
0.1
0.1
1
frequency (Hz)
10
100
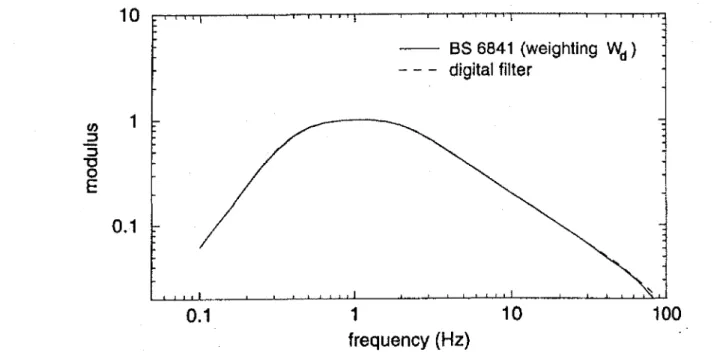
10
as
6841 (weighting W
b )digital filter
1
0.1
MMMMMセ0.1
1
frequency
(Hz)
10
100
Fig. 3 - Digital filter response alld acceleration frequency weighting Wbas defined in BS 6841 .. 500·Hz sampling frequency.
100 Hz, the above requirements were interpreted as fol-lows: For the frequency range from 0.4 to 100 Hz, the tolerance around the design·goal frequency weightings is
±1 dB; from 0.25 to 0.4 Hz and from 100 to 160 Hz the tolerance is ± 2 dB; and elsewhere in the frequency range the tolerance is +2 to - 0 0dB.
The tolerances described above are relative to the design-goal frequency weightings given in Sec. 2. A toler-ance of
±
2 dB, for example, was taken to mean that the calculated frequency weighting had to be within 10+2120and 10-2120of the theoretical design goal for the specified frequency range.
Rather than using Eq. (8) to detennine the response of digital filters to verify the above tolerances. pure tone sig-nals of unit amplitude were passed through the filters (one signal at a time). Pure tone signals were at the nominal midband frequencies of one-third-octave bands in the range from 0.1 Hz to the Nyquist frequency. The responses of digital filters obtained in this manner are compared with those specified by the ISO and British Standards in Figs.
1-4 for a sampling frequency of 500 Hz (I.e., a sampling time interval T of 2 ms and a Nyquist frequency of 250 Hz). The responses of the digital filters were in excellent agreement with those of the prototype analog filters.
10
1
0.1
as
6841 (weighting W
d)digital filter
0.1
1
frequency
(Hz)
10
100
Fig. 4 - Digital filter response and acceleration. frequency weightjn.g Wdas defined in BS 6841 .. 500·Hz sampling frequency.
Fig, 5 - Tolerances Qnd deviation of digital filter response from z-axis accelerationjrequency weighting as defined in ISO 8041.
-1000
1000
A セ :;!\j \
I I 'I 1100
100
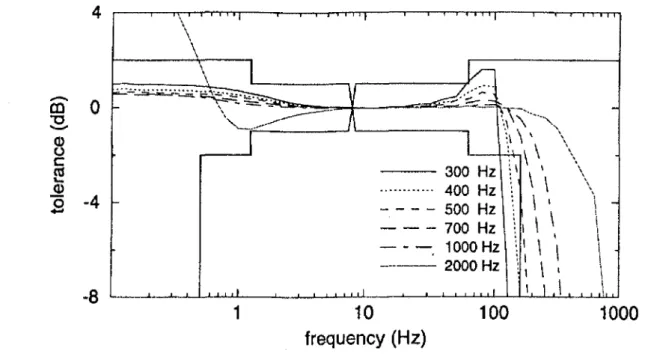
6. DISCUSSIONTheoretically, the greater the sampling rate, the smaller the error between a digital filter and its analog prototype. However, care mustbe taken in practice when the sampling rate is very high. More accurate results do not necessarily follow with greater sampling rates. The deviation of the responses of the digital filters implemented for this paper from those of their prototype analog counterparts is shown in Figs.
5-8
for various sampling rates. From these figures,I ,I I I
10
frequency (Hz)
10
frequency (Hz)
I
Vi /
\
j ' - - - . , - - - , I/....:;: I
\\.
!
j セZセNNNNMZZセI \ 1\0'\
'I!
I
\\ \\
セ
- - - 300 Hz \ \ 400 Hz \ \ 500 Hz \ I 700 Hz I \ \ I 1000Hz セ \ \ - - - 2000Hz I \ t I I \ I I1
1 I1
\,
\
\
\4
\\
I
Vi
1:":":7:::-:-:-:-:=---:"'___ L.--._ _- - - - ,r - - - r セ...=
N[cBセZGZセZセZGZセZセNMN.d-;:
セo
i- \ - '="'-セセ]]M MKMMMセセMセMMNM]NセB|MLNMM..
BGMiMセ
I
"\
セ
\ "\
, - - - - ' '---r;:+, \ \ \ 300 Hz \ \ \ \ ... -. 400 Hz \ \ \, - - - - 500 Hz \ \ -- - - 700 Hz I \ \ \ I ' - - - 1000Hz II \ \ \ --- 2000 Hz 1 \ I 1 \ , 1 \ \4
4
--8
o
=--4
-8
-m
'"C -(Q "'C-
Q) (,) C セ Q) (5 +-"To examine the effect of the sampling interval, tests were also performed with sampling frequencies ranging from 300 to 2000 Hz. Results of these tests are shownin
Figs. 5-8in terms of the deviation of the responses of the digital filters from those of the prototype filters. All digital filters realized for this paper closely satisfied the tolerances specified ISO 8041 and BS 6841. except for the 2000-Hz sampling frequency. Also, there were some minor devia-tions in the case of BS 6841 frequency weighting Wb as noted in the next section.
-CO
セ Q)o
c
f!
Q)..9
4
-4
I--8
f 1\/
\
I \ II
f I !/
i II
/
/
1 I1
I I10
frequency (Hz)
I ,I100
-1000
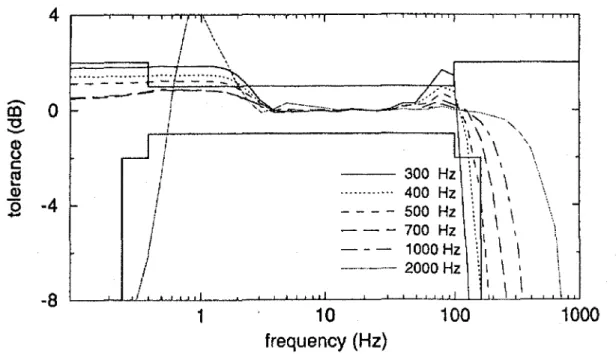
Fig. 7 - Tolerances and deviation of digital filter response from acceleration frequency weighting Wbas defined in BS 6841.
it canbeseen that results obtained with a sampling rate of 2000 Hz were not as good as the results obtained at lower sampling rates. The effect of the sampling rale is believed to be caused by an accumulated numerical error resulting from the finite length of binary words in the computer.
Calculations reported in this paper were perfonned in double-precision floating-point arithmetic using an IBM-compatible personal computer with an Intel 486DX micro-processor and the Microsoft FORTRAN compiler version 5.1. Further tests showed that the sampling frequency effect appeared, for the case of the filters implemented here, when the sampling rate was greater than 1200 Hz. The response of the filters, however, stayed within the tolerances for
sampling rales up to 1500 Hz. The above numerical error is hardly a limitation for the digital filters implemented here as a sampling rate of 1000 Hz is most likely the greatest rate to be used in practice. If vibration signals are acquired at sampling rates greater than 1000 Hz, accuracy can be improved by decimating the digital signals, e.g., by halving the sampling rate. Before decimation, however, the signals must be digitally lowpass filtered to prevent frequency aliasing.
Some difficulty was encountered in meeting the low-frequency tolerances for low-frequency weighting Wb of BS 6841 for sampling rates equal to or less !.han 600 Hz. The errors at frequencies less !.han 1.6 Hz for a sampling rate of
-1000
\I
! \,
i i \{ij
-\.
1
j \ !\ I
100
I 'I ! ! ; I10
frequency (Hz)
1
Ir-"
,"
! \
iI i " .
;-i/\
!
GMMセOMMML[[BBMMLLMMMM⦅M MMセMMMMMセMMN⦅M\LLLLᄋᄋ\LLLLLᄋ[ᄋOLセZウゥ\)
I
セ セセ!
l\\\\
J -;.\ \ ; 300Hz:\\\ ! 400 Hz \ If
- - - -
500 Hz \I
-
-
-
700 Hz I \ II
- - -
1000Hz II \ \I
----.-. 2000 Hz I \ '\ I . 1 \I
I , I ,4
-8
-en
"0-
g
セ Q)"0
-Fig. 8 - Tolerances and deviation of digital filter response from acceleration frequency weighting Wdas defined in BS 6841.
600 Hz were slightly larger than I dB. This error made the filter exceed the :t I dB tolerances in the frequency range from 0.4 to 1.6 Hz. If predominant frequencies of vibration fall in this range, the tolerances of BS 6841 in this range could be fulfilled, if necessary, by applying a factor of 0.905 to the filter response. This factor decreases the
posi-tive errors at low frequencies and shifts the errors in the
middle frequency range to negative. If the above adjust-ment was applied, the response of the digital filter up to 80 Hz satisfied the tolerances even for sampling frequencies as low as 300 Hz. Deviation from the specified tolerances for frequencies greater than 80 Hz was considered to be incon-sequential as significant vibrations at these frequencies are unlikely to be encountered in buildings.
Finally, when the Qr selectivity of 0.71 in Eq. (I) was used as specified in BS 6841 for the band-limiting filter, it was not possible to obtain the exact values of the frequency weigbtings as they were listed in the British Standard. The frequency weightings were obtained, however, when a
value of 0.707 was used for Q,. This suggested that it would have been better if additional significant digits had been provided in BS 6841 to specify the selectivities,
reso-nance frequencies. and constant gains.
7. CONCLUSIONS
Prototype frequency-weighting functions specified by the ISO 8041 and BS 6841 Standards for evaluation of the
annoyance response to building vibrations were success·
fully simulated as time-domain digital filters. The digital filters satisfied the tolerances specified in the International and British Standards with minor exceptions. Situations in which the tolerances were exceeded occurred when the sampling frequency was greater than 1500 Hz or when the sampling frequency was less than 600 Hz in the case of the
Wbweighting of BS 6841. Simple remedies were suggested to ensure that the digital filters satisfy the specified
toler-ances for those situations.
8. APPENDIX
Disclaimer of Warranty
The National Research Council of Canada and the Institute of Noise Control Engineering make no warranties, expressed or implied, that this computer code is free of error, or is consistent with the ISO 8041:1990 and BS 6841:1987 Standards or any other Standard, or that it will meet the user's requirements for any application. The user should not rely on this computer code for solving problems for which incorrect solutions could result in injury to a person or loss of property. If the user does use this computer code in such a manner, it is at his or her own risk. The National Research Council of Canada, the authors of this paper, and the Institute of Noise Control Engineering disclaim all liability for direct or consequential damages resulting from the use of this computer code.
. . . .
....
. . ...
,.
... .. ..
. ...
,...
,.
. ..
.....
...
,. ...
. . .....
. . ...
. . ..
...
. . . ...
. . . ..
. ....
. ..
. . .c The following FORTRAN computer code was written by Wei Guan. Subroutine HUMANCOEF(iwtype,fs,ibpfw,coefa,coefb,m,n)
c Generates the coefficients of time-domain digital filters (Eq. 9) for band-limiting and frequency-weighting of acceleration signals as per ISO 8041: 1990 and BS 6841:1987.
c input parameters:
c iwtype = weighting type
c = 2 (weighting Wh, BS 6841)
c = 4 (weighting Wd, BS 6841)
c = 11 (weighting for x- and y-axis vibration, ISO 8041)
c = 12 (weighting for z-axis vibration, ISO 8041)
c fs = sampling frequency in hertz
c ibpfw = filter type (band-limiting or frequency-weighting)
c = I (band-limiting filter) c = 2 (frequency-weighting filter) c c output parameters: c m = number of zeros c n = number of poles
c coefa = array containingQ; coefficients (i = I to n) c coefb =
array
containing b; coefficients (i = 0 to m)c
c , .
integer*2 iwtype, ibpfw, n, m real*4 coefa(I:4), coefb(0:4) real*4 fs real*8 PI parameter (PI=3.1415926) real*8 u l,u2,u3,u4,u5,u6,u7,u8,u9,ulO,ull,uI2, aO real*8 vl,v2,v3,ve91,veI3,veI82,ve26 real*8 wl,w2,w3,w4,w5,w6,w7,w8,w9,wlO,wll,wI2,wI3,w14,wI5,w 16 real*8 w14I3,w76,w21,w22,w23,w24
real*8 gOdB. ago g8HzA, g8HzD c if (ibpfw.eq. I) then c c c
c
+
+
+
+
+
+
+
+
+
+
+
+
+
c
c c+
+
+
+
+
+
+
+
if (iwtype.eq.2.0r.iwtype.eq.4) then . . . ..
. ...
. ..
. . ..
,. ....
....
,. ....
. . . ....
. . . ..
. . .....
,..
. . ..
. ...
.
..
. .,....
.....
..
Coefficients of band-limiting filter of BS 6841.&j. (4)
. .
.. ...
...
....
..
. ....
. . ....
,..
,..
. . . ..
..
. . ...
..
,.
,....
....
. .,...
,...
....
.
.
..
n=
4 m=4 vi=
tan(lOO*PUfs) ul = tan(IOO*PUfs) u2 = tan(O.4*PUfs) aO=
0.4946781854*(u2*u1) +0.3512215116*(u1 + u2 + u2*u1*ul + u2*u2*ul) + 0.2493672732*(u2*u2 + u1 *ul + u2*u2*ul *ul + I) coefb(O)
=
0.2493672732 * vI * v I / aOcoefb(l) = 0.0
coefb(2)
=
-0.4987345464 * vI * vi /.0 coefb(3) = 0.0coefb(4)
=
0.2493672732 * vI * vi / aOcoefa(l)
=
(0.00Ie-7*(u2*u2) - 0.002e-7*(u1*ul) + 0.9974690931*(u2*u2*uI *ul - I)+0.7024430232*(u2*ul*ul - u2 - ul + u2*u2*u1» / aO
coefa(2)
=
(-0.4987345464*(u2*u2 + ul*ul) + 1.496203640*(u2*u2*u1*u1+1)-0.9893563708*(u2*ul)) / aO
coefa(3)
=
(0.00Ie-7*(u2*u2) - 0.002e-7*(ul*ul) + 0.9974690931 *(u2*u2*ul*u1 -1)-0.7024430232*(u2*ul*u1 - u2 - ul + u2*u2*ul) / aO
coefa(4) =
(0.4946781854*(u2*ul)-0.3512215116*(u1+u2 + u2*ul*u1 + u2*u2*ul) + 0.2493672732*(u2*u2 + u1*u1 +
u2*u2*ul *u 1+ I» / aO else if (iwtype.eq.1 J.or.iwtype.eq.12) then
...
,.
Coefficients of band-limiting filter of ISO 8031,&j. (I)
...
".
n=
4 m=4 vi=
tan(IOO.O*PUfs) u1=
tan(2.49536704474637/fs) u2 = tan(IOO.O*PUfs)aO = 0.983305794766386*(u2*u2 + u1*u1*u2*u2 + u1*u1 + I) + 1.390604390918679*(u1*u1*u2 + u1*u2*u2 + u1 + u2) + 1.96661 1589532773*(u 1*u2) coefb(O) = 0.983305794766386 * vi * vI/ aO coefb(l)
=
0.0 coefb(2) = -1.966611589532773 * vi * v1/aO coefb(3)=
0.0 coefb(4)=
0.983305794766386 * vi * vI / aO coefa(l) = (2.781208781837358*(u1+u2)*(-I+ul*u2) + 3.933223179065546*(-1 + (u 1*u2)*(u1 *u2))) / aO coefa(2) = (-1.966611589532773*(u2*u2 + ul*ul) +5.899834768598319*(u2*u2*u1 *u1 + I) -3.933223 I79065546*(u2*uI) / aO
coefa(3)
=
(2.781208781837358*(ul+u2)*(I-u1*u2) + . 3.933223179065546*(-1 +(u1*u2)*(u1*u2») / aOcoefa(4)'= ( 1.96661158953277*u1 *u2 + 0.983305794766386*
(I' + u2*u2 + ul*ul*u2*u2 +
1.390604390918679*
(uI*ul*u2
+
ul*ul*u2+
ul+
u2»/aO elsewrite(*. '(an 'wrong code for weighting type l'
end if
else if (ibpfw.eq.2) then if (iwtype.eq.2) then
+
+
c .
c Coefficients of frequency-weighting filter Wbof BS 6841, Eq. (5)
c
,
,
.
n = 4 ill = 3 wi=
sinh(I3.22775854/fs) w2 =: cos(2I.37009794/fs) w3 "" sin(56.67646735/fs) w4=
cosh(l3.22775854/fs) w5=
cos(56.67646735/fs) w6=
-2.0*w5*w3+
2.0*w3*w2*w4 - 2.0*w3*w2*wl w7=
w5*w5 - w3*w3 - 2.0*w5*w2*w4+
2.0*w5*w2*wl+
+
cosh(26.45551708/fs) - sinh(26.45551708/fs) w8=
sin(21.37009794/fs) w9 = O.l0268I2916e9*(w5+
w2*wI " w2*w4)+
+
0.2165387003e9*(w8*w4 - w8*wl) w10=
sinh(91.39178632/fs) wll = cos{41.88097775/fs) w12=
cosh(91.39178632/fs) w13=
-2.0*w5*w3+
2.0*w3*wll *w12 - 2.0*w3*wl1 *wlO w14=
w5*w5 - w3*w3 - 2.0*w5*wll*wI2+
2.0*w5*wll *wlO+
+
cosh(182.7835726/fs) - sinh(l82.7835726/fs) w15 = sin(41.88097775/fs) wl6=
O.2966362766elO*(-w5+
wll*w12 - wl1*wlO)+
+
O.601l516l8e9*(w 15*wlO - wI5*w12)wl413 = w14*w14
+
w13*w13 w76=
w7*w7+
w6*w6 w21=
O.3722926540e-7 w22 ::;: O.7296167000e-7 w23 :::: 0.2966362760010 w24 ::: 0.102681291009 gOdB =: sqrt(+
(
-w21*w5*(wI6*wI4/wI413+
w23*w3*wI3/w1413)+
-w21*w3*{-wI6*wI3/wI413+
w23*w3*w14/w14(3)+
-w22*w5*(w9*w7/w76 - w24*w3*w6/w76)+
-w22*w3*(-w9*w6/w76 - w24*w3*w7/w76»**2+
+
(
-w21 *w5*(-wI6*wI3/wI413+
w23*w3*wI4/wI413) + +w21*w3*(wI6*w14/wI413+
w23*w3*wI3/w1413)+
-w22*w5*(-w9*w6/w76 - w24*w3*w7/w76)+
-w22*w3*(w9*w7/w76 -w24*w3*w6/w76»**2) vI = cos(41.88097775/fs} v2 = cos(21.37009794/fs) ve91 ::;: exp(-91.39178632/fs) vel3 :::: exp(-B.22775854/fs} ve182 :::: exp(-I82.7835726/fs) ve26=
exp(-26.45551708/fs)coefa(l)
=
-2.0*vl *ve91 - 2.0*v2*veI3coefa(2) :; ve182
+
(-2.0*vl *ve9l)*(-2.0*v2*ve13)+
ve26 coefa(3)=
ve182*
(-2.0*v2*veI3) - 2.0*vl*ve9I*
ve26 coefa(4) :::: ve182 * ve26ul ::;: sinh(182.7835726/fs) u2 ::::: sinh(I3.22775854/fs) u3 :::: sin(21.37009794/fs) u4 :::: cosh(13.22775854/fs) u5 :::: cos(21.37009794/fs} c
u6
=
sinh(26.45551708/fs) u7=
cosh(9I.39178632/fs) u8= cos(41.88097775/fs) u9= cosh(26.45551708/fs) ulO=
cosh(J82.7835726/fs) ull = sin(41.88097775/fs) ul2=
sinh(91.39178632/fs) coetb(O)=
102.9437082coetb(1)
=
-15.79902519*u3*u4 +15.79902519*u3*u2-+ 213.3792149*u5*u4 - 22.38043313*ull*uI2-+ 95.45190967*u8*u7 + 22.38043313*ull*u7 + + 213.3792149*u5*u2 + 95.45190967*u8*uI2 coetb(2) = 44.76086626*ull*uI2*u5*u4 -+ 44.76086626*ull*uI2*u5*u2 -+ 110.4355067*u6 - 31.59805039*u3*u4*u8*uI2 + + 7.491798513*ul - 44.76086626*ull*u7*u5*u4 + + 31.59805039*u3*u4*u8*u7 + 110.4355067*u9-+ 31.59805039*u3*u2*u8*u7 . + 205.8874164*u8*uI2*u5*(u4-u2) + + 44.76086626*ull*u7*u5*u2 - 7.491798513*u1O + + 31.59805039*u3*u2*u8*uI2 + + 205.8874164*u8*u7*u5*(u4-u2) coetb(3) = 7.491798513*u5*u4*(u1O-ul) + + 110.4355067*u8*uI2*(u9u6) -+ 22.38043313*ull*uI2*(u9-u6) + + 22.38043313*u II *u7*(u9u6) -+ 7.491798513*u5*u2*(uI0-ul)-+ 15.79902519*u3*u4*(u1O-ul) + + 15.79902519*u3*u2*(uI0-u1)-+ 11O.4355067*u8*u7*(u9-u6)
coetb(O) = coetb(O)
1
gOdB coetb( I) = coetb(J) 1 gOdB coetb(2) = coetb(2)1 gOdBcoetb(3) = coetb(3) 1 gOdB else if (iwtype.eq.4) then
c , , .
c Coefficients of frequency-weighting filter Wdof BS 6841, Eq. (6)
c
..
n = 2 m= I vI = exp(-9.9733100ll/fs) v2 = cos(7.645047930/fs) v3 = sio(7.645047930/fs) uI = exp(-19.94662002/fs) aO= 1.0 wI = sio(8.710531638/fs) w2 = cos(8.710531638/fs) w3 = cos(7.645047930/fs) w4=
exp(-9.9733100ll/fs) w5 = -2.0*wl*w4*w3 + 2.0*w2*wl w6 = -2.0*w2*w4*w3 + w2*w2 - 1.0*wl*wl + + exp(-19.94662002/fs) w7=
sio(7.645047930/fs) w8=
w6*w6 + w5*w5 w9 = 20.0*(-0.628318531*w4*w3 + 0.628318531*w2+ + 0.213114168*w7*w4) gOdB = sqrt( (w9*(w2*w6+wl*w5)/w8 -+ 12.56637062*w I *(-w2*w5+wl *w6)/w8)**2 + + (w9*(-w2*w5+wl*w6)/w8 + + 12.56637062*wl *(w2*w6+wl*w5)/w8)**2) ag=
aO * gOdB coetb(O) = 12.566370621 ag coetb(J) = (-12.56637062*vl*v2 + 4.262283360*v3*vl)1 ag"iU1P"Wn S'i
c
c c+
+
+
+
+
+
+
+
+
+
c coefa(I)=
-2.0*vl*v2 1 aO coefa(2)=
uI 1 aOelse if (iwtype.eq.1 I) then
Coeff. ofxandy-axis frequency-weighting filter, ISO 8041, Eq. (3) n = 2 m=1 aO
=
1.0 wI=
49.9073408949275Ifs w2=
7.802728263843041fs w3 = exp(-9.765625Ifs) w4=
-2.0*sin(wl)*w3*cos(w2)+
2.0*cos(wl)*sin(wl) w5=
-2.0*cos(wl)*w3*cos(w2)+
2.0*cos(wl)*cos(wl) - 1.0+
exp(-19.53125/fs) w6=
-125.0*w3*cos(w2)+
125.0*cos(w I)+
43.8047902531539*sin(w2)*w3 g8HzD=
0.1 * sqrt( «cos(wl)*w6 - 125.0*sin(wl)*sin(wI))*w5+
(sin(wl)*w6+
125.0*cos(wl)*sin(w1))*w4)**2+
( (sin(wI)*w6+
125.0*cos(wI)*sin'(wl»*w5 -(cos(wl)*w6 - 125.0*sin(wI)*sin(wl»)*w4)**2) g8HzD=
g8HzD1
(w5*w5+
w4*W4) g8HzA=
0.254212224196366 ag=
(g8HzA 1 g8HzD) 1 aO coefb(O) = ag * 12.5 coefb(I)=
ag * (-12.5*exp(-9.765625Ifs)* cos(7.80272826384304Ifs)+
4.38047902531539*exp(-9.765625Ifs)* sin(7.80272826384304Ifs» coefa(J) = -2.0 * exp(-9.765625Ifs)* cos(7.80272826384304Ifs) 1 aO coefa(2) = exp(-19.53 I251fs) 1 aOelse if (iwtype.eq.12) then
c .
c Coeff. of z-axis frequency-weighting filter, ISO 8041, Eq. (2)
c
.
n=
2 m=
I aO=
1.0 wI=
49.90734089492751fs w2=
exp(-24.4444444444444Ifs) w3=
22.66230894930131fs w4 = -2.0*sin(wl)*w2*cos(w3)+
2.0*cos(wl)*sin(wl) w5 = -2.0*cos(wl)*w2*cos(w3)+
2.0*cos(wl)*cos(wI) - 1.0+
+
exp(-48.8888888888889Ifs) w6=
-250.0*w2*cos(w3)+
250.0*cos(wl)+
-
166.698714867456*sin(w3)*w2 g8HzD=
0.2 * sqrt(+
(
(cos(wl)*w6 - 250.0*sin(wI)*sin(wl))*w5+
+
(sin(wI)*w6+
250.0*cos(w1)*sin(wl))*w4)**2+
+
(
(sin(wI)*w6+
250.0*cos(wl)*sin(wl))*w5-+
(
cos(wI)*w6 - 250.0*sin(wI)*sin(wI))*w4)**2) g8HzD=
g8HzD 1 (w5*w5+
w4*W4) g8HzA = 0.905633362802681 ag=
(g8HzA1g8HzD) 1 aO coefb(O)=
ag * 50.0 coefb(l)=
ag * (-33.3397429734913*+
exp(-24.4444444444444Ifs)*+
sin(22,6623089493013Ifs)-+
50.0 * exp(-24.4444444444444Ifs)*+
cos(22.6623089493013/fs))+
c c coefa(l) = -2.0 * exp(-24.4444444444444/fs)* cos(22.6623089493013/fs) 1 aO coefa(2) = exp(-48.8888888888889/fs) 1 aO elsewrite(*,'(a)') 'wrong code for weighting type' end if end if return end ;.ZUkl
9. REFERENCES
IEvaluation of human exposure to }I'hole-body vibration. Part2.' COrl-tinuous vibration and shock-induced vibrationillbuildings(Jto 80 Hz).
International Standard ISO 2631-2:1989 (International Organization for Standardization, Geneva, Switzerland. 1989).
2Evaluation of human exposure to vibration in buildings(1 to 80 Hz),
British Standard BS 6472:1984 (British Standards Institution, London, 1984).
JoGuide to the evaluation of hunum exposure to vibration in buildings,
American National Standards Institute ANSI 53.29:1983 (Acoustical Society of America, New York. 1983).
4M.O. AI·Hunaidi, M. Hofmeister, and R.E. Halliwell, "A Program for 1/3 octave analysis of traffic vibrations using digital filtering on PCs,"
Proc. INTER·NOISE 92, edited by Gilles A. Daigle and Michael R.
NoiseControlEng.J. 44(2), 1996Mar-Apr
Stinson (Noise Control Foundation, Poughkeepsie, New York, 1992), Vol. 2, pp.1153-1156.
SHurtUln response to vibration-Measuring instrumentation,Internalional Standard ISO.8041:1990 (International Organization for Standardiza-tion, Geneva, Switzerland, 1990).
6Measurement and ・セG。ャオ。ャゥッョ of hllman exposure 10 whole·body
me-chanical vibration and repealed shock, British Standard BS6841:1987 (British Standards Institution, London, 1987).
'T.W. Parks and e.S. Burrus,Digital Filter Design(Wiley, New York, 1987).
8B.W. Char. K.O. Geddes, G.H. Gonnet, B.L. Leong, M.B. Monagan, and S.M. Watt, Maple V - Lnnguage Reference Manual (Springer-Verlag, New York,1991).