Publisher’s version / Version de l'éditeur:
Vous avez des questions? Nous pouvons vous aider. Pour communiquer directement avec un auteur, consultez la
première page de la revue dans laquelle son article a été publié afin de trouver ses coordonnées. Si vous n’arrivez pas à les repérer, communiquez avec nous à PublicationsArchive-ArchivesPublications@nrc-cnrc.gc.ca.
Questions? Contact the NRC Publications Archive team at
PublicationsArchive-ArchivesPublications@nrc-cnrc.gc.ca. If you wish to email the authors directly, please see the first page of the publication for their contact information.
https://publications-cnrc.canada.ca/fra/droits
L’accès à ce site Web et l’utilisation de son contenu sont assujettis aux conditions présentées dans le site LISEZ CES CONDITIONS ATTENTIVEMENT AVANT D’UTILISER CE SITE WEB.
Technical Report (National Research Council of Canada. Institute for Ocean Technology); no. TR-2005-09, 2005
READ THESE TERMS AND CONDITIONS CAREFULLY BEFORE USING THIS WEBSITE. https://nrc-publications.canada.ca/eng/copyright
NRC Publications Archive Record / Notice des Archives des publications du CNRC : https://nrc-publications.canada.ca/eng/view/object/?id=0b037db2-cd5b-4e1f-b7cc-14e1ed74b72d https://publications-cnrc.canada.ca/fra/voir/objet/?id=0b037db2-cd5b-4e1f-b7cc-14e1ed74b72d
NRC Publications Archive
Archives des publications du CNRC
For the publisher’s version, please access the DOI link below./ Pour consulter la version de l’éditeur, utilisez le lien DOI ci-dessous.
https://doi.org/10.4224/8895573
Access and use of this website and the material on it are subject to the Terms and Conditions set forth at
Description of seakeeping trial carried out on CCGA Roberts Sisters ll: November 2004
REPORT NUMBER
TR-2005-09
NRC REPORT NUMBER DATE
July 2005
REPORT SECURITY CLASSIFICATION
Unclassified
DISTRIBUTION
Unlimited
TITLE
DESCRIPTION OF SEAKEEPING TRIAL CARRIED OUT ON CCGA ROBERTS SISTERS II – NOVEMBER 2004
AUTHOR(S)
D. Cumming, T. Fleming
CORPORATE AUTHOR(S)/PERFORMING AGENCY(S)
Institute for Ocean Technology (IOT), Memorial University of Newfoundland (MUN)
PUBLICATION
N/A
SPONSORING AGENCY(S)
Institute for Ocean Technology (IOT), Memorial University of Newfoundland (MUN), Oceanic Consulting Corp. (OCC), Canadian Coast Guard (CCG), the Offshore Safety and Survival Centre (OSSC), Marine Institute, SafetyNet, Search & Rescue (SAR), New Initiatives Fund (NIF) and the Canadian Institutes of Health and Research (CIHR)
IOT PROJECT NUMBER
42_2017_26
NRC FILE NUMBER KEY WORDS
Seakeeping, Motion Induced Interrupts, Fishing Vessel
PAGES vii, 23 App. A-J FIGS. 25 TABLES 4 SUMMARY
This report describes seakeeping experiments carried out on the 65 ft. (19.81 m) long fishing vessel CCGA Roberts Sisters II off St. John’s, NL November 15, 2004 as part of the Fishing Vessel Safety Project (Proj. 2017). The objective of the project is to acquire quality full-scale motions data on fishing vessels to validate physical model methodology as well as numerical simulation models under
development. Eventually, tools will be developed and validated to evaluate the number of Motion Induced Interrupts (MIIs), induced by sudden ship motions, and their impact on crew accidents to develop criteria to reduce MIIs.
Collaborators involved in the fishing vessel sea trials include the Institute for Ocean Technology (IOT), Memorial University of Newfoundland (MUN), Oceanic Consulting Corp. (OCC), Canadian Coast Guard (CCG), the Offshore Safety and Survival Centre (OSSC) of the Marine Institute and SafetyNet – a Community Research Alliance on Health and Safety in Marine and Coastal Work. Primary financial support for the project is provided from federal funding sources including the Search & Rescue (SAR), New Initiatives Fund (NIF) and the Canadian Institutes of Health and Research (CIHR) in addition to significant in-kind contributions from the many participants.
This document describes the CCGA Roberts Sisters II, the trials instrumentation package, data acquisition system, test program, data analysis procedure and presents the results.
ADDRESS National Research Council
Institute for Ocean Technology Arctic Avenue, P. O. Box 12093 St. John's, NL A1B 3T5
National Research Council Conseil national de recherches
Canada Canada
Institute for Ocean Institut des technologies
Technology océaniques
DESCRIPTION OF SEAKEEPING TRIAL CARRIED OUT ON CCGA ROBERTS SISTERS II – NOVEMBER 2004
TR-2005-09
D. Cumming, T. Fleming
List of Tables ... iv
List of Figures ... iv
List of Abbreviations... v
1.0 INTRODUCTION...1
2.0 BACKGROUND ...1
3.0 DESCRIPTION OF THE CCGA ROBERTS SISTERS II...3
4.0 DESCRIPTION OF INSTRUMENTATION ...4
4.1 Data Acquisition System (DAS) ...4
4.2 Rudder Angle Measurement...5
4.3 Ship’s Motion Instrumentation ...5
4.4 Differential Global Positioning System Data ...7
4.5 Directional Wave Buoy/Mooring Arrangement...8
4.6 Propeller Shaft Speed...10
4.7 Directional Anemometer ...10
4.8 Sea Water Temperature/Density Measurement ...10
4.9 Electrical Power ...11
4.10 Signal Cabling ...11
5.0 TRIALS DESCRIPTION ...12
6.0 DESCRIPTION OF ONLINE DATA ANALYSIS ...13
7.0 DESCRIPTION OF OFFLINE DATA ANALYSIS...14
7.1 Wave Data Analysis ...14
7.1.1 Datawell Wave Buoy Data Analysis...14
7.1.2 Neptune Wave Buoy Data Analysis...15
7.2 Interpreting the Raw Data...16
7.3 Validation of MotionPak Software and Instrumentation ...17
7.4 Ship Motion Analysis ...18
7.5 Roll and Pitch Frequency Analysis ...19
8.0 DISCUSSION & RECOMMENDATIONS ...19
9.0 ACKNOWLEDGEMENTS ...21
10.0 REFERENCES...22 APPENDIX A: Inclining Experiment Report
APPENDIX B: Principle Particulars, List Of Outfit Items APPENDIX C: Instrumentation Plan
APPENDIX D: Calibration Information
APPENDIX E: Neptune Wave Buoy Specifications and Typical Output File APPENDIX F: Datawell Wave Buoy and Mooring Description, Typical Raw
Output Files
APPENDIX G: Seakeeping Trials Test Plan APPENDIX H: Seakeeping Trials Run Log
APPENDIX I: Wave Statistics, Spectrum and Frequency Plots
APPENDIX J: Tables of Basic Information and Statistics for Each Trial Run
LIST OF TABLES
TABLE
MotionPak Validation ... 1
Standard Deviations of Motions (No Anti-Roll Tank) ... 2
Standard Deviations of Motions (With Anti-Roll Tank) ... 3
Datawell/Neptune Directional Wave Data Comparison... 4
LIST OF FIGURES FIGURE Photographs of CCGA Roberts Sisters II... 1
Photograph of CCGA Roberts Sisters II – Propeller, Nozzle & Rudder Arrangement ...2
Photograph of Data Acquisition System... 3
Photograph of Rudder Angle Measurement... 4
Photographs of MotionPak Installation in Fish Hold... 5
Photograph of Orthogonal Linear Accelerometers in Bridge Console... 6
Photograph of GPS Antenna ... 7
Photograph of Neptune Directional Wave Buoy... 8
Photographs of Datawell Directional Wave Buoy and Anchor ... 9
Photograph of Shaft RPM Measurement ... 10
Photograph of Directional Anemometer ... 11
Photograph of Hand Held Salinometer ... 12
Example Online Data Analysis... 13
Offline Data Analysis – Example Time Series Plots...14 - 19 MotionPak/Linear Accelerometer Comparison Plots...20 - 22 Plot of St. Dev. Roll, Pitch & Heave vs. Heading Angle – 4 knots... 23
Plot of St. Dev. Roll, Pitch & Heave vs. Heading Angle – 8 knots... 24
Photograph of Anti-Roll Tank Level Indicator... 25
Accel. Acceleration ART Anti-Roll Tank AP aft perpendicular BOK bottom of keel
ºC degrees Centigrade CAD Computer Aided Design CCG Canadian Coast Guard
CCGA Canadian Coast Guard Auxiliary CCGS Canadian Coast Guard Ship CG Centre of Gravity
CIHR Canadian Institutes of Health and Research cm centimetre(s)
COG Course Over Ground DAS Data Acquisition System DC Direct Current
deg. degree(s)
DGPS Differential Global Positioning System DOT Department of Transport
EPIRB Emergency Position Indicating Radiobeacon FFT Fast Fourier Transform
FP forward perpendicular ft foot, feet
Fwd. forward
F/V frequency/voltage g acceleration due to gravity gal. gallon(s)
GEDAP General Data Analysis Program GMT Transverse Metacentric Height
LIST OF ABBREVIATIONS (CONT’D)
GPS Global Positioning System HS, H1/3,Hm0 Significant Wave Height HF High Frequency h, hr hour(s)
Hz Hertz
in inch(es)
IOT Institute for Ocean Technology
kg kilogram(s)
kHz kiloHertz km kilometre(s)
KMT transverse metacentric height above keel KML longitudinal metacentric height above datum kt(s) knot(s)
kW kiloWatt(s) l litre(s) lb(s) pound(s)
LCG Longitudinal Centre of Gravity LT, L. ton(s) long ton(s)
m metre(s) mag. magnetic
MHz megaHertz
MII(s) Motion Induced Interrupt(s)
MUN Memorial University of Newfoundland MV Motor Vessel
mW milliWatt(s)
NIF New Initiatives Fund nm nautical mile(s)
NMEA National Marine Electronics Association NRC National Research Council
NSERC Natural Sciences and Engineering Research Council of Canada OCC Oceanic Consulting Corporation
OEB Offshore Engineering Basin
OSSC Offshore Safety and Survival Centre PPT Parts Per Thousand
RF Radio Frequency
RPM Revolutions Per Minute s, sec. second(s)
SAR Search And Rescue
SNAME Society of Naval Architects and Marine Engineers SOG Speed Over Ground
Stbd. starboard
St. Dev. standard deviation SWH significant wave height t tonne(s)
Tav, Tavg average period Tmax maximum period TZ zero crossing period UHF Ultra High Frequency
UNESCO United Nations Educational, Scientific and Cultural Organization UPS Uninterruptible Power Supply
V, VAC volt(s)
VCG Vertical Centre of Gravity VHF very high frequency
DESCRIPTION OF SEAKEEPING TRIAL CARRIED OUT ON CCGA ROBERTS SISTERS II – NOVEMBER 2004
1.0 INTRODUCTION
This report describes seakeeping experiments carried out on the 65 ft. (19.81 m) long fishing vessel CCGA Roberts Sisters II off St. John’s, NL November 15, 2004 as part of the Fishing Vessel Safety Project (Proj. 2017). The objective of the project is to acquire quality full-scale motions data on fishing vessels to validate physical model methodology as well as numerical simulation models under development. Eventually, tools will be developed and validated to
evaluate the number of Motion Induced Interrupts (MIIs), induced by sudden ship motions, and their impact on crew accidents to develop criteria to reduce MIIs. Although the priority was to collect seakeeping data, a manoeuvring test program was also available in the event that calm seas prevailed.
Collaborators involved in the fishing vessel sea trials include the Institute for Ocean Technology (IOT), Memorial University of Newfoundland (MUN), Oceanic Consulting Corp. (OCC), Canadian Coast Guard (CCG), the Offshore Safety and Survival Centre (OSSC) of the Marine Institute and SafetyNet – a Community Research Alliance on Health and Safety in Marine and Coastal Work. Primary financial support for the project is provided from federal funding sources including the Search & Rescue (SAR), New Initiatives Fund (NIF) and the Canadian
Institutes of Health and Research (CIHR) in addition to significant in-kind contributions from the many participants.
This document describes the CCGA Roberts Sisters II, the trials instrumentation package, data acquisition system, test program, data analysis procedure and presents the results. Other Fishing Vessel Research Project related seakeeping trials carried out are described in References 1 to 4.
2.0 BACKGROUND
The Fishing Vessel Safety Project is just a small component of the overall SafetyNet initiative to understand and mitigate the health and safety risks associated with employment in a marine environment. SafetyNet is the first federally funded research program investigating occupational health and safety in historically high risk Atlantic Canada marine, coastal and offshore industries. The Fishing Vessel Safety Project is conducting research on the occupational health and safety of seafood harvesters. Fishing is the most dangerous
occupation in Newfoundland and Labrador and is increasingly so: over the past ten years, the rates of reported injuries and fatalities nearly doubled. These trends have the effect of reducing the sustainability of the fishery, increasing health care and compensation costs, and straining the available SAR resources. The development of effective solutions, to prevent or mitigate injury, fatality or
and safety.
The Fishing Vessel Safety Project is a multi-disciplinary, inter-departmental and inter-sectorial research project. The broad-based and multi-factorial approach in investigating the inter-related factors that influence fishing safety including: fishery policy and vessel regulations, vessel safety design and modeling, human relationships on vessels and health and safety program development,
implementation and evaluation. The Fishing Vessel Safety project is composed of six integrated components:
1) Longitudinal Analysis: A statistical analysis of all fishing injuries, fatalities and SAR incidents from 1989 to 2000 to determine trends and influencing factors of seafood harvester occupational health and safety;
2) Perceptions of Risk: An interview-based study, conducted with seafood harvesters, on the perceptions of causes of accidents and near-misses - and the effectiveness of existing accident prevention programs;
3) Motion Induced Interruptions: Sea trials, physical and numerical modeling of the effects of MIIs, sudden vessel motions induced by wave action, on crew accidents and development of criteria to reduce MIIs;
4) Delayed Return to Work: an interview-based study on the psychological and social factors that delay previously injured seafood harvesters from returning to work;
5) Education Program: The development of an interactive, community-based occupational safety education program for seafood harvesters; and
6) Comparative Analysis: A comparative analysis of accident and fatality rates, and regulatory regimes for fisheries management and fishing vessel safety in Canada, the United States, Iceland, Norway, Denmark, France and Australia.
Several of the project components will yield results that can be directly used by stakeholder organizations for designing and implementing injury and fatality prevention programs. The applied nature of the overall project will be
represented by a series of recommendations that will provide accessible and applicable information needed to make informed decisions. Additional
information on SafetyNet may be found by visiting their web site (Reference 5). The effort described in this report is part of Component #3 of the overall Fishing Vessel Research Project. The plan involved carrying out seakeeping trials on a total of five Newfoundland based fishing vessels ranging in lengths from 35 ft. to 75 ft. (10.67 m to 22.86 m) over two years. Data was acquired on some of the vessels with and without roll damping devices deployed. Standard seakeeping parameters such as ship motions, speed and heading angle was recorded along with data on the ambient environmental conditions (wave height/direction, wind speed/direction). Physical models of three of the vessels (tentatively the 35, and
the two 65 ft. vessels) suitable for free-running operation in the IOT Offshore Engineering Basin (OEB) will be fabricated and tested by IOT over three years in environmental conditions emulating the full scale conditions. Project participants at the MUN Faculty of Engineering will derive numerical models of all five hull forms and run simulations using their non-linear time domain ship motion prediction codes. Validated simulation tools will then be used to predict the expected level of MIIs for different fishing vessel designs.
Additional information on human factors in ship design is provided in References 6 to 9.
3.0 DESCRIPTION OF THE CCGA ROBERTS SISTERS II
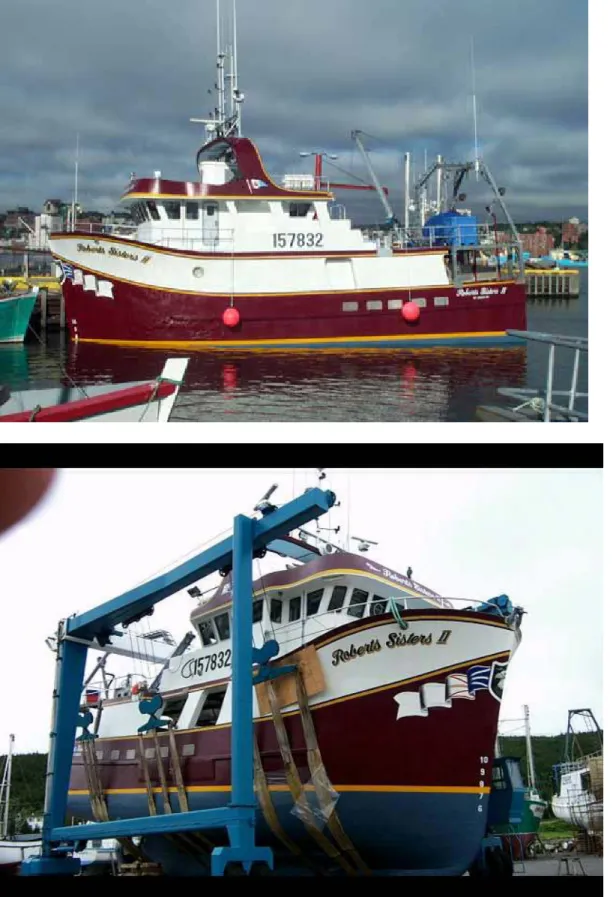
The CCGA Roberts Sisters II (Figure 1) is a typical 65’ fibreglass fishing vessel and the hull was built by Universal Marine Ltd. of La Scie, NL in 2001 to a design furnished by C.E.C Marine Consultants of St. John’s, NL. The vessel owner completed much of the internal finishing. The vessel primarily participates in the inshore snow crab fishery, but has the ability to harvest other species using a trawl, such as shrimp and ground fish, when the stocks are available. The vessel is usually based in St. John’s.
Nominal Principal Particulars:
Length Overall: 64’ 11” (19.79 m)
Beam: 23’ (7.01 m)
Draft: 12’ 6” (3.81 m)
Installed Power: 624 HP (354.2 kW) Displacement: 224 L. Tons (227,594 kg) Fuel Capacity: 4500 gal. (20457.4 l) Fresh Water Capacity: 1300 gal. (5909.9 l) Fish Hold Volume: 3828 ft3 (108.4 m3)
Accommodations: 11 berths
One of the goals of this experiment is to measure the motions of the vessel while it is harvesting its catch, therefore a “half loaded” displacement condition was simulated by adding approximately 47,186 kg. of sea water to two wing tanks normally used for live crab stowage. Once the vessel was ballasted and most of the outfit items installed, an inclining experiment was performed on November 10th by Marine Services International to identify key hydrostatic properties for the trials condition.
The inclining experiment was carried out using standard procedures whereby two pendulums (aft pendulum was 2.781 m long in the fish hold, forward pendulum was 2.54 m long in the forward accommodations) suspended with the weights in a water bath were deployed to measure roll angle. Static roll angles were
induced by the shifting of two 55 gal. plastic drums filled with fresh water,
Draft: 13.625 ft @ AP (4.153 m Aft) 9.25 ft @ FP (2.819 m Fwd.) Displacement: 221.85 Long Tons (225,410 kg) Longitudinal Centre of Gravity (LCG): 0.01 feet (0.003 m) Fwd of amidships Vertical Centre of Gravity (VCG): 11.50 feet (3.505 m) above base plane Transverse Metacentric Height (GMT): 3.11 feet (0.947 m)
Transverse Metacentric Height (KMT): 14.61 feet (4.453 m) above base plane The inclining report delivered by the contractor is included in Appendix A. Note the vessel was inclined with the anti-roll tank empty. The computation for the approximate shift in the center of gravity due to the addition of the trials working level of sea water has been added by IOT to Appendix A.
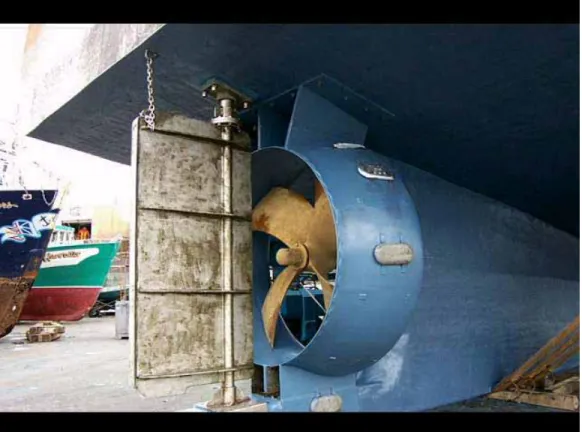
The ‘Roberts Sisters II’ is a round bilge, single screw (fixed pitch propeller in a fixed nozzle), single flat plate rudder vessel with a very large centreline skeg and a passive anti-roll tank fitted just aft of the Bridge. A photograph of the propeller, nozzle and rudder arrangement is provided in Figure 2. The vessel has a normal suite of navigation/ communications electronics including radar, GPS, VHF radio, depth sounder and electronic chart information as well as a ComNav 2001
autopilot. The vessel is fitted with two 12 person inflatable rafts however the lifesaving equipment was augmented with floater suits on loan from the CCG for the trials period. Further information in the vessel particulars, list of outfit items and sketches of the general arrangement can be found in Appendix B.
4.0 DESCRIPTION OF INSTRUMENTATION
IOT was tasked to provide the trials technical support, to install and maintain primary on-board instrumentation, and a data acquisition system with limited online data analysis capability for all the trials. The instrumentation plan is provided in Appendix C while the analog channel calibration information is provided in Appendix D. Note that all analog channel calibrations were verified after completion of the trial. The instrumentation, signal cabling, and data acquisition system used along with the calibration method employed for each parameter is described in this section. The standard IOT sign convention is provided in Reference 10.
4.1 Data Acquisition System (DAS)
The Data Acquisition System (DAS) used for the ‘Roberts Sisters II’ trial was mounted on the galley table of the vessel (see Figure 3). The data acquisition and analysis software package designed for these trials (described in detail in Reference 11) were run on two ruggedized Panasonic notebook computers, which had the following software attributes:
Off-the-shelf Software:
• Windows 2000 – operating system • WinZip 8.0 – data compression software • Excel 2000 – spreadsheet software
• Daqview 2000 – for viewing the data graphically Hardware:
• Daqboard 2000 Additional Devices:
• CompassPoint 2200 GPS – provides position along with heading, rate of turn, etc.
• IOTech Daqbook 2000 – provides analog-to-digital conversion for analog signals including rudder angle, MotionPak, accelerometers and
inclinometers.
• Signal Conditioning and interfacing hardware for analog channels. • Uninterruptible Power Supply (UPS)
Custom Software:
• FishingVesselLogger – the primary program used to acquire the analog data (data rate was generally 50 Hz for each of 16 analog channels). • CompassPointGPS – a slave process to the FishingVesselLogger
program. It receives data from the DGPS unit and also logs all the GPS data.
• FishingVesselCal – used to post-calibrate the acquired data.
• CompassPointNMEA Parser – used to post-parse the NMEA data stream from the CompassPoint 2200 GPS unit and save the resulting parsed data to ASCII.
4.2 Rudder Angle Measurement
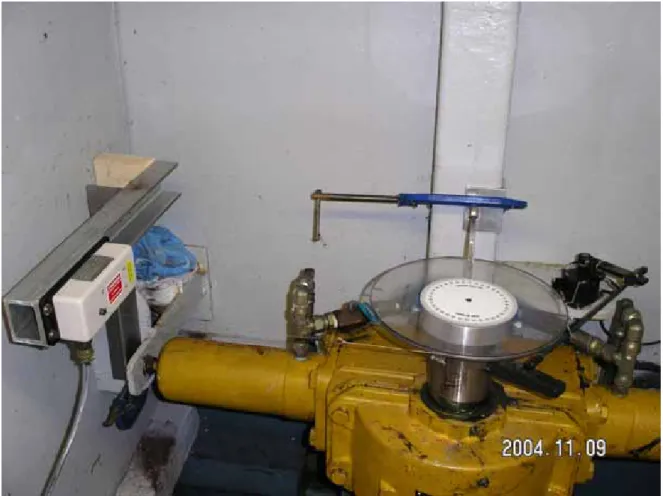
The rudder angle was measured by winding the cable, with wax string extension, from a 10 inch yo-yo type potentiometer linear displacement transducer around a groove cut in a circular ½ inch (1.27 cm) thick Plexiglas plate. The plate was machined with a steel clamp at its centre so that it could be adjusted to any size rudderpost (Figure 4). The transducer was clamped to a convenient vertical frame in the steering gear compartment.
Rudder angle was calibrated with respect to a protractor, drawn using CAD software, fixed to the top of the circular plate with zero degrees from the rudder indicator on the Bridge.
4.3 Ship’s Motion Instrumentation
For the seakeeping trials carried out on November 15th, a MotionPak I was used to measure ship motions with six degrees of freedom. The MotionPak was
Roll Rate Surge Acceleration
Pitch Rate Sway Acceleration
Yaw Rate Heave Acceleration
From these six signals, dedicated MotionPak software was available to derive the following 18 channels in either an earth or body co-ordinate system, and move the motions to any point on the rigid platform:
Roll Angle/Rate/Acceleration Surge Displacement/Velocity/Acceleration Pitch Angle/Rate/Acceleration Sway Displacement/Velocity/Acceleration Yaw Angle/Rate/Acceleration Heave Displacement/Velocity/Acceleration The MotionPak angular rate channels were calibrated using manufacturer’s specifications while the acceleration channels were physically calibrated by placing the sensors on a set of precision wedges and computing the
acceleration. The accelerometers output zero m/s2 when placed on a horizontal plane and –9.808 m/s2 (- 1 g) when oriented with the measuring axis vertical. The intermediate accelerations are computed as follows:
Acceleration = -9.808 m/s2 * sin (angle of inclination)
In addition, orthogonal linear accelerations (sway, surge and heave, Figure 6) were measured on the Bridge, in the main console and physically calibrated using the same procedure as was used for the MotionPak accelerometers. These instruments were used primarily to validate data collected by the
MotionPak. From the inclining report presented in Appendix A, the position of the centre of gravity for the sea trial condition is:
LCG = 0.003 m forward of amidships KGT(fluid) = 3.505 m
One of the complications faced by IOT was the lack of detailed general
arrangement drawings of the ‘Roberts Sisters II’ – probably due to the fact that most of the internal finishing was carried out by the ship’s owner. The only
information available to IOT regarding the internal layout of the ship is provided in sketches included in Appendix A and B. A sketch of the location of the motion sensors measured relative to adjacent ship’s structure is provided in Appendix C. From this information, the nominal location of the
MotionPak relative to CG:
1.955 m aft, 0.04175 m to port and 0.5385 m above MotionPak relative to Helmsman’s position:
6.257 m aft, 2.62 m to port, 3.475 m below
MotionPak to Bridge accelerometers: 6.257 m aft, 0.2187 m to port, 2.56 m below
Note that the sketches for vessel do not include the arrangement of the Bridge so the distance from the MotionPak to the helmsman’s position and Bridge
accelerometers are very rough estimates.
Two inclinometers used in the measurement of the pitch and roll angle were also mounted near the DAS and physically calibrated using the series of precision wedges. It should be noted that the inclinometers have a relatively low response rate and were fitted primarily to measure angular motion in the event that
manoeuvring trials in calm water were carried out. 4.4 Differential Global Positioning System Data
The Global Positioning System (GPS) is a satellite based navigation system operated and maintained by the US Department of Defence. GPS consists of a constellation of 24 satellites providing world-wide, 24 hour, three-dimensional position coverage. Although originally conceived to satisfy military requirements, GPS now has a broad array of civilian applications including becoming the
standard tool for marine navigation.
GPS is currently the most accurate navigation technology available to the public. The GPS receiver computes the distance to a minimum of three GPS satellites orbiting the earth to accurately derive the ship’s position. GPS receivers also output precise time, speed of the ship over the ground (SOG) as well as course over ground (COG) measurements. Additional general information on the operation of a GPS system is provided in Reference 12.
Differential GPS (DGPS) provides greater positioning accuracy than standard GPS since error corrections can be included using a GPS signal transmitted via HF from a receiver established at a known location on land. To acquire a DGPS correction, IOT installed a CompassPoint 2200 GPS (a rectangular antenna with dimensions 60 cm x 16 cm x 18 cm) with a fixed based mounting, which was clamped to the top of the aft end deckhouse (Figure 7). Once the antenna was visually aligned parallel to the ship’s longitudinal centreline, the system software was initiated by having the vessel perform multiple 360 degree rotations in the harbour prior to the trial.
The DGPS correction signal was acquired from a CCG broadcast at a frequency of 315 kHz from Cape Race, NL. Using DGPS, absolute position accuracies between 3 and 10 m can be achieved along with velocity accuracies within 0.1 knots.
The following digital data channels were acquired using the DGPS receiver in standard National Marine Electronics Association (NMEA) format:
Speed Over Ground (SOG) – km/hr
Latitude/Longitude - degrees/minutes/seconds
4.5 Directional Wave Buoy/Mooring Arrangement Two directional wave buoys were used during the trials: Neptune Sciences Sentry Wave Buoy
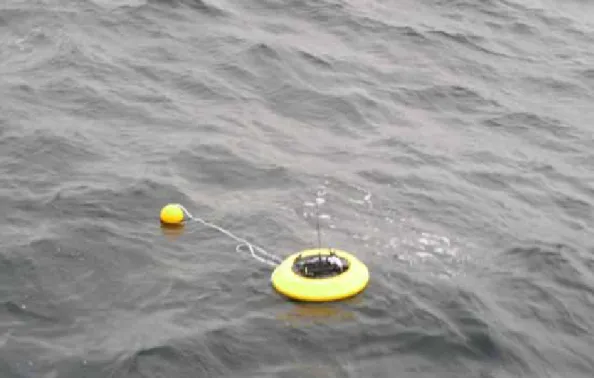
A small (0.75 m diameter, 15.7 kg) discus shaped directional wave buoy manufactured by Neptune Sciences, Inc. of Slidell, Louisiana and procured by MUN for previous sea trials using NSERC funding was used to acquire
information on the wave conditions during the seakeeping trials (Figure 8). The buoy was moored in approximately 165 metres of water at 47° 33” 42’ N, 52° 26” 11’ W. On the day of the trial, the buoy was manually deployed by lifting it over the side of the Roberts Sisters II. Retrieval was accomplished at the end of the trial using the vessel’s crab pot hauler. Unfortunately the upper section of the mooring could not be retrieved using the pot hauler, so this section was brought in by hand which was made more difficult due to a strong surface current.
The wave buoy was configured to acquire data for 17.07 minutes (1024 s) every half hour, process and store the data in an ASCII format file on an internal non-volatile flash disk. A radio modem was used to communicate between a base station on the ‘Roberts Sisters II’ and the buoy over line of sight range using a spread spectrum device operating in the UHF 902-928 MHz frequency band. The buoy assembly is composed of the following components:
• Instrument Housing: composed of a sealed aluminium cylinder with
connections for the antenna and on/off plug on top. The housing contains the instrumentation package, onboard computer and onboard radio modem. All components of motion required to transform the buoy-fixed accelerations into an earth-fixed co-ordinate system (vertical, east-west and north-south) are measured using sensors mounted in the instrument package. Earth-fixed accelerations enable determination of non-directional wave information (wave heights, periods, and non-directional spectra) as well as directional wave information (wave directions and directional spectra) with all required computations executed within the onboard computer.
• Battery Housing: comprises a smaller sealed aluminium cylinder fitted below the instrument housing and contains the battery pack composed of 27
disposable D-cell alkaline batteries providing a 1 to 2 week lifetime with the buoy configured for data collection every ½ hour.
• Floatation Assembly: a rugged urethane foam and aluminium cage designed to provide the appropriate buoyancy for the instrument and battery housing.
The floatation assembly was designed such that the instrument and battery housing combination can be removed and replaced without disturbing the mooring or recovering the entire system.
• Ship Based Modem: An RF modem with dedicated power supply and antenna is used to communicate from a ship based laptop computer to the wave buoy. A dedicated, windows based, user friendly software package is supplied by the buoy manufacturer to facilitate the communication between the ship board computer and the wave buoy. The data can also be retrieved using an umbilical connection to the buoy after the buoy has been recovered. • Mooring Assembly: a mooring system for the wave buoy was designed for a
165 m depth of water by personnel from the MUN Physical Oceanography Group after discussions with the buoy manufacturer. The mooring is described as follows:
• Neptune Wave Buoy with floating tether
• 4 meter half inch nylon cord in parallel with 3 meter shock cord • ½” (1.27 cm) stainless steel shackle and swivel
• 55 meters of ¼” (0.635 cm) jacketed wire rope and shackles • 183 meters 9/16” (1.4287 cm) polypropylene rope
• 10’ (3.5 m) ½” (1.27 cm) galvanized chain • 40 lb. (18.14 kg) Danforth® anchor
Additional information on the Neptune directional wave buoy is provided in Reference 13 while further information and a typical output file is provided in Appendix E.
Datawell Waverider Mark II Wave Buoy
In previous trials the Neptune buoy proved to be unreliable. To ensure acquisition of the required directional wave data, a 0.9 m diameter Datawell Waverider Mark II wave buoy manufactured by Datawell b.v. of the Netherlands was leased from Oceans Ltd. of St. John’s, NL. Oceans Ltd. was responsible for providing the buoy and mooring, supervising its launch/recovery from MV Louis M. Lauzier, as well as acquiring the data during the trial and generating a final data product. The buoy was deployed in 165 m of water in position 47 34.126 N, 52 26.154 W – about 10 nm east of St. John’s. Directional wave data was computed hourly and transmitted to the base station at a frequency of 29.760 MHz with an output power of 150 – 200 mW. The high visibility yellow (Figure 9) buoy includes a flashing light that flashes 5 times every 20 seconds. The single point mooring provided by Oceans Ltd. was designed to ensure sufficient symmetrical
horizontal buoy response with low stiffness permitting the buoy to follow waves up to a wave height of 40 m with a resolution of 1 cm, and wave periods between 1.6 and 30 s. The wave direction resolution was 1.5º while the wave frequency resolution was 0.005 Hz for frequencies less than 0.1 Hz and 0.01 Hz otherwise.
the trials period (approximately 2 months).
The following sensors/equipment was included in the wave buoy: • Hippy-40 pitch angle/roll angle/heave displacement
• Three axis flux gate compass
• Two fixed X and Y linear accelerometers • Sea temperature sensor
• Micro-processor
The receiving system was installed ashore at the Oceans office in St. John’s and consisted of a passive 3 m long (Kathrein) whip antenna with base. A dedicated laptop computer interfaced to the wave direction receiver for storing and
displaying the acquired wave data. The receiver was set up to receive at 38.760 MHz (a higher frequency than being transmitted by the buoy). The base station was only monitored on the days when sea trials occurred. The specifications for the buoy, the mooring description and a typical output data file are provided in Appendix F. Additional information on the buoy can be obtained from the Datawell b.v. web site (Reference 14) and user’s manual that includes a description of the data file format provided by Oceans Ltd. (Reference 15). 4.6 Propeller Shaft Speed
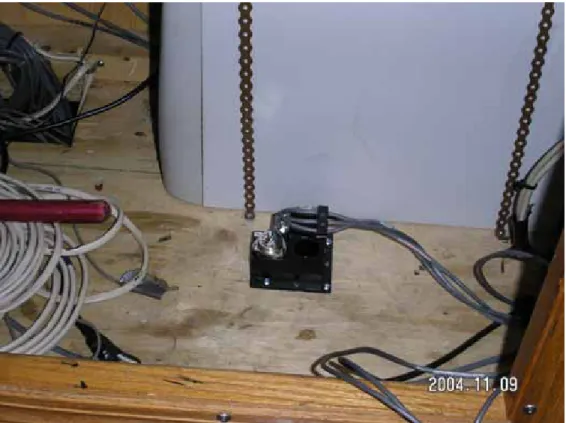
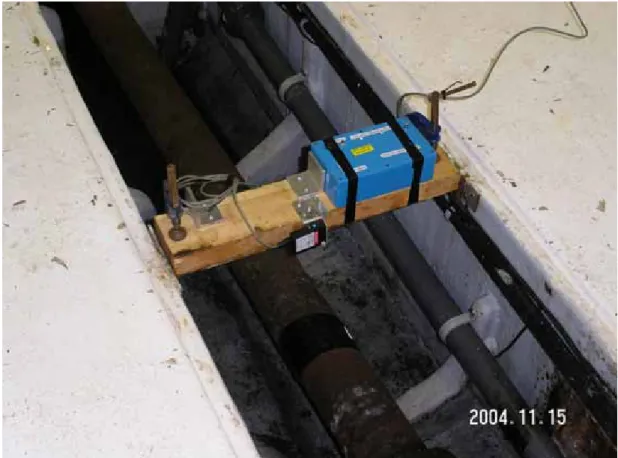
Propeller shaft speed was measured using an optical sensor acting on a piece of reflective tape on the shaft in the engine room. The pulse train from the optical pickup was fed to an IOT designed and built frequency-to-voltage (F/V) circuit that converts the digital pulse train to a linear DC voltage proportional to shaft RPM (Figure 10). This instrumentation was calibrated using a laser tachometer that acted on the reflective target, which was then verified using the vessel’s RPM gauge.
4.7 Directional Anemometer
A MUN “Weather Wizard III”, manufactured by Davis Instruments, provides monitoring and logging of essential weather conditions such as temperature, wind direction, wind speed and wind chill (Figure 11). This instrument was fixed to an aluminium mast furnished by IOT, which was in turn attached to a guard rail aft port side of the deck house. At dockside the directional indicator was aligned with magnetic north. Wind speed and direction were logged by hand.
4.8 Sea Water Temperature/Density Measurement
To determine whether there are any large variations in water density (which would ultimately change the draft of the vessel) between St. John’s harbour
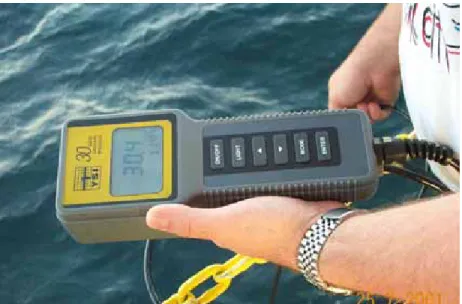
where the ship’s draft is recorded and the trials area, a YSI model 30 battery powered hand-held salinity, conductivity and temperature meter was used to measure the parameters required to determine ambient water density. The YSI 30 unit, manufactured by YSI of Yellow Springs, Ohio, consists of a hand held display device and a weighted probe with 25 feet (7.62 m) of cable connecting the two (Figure 12). The required information, i.e. temperature and salinity, is collected by the probe and presented on the hand held display with an accuracy of ± 2% or ± 0.1 PPT (parts per thousand) for salinity and ± 0.1°C for the
temperature. The instruments range for salinity and temperature is 0 to 80 PPT and -5° to +95°C respectively.
To obtain a mean density of the sea water, the probe tested the water at about half the draft ~ 2 m. The density is then calculated using the Equation of State of Seawater given in Reference 16, which provided density as a function of
temperature, salinity, and pressure. Additional information on the YSI instrument is provided in Reference 17. Note that there was never a requirement to correct the ship’s displacement for a difference in water density between St. John’s and the trials area.
4.9 Electrical Power
Acquiring quality 120 V electrical power was not a problem on the ‘Roberts Sisters II’. IOT filtered all power used for IOT equipment through a UPS, however, to ensure that no power glitches or spikes impaired the data. 4.10 Signal Cabling
Belden 8723 two pair individually shielded cable was used to conduct signals from the MotionPak, accelerometers and inclinometers to the DAS. The inclinometers were located within the unit designed to accommodate the DAS therefore the distance for cable connection was short. The cable for the
accelerometers extended from the wheelhouse console along the deckhead aft, down the stairway, and along the galley deckhead forward to the DAS. The cable to the MotionPak was fed from the DAS through an aft window in the galley, then down through the open fish hold hatch into the fish hold.
In addition, one cable was installed to accommodate the yo-yo potentiometer used to measure the rudder angle. This cable was run from the tiller flat forward to the fish hold penetrating the aft fish hold transverse bulkhead through a gland in a Plexiglas access hatch fabricated by IOT to replace the existing aluminium access hatch normally in place. This cable was simply secured to the transverse beams strengthening the top of the hold and, bundled together with the cable for the MotionPak, was passed through the open hatch cover and finally through an aft window in the galley where the DAS was located.
where it dropped down to the location of the shaft RPM instrumentation. A deck plate in the fish hold had been removed to allow access to the shaft tunnel. The DGPS antenna and the wind anemometer were both located on top of the deckhouse of the vessel. Cabling was simply extended from the DAS aft along the galley deckhead and up the wheelhouse stairs. The cables then passed through an aft window in the wheelhouse and up to the top of the deckhouse.
5.0 TRIALS DESCRIPTION
The test plan for the trial is given in Appendix G. Prior to proceeding to the trials area, a 10 minute zero speed run was carried out in St. John’s harbour in an effort to determine the ship motion natural periods. The seakeeping trials were completed on November 15, 2004 approximately 10 nm due east of St. John’s. Prior to departure, all instrumentation was inspected to ensure all sensors were functioning properly. The draft of the vessel was then measured at the bow and stern of the vessel, before departing for the wave buoy located at 47 34.126 N, 52 26.154 W.
Upon arrival at the wave buoy location, the sea conditions were found to be favourable for the experiment. The significant wave height was visually
estimated at approximately 2.5 m. The log of the trials events can be found in Appendix H.
Typical Procedure for a Set of Forward Speed Seakeeping Runs:
Each run pattern was carried out in the following manner for each nominal forward speed:
• The ship was first positioned in close proximity to the wave buoy and directional wave data acquired to derive the dominant wave direction. • After reviewing the wave data from the buoy, the dominant head sea
direction (degrees magnetic) was corrected using a value of approximately 21 degrees to determine the direction relative to true north.
• The forward speed over the ground for the first run sequence was
adjusted to 4 knots. The heading angle was selected such that the vessel was heading directly into the sea (head sea run). The throttles were adjusted to achieve the desired course and speed. Data acquisition was initiated once steady state conditions were achieved. The course during all runs was maintained under autopilot control.
• After 25 minutes had elapsed on a steady course, data acquisition was terminated.
• The vessel then altered course by 180 degrees to complete the “following” sea run where the wave action is essentially pushing the vessel. The
engine speed was adjusted to maintain a constant speed over ground in order to compare results between runs. Data acquisition was terminated after 40 minutes.
• Course adjustment of 135 degrees was selected to correspond with the next section of the run pattern (bow sea run). The engine speed was adjusted as necessary.
• After 25 minutes had elapsed on a steady course data acquisition was terminated.
• Course adjustment of 135 degrees was selected to correspond with the next section of the run pattern (beam sea run). The engine speed was adjusted as necessary.
• After 25 minutes had elapsed on a steady course data acquisition was terminated.
• Course adjustment of 135 degrees was selected to correspond with the next section of the run pattern (quartering sea run). The engine speed was adjusted as necessary.
• After 25 minutes had elapsed on a steady course data acquisition was terminated.
• After the five runs had been completed, the vessel returned to the wave buoy to verify that the dominant wave direction had not changed and confirm that the wave buoy was working correctly. A 25 minute zero speed drift run in nominally beam seas was carried out at this time.
A second set of runs at a forward speed of 8 knots was carried out on November 15th using the same procedure as was used for the 4 knot runs. Three additional runs at 4 knots (beam, bow and quartering seas) were executed with the passive anti-roll tank filled to ~ 14.75 inches (37.465 cm) deployed.
The dedicated trials team included:
• MUN co-op student – data acquisition and verification • one IOT research staff
• one IOT electronics staff – support in the event of problems with equipment at sea
In addition, there were two MUN School of Human Kinetics and Recreation staff (one researcher and one grad student) carrying out experiments in the
accommodations just forward of the mess on the main deck. The nominal location of these research staff relative to the MotionPak was 8.827 m forward, 0.4628 m to port and 1.3815 m above.
6.0 DESCRIPTION OF ONLINE DATA ANALYSIS
The purpose of performing an online analysis during the trials is to ensure that all the instrumentation is working properly to identify potential problems with the various sensors that may lead to invalid results.
One computer logged the raw data from the data stream and, using the custom software FishingVesselCal, converted the data into a usable format stored with the appropriate physical units. The second computer was used to analyze the data from the previous acquired run to assess its integrity as well as
communicate with the wave buoy. This was done to avoid overloading the computer logging the data, which could have led to program failure and potentially resulted in incomplete data files or even lost data.
Columns of acquired data were converted to Microsoft EXCEL1 format and standard EXCEL plotting utilities were used to view the data in the time domain. An example time series plot of surge acceleration from the MotionPak and x acceleration from the accelerometers is shown in Figure 13. Note the difference in amplitude between the two signals is due to their separation on the ship. 7.0 DESCRIPTION OF OFFLINE DATA ANALYSIS
Once the trial was complete, ASCII data files were compiled for transfer to MUN Kinetics staff. The following additional data analysis was carried out.
7.1 Wave Data Analysis
Wave data was acquired from two sources during the trial. This section describes the data analysis procedure used to generate the Datawell and Neptune wave buoy data products:
7.1.1 Datawell Wave Buoy Data Analysis
Oceans Ltd. carried out the wave analysis using standard software provided by the manufacturer of the buoy. The data was processed on the buoy and both raw and processed data then transmitted to the receiver on shore.
From the accelerations measured in the X and Y directions in the moving buoy reference frame, the accelerations along the fixed north and west axes are calculated. All three accelerations (vertical, north and west) are then digitally integrated to displacements and filtered to a high frequency cut off (0.6 Hz). Finally an FFT is performed on the data.
Raw data are compressed to motion vertical, motion north and motion west. Energy density, main sea direction, directional spreading angle and the normalized second harmonic of the directional distribution for each frequency band are computed on-board the wave buoy in addition to other standard sea state parameters such as significant wave height (SWH), Hmo and mean wave period TZ.
1
© Microsoft Corp.
Note that within the wave buoy, sea direction is measured using a flux gate compass and thus the data is generated in degrees magnetic. The magnetic deviation for St. John’s approaches during the trials period was ~21 degrees West and this correction was applied to derive wave direction in degrees TRUE. A summary of wave statistics acquired using the Datawell wave buoy is provided in Appendix I. Nondirectional spectrum plots as well as Mean Wave Direction (corrected to degrees TRUE) versus Frequency plots are also provided in Appendix I for each half hour measurement cycle.
7.1.2 Neptune Wave Buoy Data Analysis
Directional wave data is calculated from the motion of the buoy whereby these motions, recorded by onboard sensors for angular and vertical accelerations, accurately mimic the attitude of the ocean due to its discus shaped floatation device. The recordings are then analyzed using spectral analysis to provide directional and nondirectional wave spectra. A directional wave spectrum describes the distribution of wave energy as a function of both frequency and direction, whereas the nondirectional wave spectrum is a function of frequency only.
More precisely, as a definition:
Nondirectional Wave Spectrum (C11): is a one dimensional wave energy density that has its greatest value at the frequency where the nondirectional wave energy density is greatest.
This nondirectional wave spectrum is then used for computing wave energy where:
S(f,α) = C11(f) * D(f, α)
By which, D is a directional spreading function with a dependency on both
frequency f and direction α. S is a two dimensional wave energy density that has its greatest value at the frequency and direction where the directional wave energy is greatest. D(f, α) may be expanded in an infinite Fourier Series as a function of wave direction α. An approximation of the D(f, α) may be provided by computing the first two terms:
D(f, α) ≈ [1/π] * [(1/2) + r1 * cos(α – α1) + r2 * cos(2 * (α – α2))] Where: alpha1 (α1) – mean wave direction
alpha2 (α2) – principal wave direction
r1 , r2 – frequency dependent parameters that theoretically lie between zero and one.
Significant Wave Height: Average height from wave crest to trough of the one-third highest waves measured. It is assumed that the nondirectional spectrum is relatively narrow and thus significant wave height is computed as:
Significant Wave Height = Hm0 = 4 m01/2,
Where, m0 is the area under the nondirectional wave spectrum C11. Dominant Wave Period/Frequency (Peak Wave Period/Frequency): is the period/frequency associated with center frequency of the frequency band that has the largest (peak) energy density in the nondirectional spectrum (C11). Average Wave Period/Frequency: The average wave period is computed from the spectral moments as follows:
Tav = m0/m1 and fav = 1/Tav where:
“m1” – the first moment of area under the nondirectional wave spectrum C11.
Dominant Wave Direction: the value of α1 for the frequency band where the largest value of C11 occurs.
Average Wave Direction: is the weighted average over all frequency bands. This wave direction is the energy density weighted vector average of α1 over all
frequency bands and is computed from: Average wave direction = tan-1 (Y, X) Where: Y = Σ [C11(f) * sin(α 1(f))]
X = Σ [C11(f) * cos(α1 (f))]
Note that within the wave buoy, sea direction is measured using a flux gate compass and thus the data is generated in degrees magnetic. The magnetic deviation for St. John’s approaches during the trials period was ~21 degrees West and this correction was applied to derive wave direction in degrees TRUE. A summary of wave statistics acquired using the Neptune wave buoy is also provided in Appendix I. Nondirectional spectrum plots as well as Mean Wave Direction (corrected to degrees TRUE) versus Frequency plots are also provided in Appendix I for each half hour measurement cycle.
7.2 Interpreting the Raw Data
The data received by all the various instruments onboard the vessel was initially recorded as an analog DC voltage. A calibration file was then applied to the raw
data using the custom software program FishingVesselCal. The calibration file included a five point linear regression curve and instrument offsets for each instrument. A summary of the calibration file along with the regression equations is provided in Appendix D. The data was converted to GEDAP format described in Reference 18 and standard IOT software used to analyze the data.
Example time series plots are provided as follows (trawl speed, beam seas): Figure 14: Surge, Sway and Heave Displacement vs. Time
Figure 15: Surge, Sway and Heave Acceleration vs. Time Figure 16: Roll, Pitch and Yaw Angle vs. Time
Figure 17: Roll, Pitch and Yaw Rate vs. Time Figure 18: Shaft Speed and Rudder Angle vs. Time
Figure 19: Speed Over Ground (SOG and Course Over Ground (COG) vs. Time 7.3 Validation of MotionPak Software and Instrumentation
Within the software used to analyze MotionPak data, there is the capability to translate the accelerations recorded to any position onboard the vessel. To verify the ship motions data acquired, the motions were moved from the location of the MotionPak to the accelerometers located in the wheelhouse and then analyzed in the “Body” fixed coordinate system. All acceleration values have been tared.
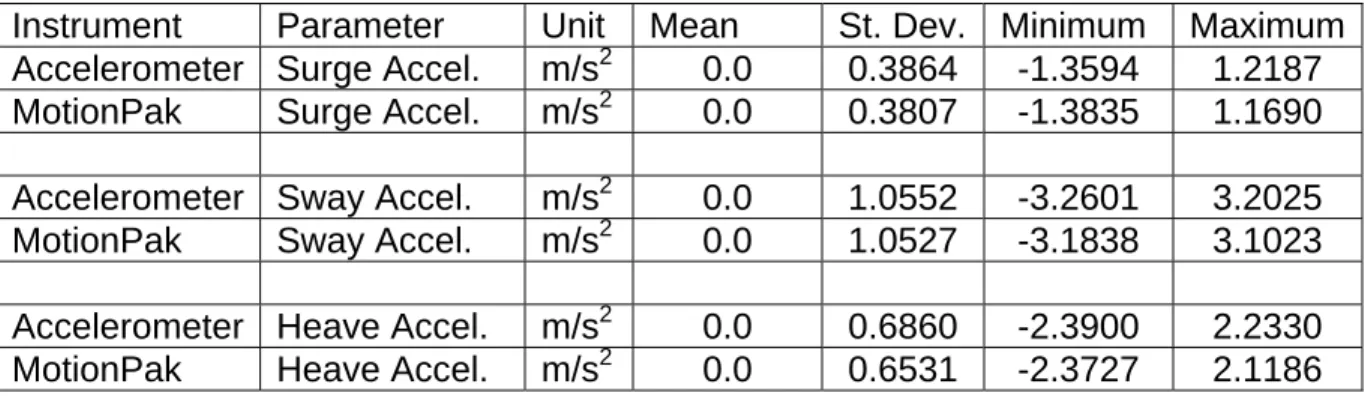
Table 1 shows the comparison between the data from MotionPak and the linear accelerometers in beam seas – 4 knots with the anti-roll tank empty. From the values of standard deviation computed, it is demonstrated that the accelerations recorded were very similar. Deviations are likely due to the poor quality of the documentation for the ship and resultant difficulty in determining accurately the linear displacements between the location of the MotionPak and the
accelerometers.
Instrument Parameter Unit Mean St. Dev. Minimum Maximum Accelerometer Surge Accel. m/s2 0.0 0.3864 -1.3594 1.2187 MotionPak Surge Accel. m/s2 0.0 0.3807 -1.3835 1.1690 Accelerometer Sway Accel. m/s2 0.0 1.0552 -3.2601 3.2025 MotionPak Sway Accel. m/s2 0.0 1.0527 -3.1838 3.1023 Accelerometer Heave Accel. m/s2 0.0 0.6860 -2.3900 2.2330 MotionPak Heave Accel. m/s2 0.0 0.6531 -2.3727 2.1186 Table 1: MotionPak Validation
Comparative time series plots of surge, sway and heave accelerations are provided in Figures 20 to 22 indicate a close correlation of the signals.
inclinometer data was not considered valid for data collected in a seaway due to the inherently low response rate of the inclinometers.
7.4 Ship Motion Analysis
As stated above, there is the capability to translate the accelerations recorded to any position onboard the vessel using the MotionPak software. As part of this seakeeping experiment, data from the MotionPak was used to compute the motions at two positions on the vessel: the vessel’s centre of gravity, and the helmsman’s position.
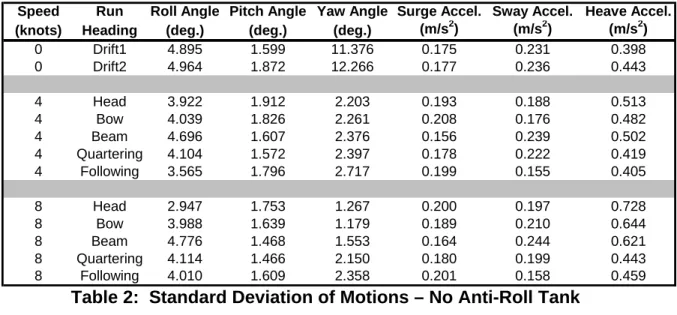
Tables of detailed basic information and statistics (average, standard deviation, minimum and maximum) for each run for both locations of interest are provided in Appendix J. A summary of the standard deviations of the basic motions are presented for the runs without roll tank deployed in Table 2 and with the anti-roll tank deployed in Table 3.
Table 2: Standard Deviation of Motions – No Anti-Roll Tank
Table 3: Standard Deviation of Motions – With Anti-Roll Tank
A plot o t the
G vs. heading angle is provided in Figure 23 (4 knots) and Figure 24 (8 knots).
Speed Run Roll Angle Pitch Angle
Speed Run Roll Angle Pitch Angle Yaw Angle Surge Accel. Sway Accel. Heave Accel. (knots) Heading (deg.) (deg.) (deg.) (m/s2) (m/s2) (m/s2)
0 Drift1 4.895 1.599 11.376 0.175 0.231 0.398 0 Drift2 4.964 1.872 12.266 0.177 0.236 0.443 4 Head 3.922 1.912 2.203 0.193 0.188 0.513 4 Bow 4.039 1.826 2.261 0.208 0.176 0.482 4 Beam 4.696 1.607 2.376 0.156 0.239 0.502 4 Quartering 4.104 1.572 2.397 0.178 0.222 0.419 4 Following 3.565 1.796 2.717 0.199 0.155 0.405 8 Head 2.947 1.753 1.267 0.200 0.197 0.728 8 Bow 3.988 1.639 1.179 0.189 0.210 0.644 8 Beam 4.776 1.468 1.553 0.164 0.244 0.621 8 Quartering 4.114 1.466 2.150 0.180 0.199 0.443 8 Following 4.010 1.609 2.358 0.201 0.158 0.459
Yaw Angle Surge Accel. Sway Accel. Heave Accel. (knots) Heading (deg.) (deg.) (deg.) (m/s2) (m/s2) (m/s2)
4 Bow 2.089 2.329 1.999 0.222 0.195 0.584 4 Beam 3.028 1.781 2.881 0.185 0.263 0.545 4 Quartering 2.747 1.645 2.624 0.185 0.238 0.461
f roll angle, pitch angle and heave acceleration standard deviation a C
7.5 Roll and Pitch Frequency Analysis
variance spectral density analysis was carried out on the roll rate and pitch rate
oll Period: 6.3366 s
.0 DISCUSSION & RECOMMENDATIONS
he following is a series comments on how the trial was executed with
allasting Effort: A
data for the zero speed run carried out in St. John’s harbour prior to the trial in an effort to determine the roll and pitch period. The following values for the motion period at the spectral peak were output:
R
Pitch Period: 4.0132 s 8
T
recommendations on how to improve the quality of data collected. B
he ‘Roberts Sisters II’ is fitted with two water tight ‘live hold’ wing tanks used for
verall Outfit: T
live crab storage and transportation. These tanks were filled with approximately 47,186 kg of sea water to simulate a partially loaded condition. The tanks were pressed up to the hatches to reduce free surface affects. This proved to be a much easier ballasting strategy than filling fish holds with ice or water bags as was used for some of the previous seakeeping trials.
O
fit of the ‘Roberts Sisters II’ went well with few complications. Not
arily
o
he initial location chosen for the GPS antenna (on the arch above the S
quipment Security: Overall the out
having to install a portable generator to power IOT electronics certainty reduces the complexity of the outfit and operational risks. Since the vessel was less than 3 years old, it afforded a clean, attractive work environment. The existing
aluminium Lazarette access hatch in the aft fish hold bulkhead was tempor replaced with an IOT fabricated Plexiglas hatch with integral cable gland. Installing a Plexiglas hatch was preferable to fitting a gland in the aluminium hatch to be sealed up after the trial as this would minimize potential damage t the ship.
T
wheelhouse) was found to be unsatisfactory during alignment of the GP magnetic compass. The antenna was moved to a new location with a less obstructed view of the sky, and aligned satisfactorily.
E
d components fabricated specifically for this sea trial were A number of dedicate
missing and substitutes had to be fabricated at the last minute. Security at IOT was an ongoing concern throughout these trials and it is recommended that trials equipment be stored in a secure facility in future.
ts lays in
the
ave Buoys
trial was eventually carried out Monday November 15, 2004 in ~ 2.5 m SWH however the surface current was exceptionally strong - estimated at 4 to 5 kno for most of the day. This high current likely had a negative impact on the performance of both wave buoys. This resulted in high speed drift runs, de returning to the wave buoy position, and higher than desired forward speeds for the trawl speed runs with the current behind us (2 to 3 knots was desired
whereas the vessel was traveling at ~ 4 to 5 knots speed over ground with engines idling).
W
oblems found during trials carried out in 2003, a Work Instruction
s a 10
ime
he Neptune buoy appeared to be submerged early in the morning due to the of the
omparison of Neptune and Datawell Wave Buoy Data: Because of pr
was written to instruct users of the Neptune directional wave buoy (Reference 19). This was fortunate, as several previously unseen anomalies were
discovered. Although the Neptune operation manual (Reference 13) list
nm range, in practice, unless the buoy was in visual line of sight, there were no radio communications. This may be due to the small vessel size (low elevation of buoy antenna) or the seas being outside of the buoy capabilities. It was discovered during the CCGA Miss Jacqueline IV trial (Reference 3) that the Neptune buoy would lose data if communications were occurring during the t period when the buoy normally performed it’s on board data analysis. This lost data file was not recoverable. The Work Instruction was thus amended (V2.0) to address this problem and outline the correct communication time periods. T
very strong current. The mooring deployed was not designed for the high current. As with previous trials, there were concerns regarding the integrity wave direction data. As well it is assumed that the strong current had a negative impact on the acquired wave height data.
C
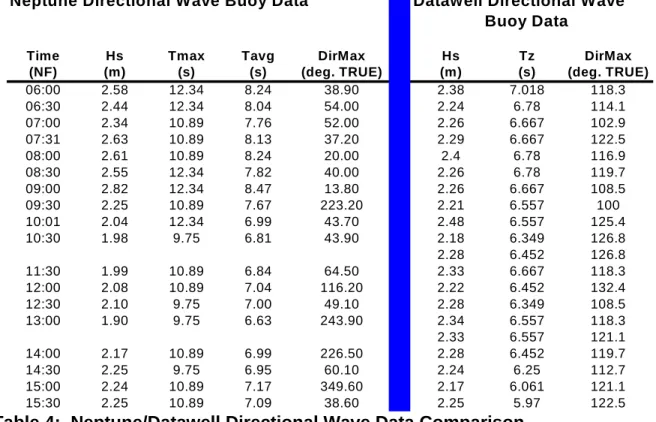
s for the same time A comparison of wave data acquired from both wave buoy
period is provided in Table 4 below.
Neptune Directional Wave Buoy Data Datawell Directional Wave Buoy Data
Time Hs Tmax Tavg DirMax Hs Tz DirMax
(NF) (m) (s) (s) (deg. TRUE) (m) (s) (deg. TRUE)
06:00 2.58 12.34 8.24 38.90 2.38 7.018 118.3 06:30 2.44 12.34 8.04 54.00 2.24 6.78 114.1 07:00 2.34 10.89 7.76 52.00 2.26 6.667 102.9 07:31 2.63 10.89 8.13 37.20 2.29 6.667 122.5 08:00 2.61 10.89 8.24 20.00 2.4 6.78 116.9 08:30 2.55 12.34 7.82 40.00 2.26 6.78 119.7 09:00 2.82 12.34 8.47 13.80 2.26 6.667 108.5 09:30 2.25 10.89 7.67 223.20 2.21 6.557 100 10:01 2.04 12.34 6.99 43.70 2.48 6.557 125.4 10:30 1.98 9.75 6.81 43.90 2.18 6.349 126.8 2.28 6.452 126.8 11:30 1.99 10.89 6.84 64.50 2.33 6.667 118.3 12:00 2.08 10.89 7.04 116.20 2.22 6.452 132.4 12:30 2.10 9.75 7.00 49.10 2.28 6.349 108.5 13:00 1.90 9.75 6.63 243.90 2.34 6.557 118.3 2.33 6.557 121.1 14:00 2.17 10.89 6.99 226.50 2.28 6.452 119.7 14:30 2.25 9.75 6.95 60.10 2.24 6.25 112.7 15:00 2.24 10.89 7.17 349.60 2.17 6.061 121.1 15:30 2.25 10.89 7.09 38.60 2.25 5.97 122.5
Table 4: Neptune/Datawell Directional Wave Data Comparison
The results for both buoys were computed using spectral data. Minor differences can be expected for any two wave buoys moored 0.5 nm apart. The significant wave heights are comparable however the Neptune buoy output a higher wave period probably due to the influence of the high current on the mooring. It is apparent that there is a major discrepancy in the wave direction between the two buoys.
Passive Anti-Roll Tank
The passive anti-roll tank was filled to the normal operating level (37.465 cm) for the last three runs. This is less than the level recommended in the tank
operating instructions in the ship’s Stability Booklet (recommended level: 48.26 cm). It was difficult to determine the operating level using the sight glass (Figure 25) on the moving ship. The Master also stated that the level is normally
adjusted to provide optimum results according to the direction of the vessel with respect to the incident waves. The level was maintained at a constant value for all the trial runs, however.
9.0 ACKNOWLEDGEMENTS
The authors would like to thank Capt. Glen Winslow and the crew of the CCGA Roberts Sisters II for their enthusiastic support during the trial, the CCG for the loan of survival equipment, Jack Foley of MUN Oceanography for assistance designing the wave buoy mooring, and IOT technical staff for their efforts
Funding support from the Search & Rescue (SAR) New Initiatives Fund (NIF) and the Canadian Institutes of Health and Research (CIHR) is gratefully acknowledged.
10.0 REFERENCES
1. Barrett, J., Cumming, D., Hopkins, D., “Description of Seakeeping Trials Carried Out on CCGA Atlantic Swell – October 2003”, IOT Report TR-2003-28, December 2003.
2. Cumming, D., Hopkins, D., Barrett, J., “Description of Seakeeping Trial
Carried Out on CCGS Shamook – December 2003”, IOT Report TR-2004-01, January 2004.
3. Cumming, D., Fleming, T.,” Description of Seakeeping Trial Carried Out on CCGA Miss Jacqueline IV – October 2004”, IOT Report TR-2004-15, December 2004.
4. Cumming, D., Fleming, T.,” Description of Seakeeping Trial Carried Out on CCGA Nautical Twilight – November 1, 2004”, IOT Report TR-2004-13, December 2004.
5. “SafetyNet – a Community Research Alliance on Health and Safety in Marine and Coastal Work”, www.SafetyNet.MUN.ca, December 2003.
6. Stevens, S.C., Parsons, M.G., “Effects of Motion at Sea on Crew
Performance: A Survey”, SNAME Publication Marine Technology, Vol. 39, No. 1, January 2002, pp. 29 – 47.
7. Boccadamo, G., Cassella, P., Scamardella, A., “Stability, Operability and Working Conditions Onboard Fishing Vessels”, 7th International Conference on Stability of Ships and Ocean Vehicles, Launceston, Tasmania, Australia, February 7-11, 2000.
8. Crossland, P., Rich, K.J.N.C., “A Method for Deriving MII Criteria”,
Conference on Human Factors in Ship Design and Operation, London, UK, September 27 – 29, 2000.
9. Graham, R., “Motion-Induced Interruptions as Ship Operability Criteria”, Naval Engineers Journal, March 1990.
10. “Model Test Co-ordinate System & Units of Measure”, IOT Standard Test Methods GM-5, V3.0, February 14, 2001.
11. Janes, G., Cumming, D., “Fishing Vessel Sea Trial Stand-Alone Data Logging System”, Institute for Marine Dynamics Report LM-2003-27, September 2003.
12. Hofmann-Wellenhof, B.,”Global Positioning System: Theory and Practice”, Wein: Springer, 2001.
13. Sentry Wave Buoy Operation Manual, Neptune Sciences, Inc., Slidell, Louisiana, USA.
14. Datawell b.v. web site:
http://www.datawell.nl/documentation/directional_waverider_mkii_brochure. pdf - January 2004.
15. “Wave Data Collection Directional Waverider Buoy User Manual”, Oceans Ltd., June 2004.
16. Fofonoff, P., Millard Jr., R.C., “Algorithms for Computation of Fundamental Properties of Seawater”, UNESCO Technical Papers in Marine Science, 1983, pp. 44-53.
17. YSI Model 30/YSI Model 30M Handheld Salinity, Conductivity and
Temperature System Operations Manual, YSI Inc., Yellow Springs, Ohio, DRW #A30136D, May 1998.
18. Miles, M.D., “The GEDAP Data Analysis Software Package”, NRC Institute for Mechanical Engineering, Hydraulics Laboratory Report No. TR-HY-030, August 11, 1990.
19. “Operation of Neptune Sentry Directional Wave Buoy”, IOT Quality System Work Instruction TRL-13, V1.0, September 30, 2004.
TR-2005-09
Figure 2: CCGA Roberts Sisters II – Propeller, Nozzle & Rudder Arrangement
TR-2005-09
Figure 4: Rudder Angle Measurement
Figure 6: Orthogonal Linear Accelerometers in Bridge Console
TR-2005-09
Figure 8: Neptune Directional Wave Buoy
Figure 10: Shaft RPM Measurement
TR-2005-09
Figure 12: Hand Held Salinometer
Surge and X acceleration
-0.3 -0.2 -0.1 0.0 0.1 0.2 0.3 0 10 20 30 40 50 6 time (s) acceleration (g) 0 MP_SURGE (g) X_Accel (g)
Figure 14: Offline Data Analysis – Surge, Sway and Heave Displacement
TR-2005-09
Figure 16: Offline Data Analysis – Roll, Pitch and Yaw Angle
Figure 18: Offline Data Analysis – Shaft Speed and Rudder Angle
Figure 19: Offline Data Analysis – Speed Over Ground (SOG) and Course Over Ground (COG)
TR-2005-09
Figure 20: Comparison of MotionPak Surge Acceleration @ CG & Accelerometer Surge Acceleration on Bridge
Figure 21: Comparison of MotionPak Sway Acceleration @ CG & Accelerometer Sway Acceleration on Bridge
Figure 22: Comparison of MotionPak Heave Acceleration @ CG & Accelerometer Heave Acceleration on Bridge
TR-2005-09
CCGA Roberts Sisters II Seakeeping Results - 4 knots
0.0 0.5 1.0 1.5 2.0 2.5 3.0 3.5 4.0 4.5 5.0 0 45 90 135 180
Heading Angle (deg.)
Angle (deg.) 0.0 0.1 0.2 0.3 0.4 0.5 0.6 0.7 0.8 Acceleration (m/s 2 )
Roll Angle Pitch Angle Roll Angle (ART) Pitch Angle (ART) Heave Accel. Heave Accel. (ART)
180 deg. is a Head Sea
CCGA Roberts Sisters II Seakeeping Results - 8 knots 0.0 0.5 1.0 1.5 2.0 2.5 3.0 3.5 4.0 4.5 5.0 0 45 90 135 1
Heading Angle (deg.)
Angle (deg.) 0.0 0.1 0.2 0.3 0.4 0.5 0.6 0.7 0.8 Acceleration (m/s 2 )
Roll Angle Pitch Angle Heave Accel.
180 deg. is a Head Sea
80
Figure 24: Seakeeping Results @ CG (Standard Deviations) – 8 knots