Publisher’s version / Version de l'éditeur:
Proceedings 18th International Conference on Port and Ocean Engineering under Arctic Conditions, POAC'05, 1, pp. 399-408, 2005
READ THESE TERMS AND CONDITIONS CAREFULLY BEFORE USING THIS WEBSITE. https://nrc-publications.canada.ca/eng/copyright
Vous avez des questions? Nous pouvons vous aider. Pour communiquer directement avec un auteur, consultez la
première page de la revue dans laquelle son article a été publié afin de trouver ses coordonnées. Si vous n’arrivez pas à les repérer, communiquez avec nous à [email protected].
Questions? Contact the NRC Publications Archive team at
[email protected]. If you wish to email the authors directly, please see the first page of the publication for their contact information.
NRC Publications Archive
Archives des publications du CNRC
This publication could be one of several versions: author’s original, accepted manuscript or the publisher’s version. / La version de cette publication peut être l’une des suivantes : la version prépublication de l’auteur, la version acceptée du manuscrit ou la version de l’éditeur.
Access and use of this website and the material on it are subject to the Terms and Conditions set forth at
Tiltmeter Application at Norströmsgrund Lighthouse - STRICE Project. Frederking, Robert
https://publications-cnrc.canada.ca/fra/droits
L’accès à ce site Web et l’utilisation de son contenu sont assujettis aux conditions présentées dans le site
LISEZ CES CONDITIONS ATTENTIVEMENT AVANT D’UTILISER CE SITE WEB.
NRC Publications Record / Notice d'Archives des publications de CNRC: https://nrc-publications.canada.ca/eng/view/object/?id=3c0a70a6-b496-4d17-8601-bef3c0f2521f https://publications-cnrc.canada.ca/fra/voir/objet/?id=3c0a70a6-b496-4d17-8601-bef3c0f2521f
Proceedings 18th International Conference on Port and Ocean Engineering under Arctic Conditions, POAC’05
Vol. 1, pp 399-408, Potsdam, NY, USA, 2005.
TILTMETER APPLICATION AT NORSTRÖMSGRUND
LIGHTHOUSE - STRICE PROJECT
R. Frederking
Canadian Hydraulics Centre National Research Council of Canada
Ottawa, ON, K1A 0R6, Canada
ABSTRACT
The STRICE project installed load panels on half the circumference of the
Norströmsgrund lighthouse in the Gulf of Bothnia to make direct measurements of ice forces. Near continuous measurements and observations of ice conditions were also made. As an adjunct to the project, a high-resolution tiltmeter capable of
simultaneously measuring tilt in two orthogonal directions was installed inside the lighthouse for the 2002 winter season in order to assess an alternative means of measuring global ice force. For quasi-static ice loading, the tiltmeter provided a good representation of ice force acting on the lighthouse regardless of the direction from which the forces acted. In the case of dynamic ice loading with frequency
components up to 3 Hz, a 7-second moving average "filter" provided a good representation of force components up to 0.5 Hz.
INTRODUCTION
Tiltmeters offer a relatively simple and inexpensive means of determining global ice forces by measuring the tilt response of a structure. The key to doing this is
calibrating the tilt against a known force, since the amount of tilt is a function of the foundation stiffness as well as the stiffness of the structure. Ice force measurements at Norströmsgrund lighthouse by the STRICE project provide an opportunity to calibrate the structure-tiltmeter system, since at this location the lighthouse tilt is a function of primarily ice action. The ice force measuring panels cover about one half the
circumference of the lighthouse, so force in the direction of motion and at a right angle can be completely determined, provided the ice motion direction is centered on the section covered with panels. This information is sufficient to calibrate foundation
and lighthouse stiffness, since these stiffnesses can be assumed omni directional. A tiltmeter responds to both tilt changes and lateral accelerations so the measurements at Norströmsgrund provide an opportunity to define the operational envelope in terms of frequency response and long-term stability. Once calibrated, the tiltmeter provides a means for measuring the total ice forces on the lighthouse, regardless of the ice motion direction. Tilt meters have been used since 1997 on the Confederation Bridge (Cheung et al, 1997). Their application at Norströmsgrund provided an opportunity to verify their performance where ice loading is dominant, as compared to the
Confederation Bridge where wind loading is usually dominant (Kubat et al, 2000 and Brown, 2001). This paper will describe the tiltmeter, calibration of the system, interpreted ice loads and specify an operational envelope.
DESCRIPTION OF TILTMETER
An Applied Geomechanics biaxial Model 716-2A high-resolution tiltmeter, similar to those on the Confederation Bridge, was deployed for the tilt measurements. The instrument selected is a high-gain version so it has a maximum sensitivity of
0.1 µradians on its high-gain setting for a range of ±800 µradians (±0.045 degrees). On the low gain setting the range is ±8000 µradians. The instrument works on the bubble level principle, using a conductive fluid in a glass tube. A change in tilt produces a change in conductivity. The instrument is referenced to gravity, so, the instrument senses both changes in tilt and horizontal accelerations. The instrument has two single-pole RC low-pass filters that are switch selectable. With the filter switch off the time constant is 0.05 s and with the switch on the time constant is 7.5 s. The time constant is one third of the time it takes the output signal to settle to 90% of it final value, in response to a step change in tilt.
INSTRUMENT INSTALLATION AND OPERATION
The tiltmeter was installed on 2002 February 27 at 14:00. The location was on the inside of the West wall of the lighthouse, 6.5 m above Mean Sea Level. The sign convention for the tiltmeters was X-axis positive for tilt towards the north and Y-axis positive for tilt towards the east. At the time of installation the settings for the
instrument were as follows:
GAIN: LOW
FILTER: OFF
On 2002 April 4 at about 1:00 the filter was switched on
FILTER ON
At 1155 on April 7 the GAIN setting was switched to HIGH GAIN.
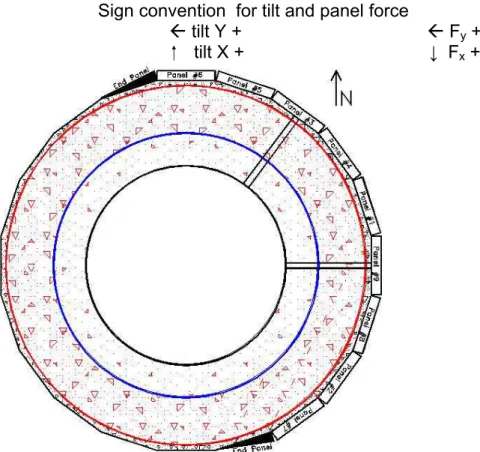
For clarity in subsequent discussion of the calibration and interpretation of the results, the location of the ice force measuring panels on the lighthouse and the sign
conventions are noted in Figure 1. There were 9 panels, each 1.2 m wide by 1.6 m high. It can be seen that for an ice movement from the east, the panels are able to
measure the total force. For movements in other directions the panels only measure part, or, in the case of a movement from the west, none of the actual force. The tiltmeter, as installed is shown in Figure 2. To facilitate “zeroing” of the tiltmeter at the time of installation, a mounting plate that allows fine adjustment of the tilt was used
Sign convention for tilt and panel force
Å tilt Y + Å Fy + tilt X + ↓ Fx +
Figure 1 Location of panels and sign convention for panel force and tiltmeter; note that tiltmeter is installed on th interior of the West wall of the lighthouse
CALIBRATION
The tiltmeter was calibrated using the results of a loading event on the afternoon of April 4, 2002. The event recording started at 12:50, before the tiltmeter filter had been switched on. For the first 4 minutes (250 s), the ice movement was from the east, so it could be assumed that the panels were able to measure the full load applied from the east. The X and Y components of the ice force applied to the lighthouse, as determined from the panel record for this period are plotted in Figure 3. Note that the X component of force was initially from the south (negative), and then from the north (positive). The recording frequency was 10 Hz and this ice loading episode could be termed “static”, although there were variations, for example the maximum force peaks had a combined rise and fall time of 10 s. Figure 4 plots the tilt traces for the same time period. The 10 Hz raw tilt data and a “filtered” tilt using a 3-second moving average are presented. Since there was no filtering of the raw tilt records, the large and small amplitude oscillations are a result of the tiltmeter function and do not represent actual tilt response of the lighthouse. The raw tilt data had small and large amplitude oscillations superimposed on a base signal, with about a 2 Hz frequency for the large amplitude parts of the record, but for the low amplitude parts of the record showing no systematic frequency. Close comparison of the tilt and force records showed that whenever there were rapid drops in the forces determined from the panels (note times 65 ad 235 s), the oscillation amplitude of the raw tilt measurements were much larger, suggesting that the instrument was responding to lateral accelerations rather than actual tilt of the lighthouse. The general similarity of the tilt and force components can be seen by comparing Figures 3 and 4.
-400 -200 0 200 400 600 800 1000 1200 1400 0 50 100 150 200 250 time (s) Total Force (kN) Fx Fy
-100 -50 0 50 100 150 200 0 50 100 150 200 250 time (s) tilt (microradian) Tilt_x Tilt_y x filtered y filtered Tilt_x Tilt_y
Figure 4 Tilt record of 2002 April 4 event, ice movement from east (Note that
unit mu rad on axis is equivalent to µradian)
The digitally filtered tilt data (3 second moving average) have been used to produce cross-plots of tilt versus force, Figures 5 and 6 for the X and Y directions,
respectively. A linear regression line has been fit to each set of data. For the Y direction, the force in kN is about 12 times the tilt in µradians. The cross plot of the X components has an overall negative slope, as expected, and has a lower slope, in this case about 4. This is not surprising, since it was known that the panels may be missing some of the X component of forces. One-second and seven-second moving average filters were also applied, but the slopes differed by less than ± 0.1 % from the three-second slope. y = -4.298x + 61.179 R2 = 0.8872 -400 -350 -300 -250 -200 -150 -100 -50 0 50 100 150 0 10 20 30 40 50 60 70 80 90 X-tilt (microradian) Force x (kN)
Figure 5 Calibration of load in X-direction, ice movement from east, panels do not capture all ice force
y = 11.577x - 409.25 R2 = 0.9611 -400 -200 0 200 400 600 800 1000 1200 1400 0 20 40 60 80 100 120 140 Y-tilt (microradian) Force y (kN)
Figure 6 Calibration of load in Y-direction, ice movement from east, panels capture all ice force
Other loading episodes were examined and calibration factors for X and Y
components of panel force and tilt were determined. The maximum value for the X component was –12 kN/µradian and for the Y component 12 kN/µradian. As was discussed in the first section of this paper, it is assumed that the soil/foundation properties are the same, regardless of the direction in which the lighthouse is tilting, so a calibration coefficient of 12 kN/µradian was set for converting tilt to force for both X- and Y-axis directions.
RESPONSE ASSESSMENT
An event on 2002 March 21 was used to assess the response of the tiltmeters to a dynamic ice loading. The recording frequency was 30 Hz and the ice failure mode was described as crushing and bending. Ice speed was 0.17 m/s from the northeast and ice ridge thickness of 2.3 to 3 m was measured. A time series record of the ice force components determined from the panel measurements is plotted in Figure 7. The character of this force record shows a strong oscillatory component, quite different compared to the static force of Figure 3.
0 500 1000 1500 2000 2500 3000 3500 400 500 600 700 800 900 TIME (s) PANEL FORCEe (kN) Fx Fy Fx Fy
Figure 7 Force components from panels for A dynamic loading event on March 21, 2002
A short record of the Y-component tilt is presented in Figure 8 to illustrate the response of the tiltmeter to a dynamic ice load. The tilt record has a high amplitude oscillation at a frequency of about 2.5 Hz. Applying a 7-second moving average filter produces a more realistic representation of the tilt of the lighthouse. The filtered tilt data was multiplied by 12 kN/µradian to convert tilt to force. The two force records Fy (from panels) and Fy tilt show a similar trend, however force from the filtered tiltmeter data still shows larger amplitude oscillations than the force from the panels.
-3000 -2000 -1000 0 1000 2000 3000 4000 5000 660 662 664 666 668 670 TIME (s) FORCE Fy (kN) -3000 -2000 -1000 0 1000 2000 3000 4000 5000 TILT (microradian) Fy panels Tilt Y Tilt Y, 7 s average Fy tilt
Figure 8 Conversion of tilt to force for dynamic loading event of 2002 March 21
For a broader comparison of force components determined from panel measurements and tilt measurements during dynamic loading, Figures 9 and 10 present the X and Y components, respectively for a 500-second record length. Note that the X component of tilt-derived force has been offset downwards by 2000 kN to bring the “zero” values into closer agreement. For both the X component of force and Y component of force, the magnitude determined from tilt measurements is greater that those measured from the panels. The X component of tilt derived force is about 50% greater than the panel force component, and it can be seen that trends of increasing and decreasing force correspond remarkably well for the two measurement instruments. The reason for higher tilt derived X component forces is that for ice motions from the northeast, part of the lighthouse perimeter exposed to ice motion is not covered by panels, and hence the panes are missing part of the ice force. The Y component forces for the two measurement methods are more similar, there being a slight offset between the two measurement methods and in this case the tilt-derived forces being about 25 % greater than the panel forces. This difference, in this case, could be due to some of the Y component of ice forces acting above and below the panels (panel height 1.6 m and up to 3 m thick ice/ridges). The total ice thickness for this event was reported to be in the range 2.3 to 3 m.
0 1000 2000 3000 4000 5000 6000 7000 400 450 500 550 600 650 700 750 800 850 900 TIME (s) F O RCE (kN ) Fx panels Fx tilt filtered Fx tilt Fx panels
Figure 9 Comparison of force components in the X-direction for event of 2002 March 21 0 1000 2000 3000 4000 5000 400 450 500 550 600 650 700 750 800 850 900 TIME (s) FORCE (kN ) Fy panels Fy tilt filtered Fy tilt Fypanels
Figure 10 Comparison of force components in the Y-direction for event of 2002 March 21
CONCLUSIONS
The application of the tiltmeter at the Norströmsgrund Lighthouse provided a very useful complement to the load panel measurements since the panel results were used
to calibrate the tiltmeter-lighthouse system, and the tiltmeter responded to ice movements from directions in which the panels were not able to respond to ice loading. Use of a calibration factor of 12 kN/µradian to relate Y-axis tilts to the Y component of force, and -12 kN/µradian to relate X-axis tilts to the X component of force is appropriate for the Norströmsgrund Lighthouse. Due to confidentiality constraints a total season record was not available for publication, however periods of open water could be used to verify and readjust the “zero” readings of the tiltmeters to obtain an improved comparison between the two measurement methods..
In terms of frequency response, the tiltmeter gives good response for frequency components from DC up to about 0.5 Hz. Higher frequency components of the tilt measurements can be “filtered” using a moving average spanning 7 s. When this is done the forces determined from tilt are a good indication of loading variations occurring over time intervals of more than several seconds. However, short-term force peaks lasting less that about 1 to 2 s are artefacts of the tiltmeter, and should be ignored. With calibration of the tiltmeter-structure system a tiltmeter provides an economical and simple means of measuring the global ice forces on a lighthouse or bridge pier.
ACKNOWLEDGEMENTS
The financial assistance of the Canadian Government Program of Energy Research and Development Ice-Structure Interaction Activity in supporting the author’s participation during the 2002 STRICE field program is gratefully acknowledged. Also the opportunity provided by the STRICE project to install the tiltmeter in parallel with many other measurement instruments is very much appreciated. Finally the support of STRICE participants in the field and Peter Jochmann in particular made the successful collection of tiltmeter data possible.
REFERENCES
Brown, T.G., 2001, Four Years of Ice Force observation on the Confederation Bridge,
Proceeding of the 16th International Conference on Port and Ocean Polar
Engineering under Arctic Conditions, Ottawa, Ontario, August 12-17, Vol. 1, pp.
285-298.
Cheung, M.S., Tadros, G.S., Brown, T., Dilger, W.H., Ghali, A. and Lau, D.T., 1997, Field Monitoring and Research on Performance of the Confederation Bridge,
Canadian Journal of Civil Engineering, Vol. 24: pp. 951-962.
Kubat, I., Frederking, R. and Hayakawa, T. 2000, Response of the Confederation Bridge to Ice Action. Proceedings 2000 Annual Conference of the Canadian Society
for Civil Engineering Proceedings CSCE’00, Vol. S, pp 434-441, London, Ont.