HAL Id: hal-00301411
https://hal.archives-ouvertes.fr/hal-00301411
Submitted on 6 Sep 2004HAL is a multi-disciplinary open access
archive for the deposit and dissemination of sci-entific research documents, whether they are pub-lished or not. The documents may come from teaching and research institutions in France or abroad, or from public or private research centers.
L’archive ouverte pluridisciplinaire HAL, est destinée au dépôt et à la diffusion de documents scientifiques de niveau recherche, publiés ou non, émanant des établissements d’enseignement et de recherche français ou étrangers, des laboratoires publics ou privés.
Increased Northern Hemispheric carbon monoxide
burden in the troposphere in 2002 and 2003 detected
from the ground and from space
L. N. Yurganov, P. Duchatelet, A. V. Dzhola, D. P. Edwards, F. Hase, I.
Kramer, E. Mahieu, J. Mellqvist, J. Notholt, P. C. Novelli, et al.
To cite this version:
L. N. Yurganov, P. Duchatelet, A. V. Dzhola, D. P. Edwards, F. Hase, et al.. Increased Northern Hemispheric carbon monoxide burden in the troposphere in 2002 and 2003 detected from the ground and from space. Atmospheric Chemistry and Physics Discussions, European Geosciences Union, 2004, 4 (5), pp.4999-5017. �hal-00301411�
ACPD
4, 4999–5017, 2004 Increased Northern Hemispheric carbon monoxide L. N. Yurganov et al. Title Page Abstract Introduction Conclusions References Tables Figures J I J I Back Close Full Screen / EscPrint Version
Interactive Discussion
© EGU 2004
Atmos. Chem. Phys. Discuss., 4, 4999–5017, 2004 www.atmos-chem-phys.org/acpd/4/4999/
SRef-ID: 1680-7375/acpd/2004-4-4999 © European Geosciences Union 2004
Atmospheric Chemistry and Physics Discussions
Increased Northern Hemispheric carbon
monoxide burden in the troposphere in
2002 and 2003 detected from the ground
and from space
L. N. Yurganov1, P. Duchatelet2, A. V. Dzhola3, D. P. Edwards4, F. Hase5,
I. Kramer5, E. Mahieu2, J. Mellqvist6, J. Notholt7, P. C. Novelli8, A. Rockmann9, H. E. Scheel9, M. Schneider5, A. Schulz10, A. Strandberg6, R. Sussmann9, H. Tanimoto11, V. Velazco7, J. R. Drummond12, and J. C. Gille4
1
Frontier Research Center for Global Change, JAMSTEC, Yokohama, Japan
2
Institute of Astrophysics and Geophysics, University of Li `ege, Li `ege, Belgium
3
Obukhov Institute of Atmospheric Physics, Moscow, Russia
4
Atmospheric Chemistry Division, National Center for Atmospheric Research, Boulder, CO, USA
5
IMK-ISF, Forschungszentrum Karlsruhe, Karlsruhe, Germany
6
Radio and Space Science, Chalmers University of Technology, G ¨oteborg, Sweden
7
University of Bremen, Bremen, Germany
8
ACPD
4, 4999–5017, 2004 Increased Northern Hemispheric carbon monoxide L. N. Yurganov et al. Title Page Abstract Introduction Conclusions References Tables Figures J I J I Back Close Full Screen / EscPrint Version
Interactive Discussion
© EGU 2004
9
IMK-IFU, Forschungszentrum Karlsruhe, Garmisch-Partenkirchen, Germany
10
Alfred-Wegener-Institute, Potsdam, Germany
11
National Institute for Environmental Studies, Tsukuba, Japan
12
University of Toronto, Toronto, Canada
Received: 4 June 2004 – Accepted: 27 July 2004 – Published: 6 September 2004 Correspondence to: L. N. Yurganov ([email protected])
ACPD
4, 4999–5017, 2004 Increased Northern Hemispheric carbon monoxide L. N. Yurganov et al. Title Page Abstract Introduction Conclusions References Tables Figures J I J I Back Close Full Screen / EscPrint Version
Interactive Discussion
© EGU 2004
Abstract
Carbon monoxide total column amounts in the atmosphere have been measured in the High Northern Hemisphere (30◦–90◦N, HNH) between January 2002 and December 2003, based on the analysis of infrared solar spectra recorded with spectrometers of high and moderate resolution. They are compared to ground-level CO mixing ratios 5
and to total column amounts measured from space by the Terra/MOPITT instrument. In comparison to the unperturbed 2000–2001 period, all these databases reveal in-creased CO abundances in 2002–2003 summer-autumn times, with maximum anoma-lies observed in September 2002 and August 2003. Using a simple two-box model, the corresponding annual CO emission anomalies have been found equal to 98 Tg in 2002 10
and 142 Tg in 2003, thus close to those for 1996 and 1998. It is most likely that strong boreal forest fires in the HNH induced the increased CO burdens.
1. Introduction
The importance of biomass burning for atmospheric composition, including the concen-trations of greenhouse gases on global and hemispheric scales, is widely recognized 15
(Andreae and Merlet, 2001; Galanter et al., 2000 and references therein). Accord-ing to Holloway et al. (2000), durAccord-ing a normal year (i.e. without catastrophic wildfires) biomass burning contributes 748 Tg CO/year globally (including 68 Tg CO/year emitted by extratropical forest fires, Andreae and Merlet, 2001). This is much larger than the global contribution from the combustion of fossil fuel (300 Tg/year) and is comparable 20
to contributions from biogenic hydrocarbons (683 Tg/year) or from methane oxidation (760 Tg/year). The CO emission from HNH boreal forest fires experiences significant interannual variations (Wotawa et al., 2001).
In a recent paper (Yurganov et al., 2004), the CO tropospheric burden anomaly in the High Northern Hemisphere (HNH) between 1996 and 2001 was determined from total 25
ACPD
4, 4999–5017, 2004 Increased Northern Hemispheric carbon monoxide L. N. Yurganov et al. Title Page Abstract Introduction Conclusions References Tables Figures J I J I Back Close Full Screen / EscPrint Version
Interactive Discussion
© EGU 2004
2003). Using a simple box model, the 1998 CO emission anomaly (in comparison to the period 1996–2001, without 1998) was estimated at 38 Tg/month in August and 96±29 Tg for 1998, close to the inventory calculated by Kasischke et al. (submitted)1 but higher than most other estimates. The upper limit of the error due to possible changes in CO sinks was estimated at ±20%.
5
This paper presents updated results of surface-based measurements of CO bur-dens supplemented by new satellite data (Edwards et al., 2004). The CO burbur-dens in summer-autumn of 2002 and 2003 were found to be higher than in 2000 and 2001, and the corresponding CO emission anomalies have been estimated in a way similar to that used by Yurganov et al. (2004).
10
2. Observational stations and methods
In this work we present CO total column amounts derived from infrared solar obser-vations performed between January 2002 and December 2003 with Fourier transform spectrometers (FTIR) operated at seven stations located in the Arctic, Scandinavia, Western Russia, the European Alps, and the subtropical Atlantic (Table 1). The high 15
resolution spectra (better than 0.005 cm−1) were fitted with calculated spectra, and CO vertical profiles were retrieved. However, only total column amounts have been used in this paper. The spectra recorded by a Russian home-made grating spectrometer with a resolution of 0.2 cm−1just allowed determination of total column amounts of CO (Yurganov et al., 2002). Rinsland et al. (1998) estimated the random and systematic 20
error of a single total column measurement of CO as ±2–3% and ±5%, respectively. Details of retrieval procedures can be found in Hase et al. (2004) and Yurganov et al. (2004). These data (as well as others, see below) were used for a calculation of the CO burden in the reservoir 30◦N–90◦N between 0 and 10 km altitude.
1
Kasischke, et al., “Influences of boreal fire emissions on Northern Hemisphere atmospheric carbon and carbon monoxide”, Global Biogeochem. Cycles, submitted, 2004.
ACPD
4, 4999–5017, 2004 Increased Northern Hemispheric carbon monoxide L. N. Yurganov et al. Title Page Abstract Introduction Conclusions References Tables Figures J I J I Back Close Full Screen / EscPrint Version
Interactive Discussion
© EGU 2004
Air samples collected in the surface atmospheric layer by the NOAA/CMDL Coopera-tive Air Sampling Network and by other programs (Table 2) were analyzed for local CO concentrations. Most of these measurements (which are accessible at the WDCGG archive, WMO, 2004) were made by gas chromatography/HgO reduction detection us-ing instruments from Trace Analytical, Inc. (Novelli et al., 2003). At some stations, 5
CO mixing ratios were measured continuously using non-dispersive gas correlation IR instruments (WMO, 2004).
The satellite-borne MOPITT (Measurements Of Pollution In The Troposphere) in-strument is a thermal IR nadir-viewing gas correlation radiometer described in detail by Drummond (1992) and Deeter et al. (2003). MOPITT uses a cross-track scan, 10
which allows for almost complete coverage of the Earth’s surface in about 3 days, with individual pixels of 22×22 km horizontal resolution.
3. Results and discussion
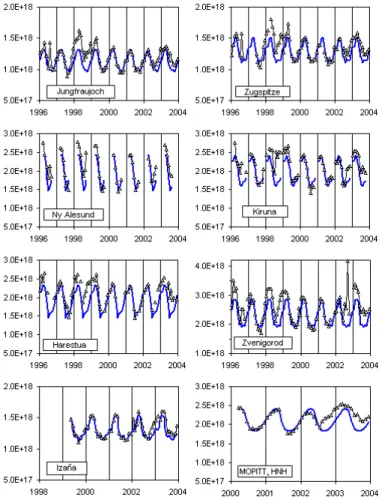
Monthly mean CO total column (TC) amounts above 7 sites are plotted in Fig. 1. Ny ˚
Alesund (Spitsbergen), Kiruna (Sweden), Harestua (Norway) and Zvenigorod (near 15
Moscow, Russia) are low altitude stations and the measured total column amounts represent concentrations integrated over the entire atmosphere, thus including the boundary layer (BL), the free troposphere (FT), and the stratosphere. Total columns measured at the Alpine mountain sites Zugspitze, Jungfraujoch, and Iza ˜na (Canary Isles) are CO amounts integrated between the altitude of the station and the top of the 20
atmosphere. Monthly mean values in Fig. 1 (triangles) may be compared to values av-eraged over the reference period between March 2000 and February 2002 (heavy blue lines). These raw data clearly indicate higher than normal CO total columns during summer-autumn periods of 2002 and 2003 at all sites. A similar effect can be found in the MOPITT data also presented in Fig. 1.
25
Record high CO column amounts were measured at Zvenigorod in summer-autumn time 2002 with a maximum in September. According to the International Forest Fire
ACPD
4, 4999–5017, 2004 Increased Northern Hemispheric carbon monoxide L. N. Yurganov et al. Title Page Abstract Introduction Conclusions References Tables Figures J I J I Back Close Full Screen / EscPrint Version
Interactive Discussion
© EGU 2004
News (IFFN, 2003), there was smoke pollution from peat and forest fires in the region around Moscow between July and September, 2002. This caused a dramatic reduction in visibility, to less than 100 m in the city, and also had detrimental impacts on the health of the Muscovite population. The fires reached a peak on 6 September. The observed CO spikes (up to 7.3 E18 molecules/cm2on 10 September 2002) reflected intrusions of 5
this polluted air (there were no visible fires around the station itself). The horizontal ex-tent of the highly polluted area remains uncertain and in this paper the days with these spikes were omitted. There were nine days in July–September, 2002 with CO columns that exceeded the summer time 2002 lowest daily value (2.02 E18 molecules/cm2) by more than 4 standard deviations, i.e. above 2.9 E18 molecules/cm2. Specifically, there 10
were 1 (12), 1 (6), and 7 (10) such days in July, August, and September, respectively (numbers in brackets indicate the total observational days for each month).
The relative anomalies in CO abundance (monthly means divided by the values mea-sured during the reference period) are plotted in Fig. 2. The anomalies in CO total columns for all data sets have two maxima, in September-October, 2002, and in July-15
August, 2003. The CO anomalies at the southernmost station Iza ˜na (28◦N) are lower than for those at other sites. This supports the assumption that northern mid-latitude wildfires play a decisive role in the anomaly in hemispheric CO burdens (c.f. Yurganov et al., 2004 conclusion for 1998).
The total column anomaly measured by the MOPITT and integrated over the HNH, 20
has a similar temporal shape (Fig. 2). Edwards et al. (1994) analyzed the MOPITT data in conjunction with simultaneously measured aerosol optical depths (AOD) from the Moderate-resolution Imaging Spectroradiometer (MODIS). Fire counts from MODIS allowed estimating locations of fires. In September 2002 enhanced CO and AOD were observed over the European part of Russia. In 2003 forest fires started burning in May 25
and were most intense in Siberia.
The boundary layer measurements at 16 stations located in the HNH (for coordi-nates see Table 2) are in general accordance with the total columns, but the maximum anomaly in 2002 is higher than that for the total column amounts (2003 data are still not
ACPD
4, 4999–5017, 2004 Increased Northern Hemispheric carbon monoxide L. N. Yurganov et al. Title Page Abstract Introduction Conclusions References Tables Figures J I J I Back Close Full Screen / EscPrint Version
Interactive Discussion
© EGU 2004
ready for publicizing). A similar effect was observed in 1998 (Yurganov et al., 2004); a surface location of the CO source may explain this difference.
We assume that the interannual variations of CO column amounts occur mainly in the troposphere. This assumption may be justified by the fact that about 90% of CO column amount in the NH resides below 12 km (Zhao et al., 2002). Moreover, the time 5
constant for the vertical exchange between troposphere and stratosphere is more than one year (Brasseur et al., 1999, p. 6).
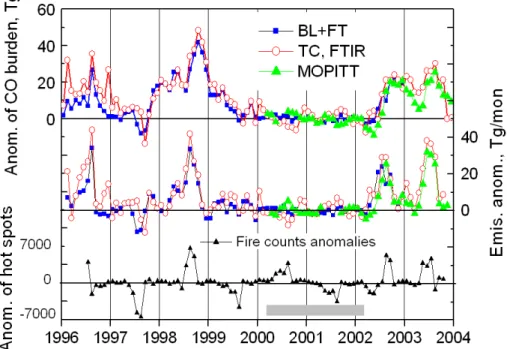
The anomalies in CO burden in the reservoir 30◦N–90◦N, 0–10 km were calculated using three data sets (Fig. 3, top panel and left scale). Firstly, the anomalies in CO total column amounts at four low altitude stations, Harestua, Kiruna, Zvenigorod, and 10
Ny ˚Alesund were averaged and multiplied by the surface area of the reservoir (open circles in Fig. 3). Secondly, the average anomalies in CO mixing ratios in the BL (avail-able until December 2002) were multiplied by the number of air molecules in the lowest 1.5 km layer of the chosen reservoir. The density-altitude stratification was taken from the 1976 US Standard Atmosphere. These CO burden anomalies were added to the 15
FT anomalies derived from in situ (5 mountain stations listed in Table 2 and indicated by∗) and column measurements at the Jungfraujoch and Zugspitze stations (rectan-gles in Fig. 3). The data from the Iza ˜na mountain station were not considered here, because the station is located outside the chosen reservoir. And thirdly, the CO bur-den anomalies for the same reservoir were calculated from the global MOPITT data 20
(full green triangles). All data have similar shapes and are very close in their absolute values.
A box model was used to estimate the monthly mean anomalies in the CO source in the HNH taking into account transport to the Low Northern Hemisphere (LNH, 0◦N– 30◦N, 0–10 km of altitude) and chemical removal.
25
P0HNH=dM0HNH/dt+L0trans+L0chem (1)
L0trans=(M0HNH−M0LNH)/TAUtrans (2)
ACPD
4, 4999–5017, 2004 Increased Northern Hemispheric carbon monoxide L. N. Yurganov et al. Title Page Abstract Introduction Conclusions References Tables Figures J I J I Back Close Full Screen / EscPrint Version
Interactive Discussion
© EGU 2004
TAUchem=1/k [OH] (4)
k=1.5∗E−3(1+0.6∗p) cm3mol−1s−1 (Demore et al., 1997), (5) where PHNH is the CO emission rate (in Tg/month), MHNH, and MLNH are CO tropo-spheric burdens in the HNH and LNH reservoirs (in Tg); dMHNH/d t is the change in the tropospheric CO burden during the month, Ltrans and Lchem are loss terms due to 5
the transport between the semi-hemispheres and OH-consumption, respectively; p is air pressure in atm; the prime (0) designates the anomaly, i.e. the deviation from the average over the reference period between March 2000 and February 2002.
The interannual variations of the sink processes (in other words, TAU’chem and TAU0trans) were neglected. TAUtranswas calculated using the GEOS-CHEM global 3D 10
CTM with assimilated 1998 meteorology (Bey et al., 2001; Yurganov et al., 2004). TAUchem was calculated using OH seasonal/latitudinal/altitudinal field, derived by Spi-vakovsky et al. (2000). Yurganov et al. (2004) estimated that halving [OH] leads to 22% lower values of P0in August.
Burden anomalies for LNH (M’LNH) were calculated from the surface measurements 15
by Novelli et al. (2003) (1996–1999), from the MOPITT measurements (2002–2003), and were taken as the average of the two in 2000 and 2001.
Estimates of the CO emission anomalies in the HNH using the three data sets de-scribed before are plotted on the middle panel of Fig. 3 (the reference period is indi-cated by the shaded area and is different from that used by Yurganov et al. (2004)). 20
Results presented in Figs. 1, 2, and 3 are given also in a tabular form in the Supplement (http://www.copernicus.org/EGU/acp/acpd/4/4999/acpd-4-4999-sp.pdf). All three data sets clearly reveal abnormally high CO emissions in 2002 and 2003. The monthly emission anomalies were summed annually and presented in Table 3. Since 1996 there have been four years with high CO emission of similar magnitude (1996, 1998, 25
2002, and 2003) and four years with low emission (1997, 1999, 2000, and 2001). Hot spots detected by the Along Track Scanning Radiometer (ATSR) may be used as an independent indicator of wildfires (Arino and Plummer, 2001). The bottom panel
ACPD
4, 4999–5017, 2004 Increased Northern Hemispheric carbon monoxide L. N. Yurganov et al. Title Page Abstract Introduction Conclusions References Tables Figures J I J I Back Close Full Screen / EscPrint Version
Interactive Discussion
© EGU 2004
of Fig. 3 illustrates the interannual variations of total numbers of hot spots after July 1996. The monthly anomalies of hot spots were calculated similarly to CO anomalies. 2002 and 2003 were characterized by positive anomalies of hot spots with maxima in August, 2002 and May–July, 2003. Positive anomalies of hot spots were observed also in 1996 and 1998. However, a positive anomaly in 2000 and negative anomalies of 5
1999 and 2001 disagree with anomalies of CO emissions during those years. This may be explained by varying nature of wildfires (e.g. contributions of low-temperature peat fires or high-temperature forest fires) and differences in CO emission factors between the years.
The average anomalies for all three data sets used were converted into absolute 10
emission assuming some “normal” emission seasonal cycle. 2000 biomass burning emission rates (50.7 Tg CO/year) calculated for the MOZART-2 CTM (Schultz and Granier, personal communication, 2003; Schultz, 2002; Olivier et al., 1996) were used as normal (Fig. 4). In 1996 and 1998 maximum emissions were observed in August. In 2002 emissions had a broad maximum in July–August. In 2003 the emissions in 15
August were also high, but lower than in June and July.
4. Conclusions
Spectroscopic measurements of carbon monoxide total column amounts from ground based stations in the Arctic and Europe reveal increased CO abundance in summer and autumn time of 2002 and 2003 in comparison with the previous two years. Similar 20
increases were observed in 1996 and 1998 (Yurganov et al., 2004). Increased CO con-centrations near the surface were also observed by the CMDL and GAW networks (16 stations) in summertime of 2002. Moreover, space-based MOPITT measurements with a full HNH coverage reveal a similar pattern in 2002 and 2003. An inversion of monthly burden anomalies into a source anomaly (assuming a stable sink) has been done using 25
a simple box model. The annual emission anomalies in 2002 and 2003 were similar in magnitude to those in 1996 and 1998, in the range 100–140 Tg CO/year. The
anoma-ACPD
4, 4999–5017, 2004 Increased Northern Hemispheric carbon monoxide L. N. Yurganov et al. Title Page Abstract Introduction Conclusions References Tables Figures J I J I Back Close Full Screen / EscPrint Version
Interactive Discussion
© EGU 2004
lies in the CO emission rates correlate well with anomalies of fire counts, detected by a satellite-based radiometer. It is most likely that strong wildfires are responsible for the hemispheric CO build up.
Acknowledgements. The authors thank colleagues and collaborators who participated actively
in the production and analysis of the data used in this work. Thanks are further extended to H.
5
Akimoto, T. Blumenstock, E. Grechko, and R. Zander for helpful discussions, to M. Schultz for the MOZART inventory and to O. Wild for English editing. The financial support was provided by the Bundesministerium f ¨ur Bildung und Forschung via the DLR by contracts 50EE0008 and 50EE0203, by German BMBF, by EU within the UFTIR project (EVK2-2002-00159) and within SOGE, by the Russian RFBR grant number 02-05-64148, by Belgian (OSTC) grants, and by the
10
Swedish National Space Board. Fire counts are taken from ATSR World Fire Atlas, European Space Agency, ESA/ESRIN, via Galileo Galilei, CP 64, 00044 Frascati, Italy
(http://shark1.esrin.esa.it/ionia/FIRE/AF/ATSR/).
References
Andreae, M. O. and Merlet, P.: Emissions of trace gases and aerosols from biomass burning,
15
Glob. Biogeochem. Cycles, 15, 955–966, 2001.
Arino, O. and Plummer, S. (Eds.): Along Track Scanning Radiometer World Fire Atlas: Valida-tion of the 1997–1998 Active Fire Product, ESA-ESRIN, Italy, 2001.
Brasseur, G., Orlando, J., and Tyndall, G. (Eds.): Atmospheric Chemistry and Global Change, New York: Oxford University Press, 1999.
20
Bey, I., Jacob, D. J., Yantosca, R. M., Logan, J. A., Field, B. D., Fiore, A. M., Li, Q., Liu, H., Mickley, L. J., and Schultz, M.: Global modeling of tropospheric chemistry with assimi-lated meteorology: Model description and evaluation, J. Geophys. Res., 106, 23 073–23 095, 2001.
Deeter, M. N., Emmons, L. K., Francis, G. L. et al.: Operational carbon monoxide retrieval
25
algorithm and selected results for the MOPITT instrument J. Geophys. Res., 108, 4399, doi:10.1029/2002JD003186, 2003.
ACPD
4, 4999–5017, 2004 Increased Northern Hemispheric carbon monoxide L. N. Yurganov et al. Title Page Abstract Introduction Conclusions References Tables Figures J I J I Back Close Full Screen / EscPrint Version
Interactive Discussion
© EGU 2004
Ravishankara, A. R., Kolb, C. E., and Molina, M. J.: Chemical kinetics and photochemical data for use in stratospheric modeling, JPL Publ., 97-4, 1997.
Drummond, J. R.: Measurements of Pollution in the Troposphere (MOPITT), in The Use of EOS for Studies of Atmospheric Physics, edited by Gille, J. C. and Visconti, G., North-Holland, NY, 77–101, 1992.
5
Edwards, D. P , Emmons, L. K., Hauglustaine, D. A., Chu, A., Gille, J. C., Kaufman, Y. J., Petron, G., Yurganov, L. N., Giglio, L., Deeter, M. N., Yudin, V., Ziskin, D. C., Warner, J., Lamarque, D. F., Francis, G. L., Ho, S. P., Mao, D., Chen, J., Grechko, E. I., and Drummond, J. R.: Observations of carbon monoxide and aerosols from the Terra satellite: Northern Hemisphere variability , J. Geophys. Res., 109, 2004JD004727, accepted, 2004.
10
Galanter, M., Levy, H., and Carmichael, G. R.: Impacts of biomass burning on tropospheric CO, NOx, and O3, J. Geophys. Res., 105, 6633–6653, 2000.
Hase, F., Hannigan, J. W., Coffey, M. T., Goldman, A., H¨opfner, M., Jones, N. B., Rinsland, C. P., and Wood, S. W.: Intercomparison of retrieval codes used for the analysis of high-resolution, ground-based FTIR measurements, J. Quant. Spectrosc. Radiat. Transfer, 87, 1,
15
25–52, 2004.
Holloway, T., Levy II, H., and Kasibhatla, P.: Global distribution of carbon monoxide, J. Geophys. Res., 105, 12 123–12 147, 2000.
IFFN: Russian Federation 2002 Fire Special, International Forest Fire News, 28, Parts I–IV, 2–32, 2003.
20
Novelli, P. C., Masarie, K. A., Lang, P. M., Hall, B. D., Myers, R. C., and Elkins, J. W.: Reanalysis of tropospheric CO trends: Effects of the 1997–1998 wildfires, J. Geophys. Res., 108, D15, 4464, doi:10.1029/2002JD003031, 2003.
Olivier, J., Bouwman, A., van der Maas, C., Berdowski, J., Veldt, C., Bloos, J., Visschedijk, A., Zandveld, P., and Haverlag, J.: Description of EDGAR Version 2.0: A set of global emission
25
inventories of greenhouse gases and ozone-depleting substances for all anthropogenic and most natural sources on a per country basis and on 1×1 grid, Tech. Rep. 771060 002, RIVM, TNO-MEP, 1996.
Rinsland, C. P., Jones, N. B., Connor, B. J. et al.: Northern and Southern Hemisphere ground-based infrared spectroscopic measurements of tropospheric carbon monoxide and ethane,
30
J. Geophys. Res., 103, 28 197–28 217, 1998.
Schultz, M. G.: On the use of ATSR fire count data to estimate the seasonal and interannual variability of vegetation fire emissions, Atmos. Chem. Phys., 2, 387–395, 2002.
ACPD
4, 4999–5017, 2004 Increased Northern Hemispheric carbon monoxide L. N. Yurganov et al. Title Page Abstract Introduction Conclusions References Tables Figures J I J I Back Close Full Screen / EscPrint Version
Interactive Discussion
© EGU 2004
Spivakovsky, C. M., Logan, J. A., Montzka, S. A. et al.: Three-dimensional climatological dis-tribution of tropospheric OH: Update and evaluation, J. Geophys. Res., 105, 8931–8980, 2000.
WMO WDCGG Data Summary: WDCGG No. 28, GAW data, Volume IV – Greenhouse Gases and Other Atmospheric Gases, Published by Japan Meteorological Agency in cooperation
5
with World Meteorological Organization, March, 2004.
Wotawa, G., Novelli, P. C., Trainer, M., and Granier, C.: Interannual variability of summertime CO concentrations in the Northern Hemisphere explained by boreal forest fires in North America and Russia, Geophys. Res. Lett., 24, 4575–4578, 2001.
Yurganov, L. N., Grechko, E. I., and Dzola, A. V.: Long-term measurements of carbon monoxide
10
over Russia using a spectrometer of medium resolution, Recent Res. Devel. Geophysics, 4, 249–265, ISBN 81-7736-076-0, 2002.
Yurganov, L. N., Blumenstock, T., Grechko, E. I., Hase, F., Hyer, E. J., Kasischke, E. S., Koike, M., Kondo, Y., Kramer, I., Leung, F.-Y., Mahieu, E., Mellqvist, J., Notholt, J., Novelli, P. C., Rinsland, C. P., Scheel, H.-E., Schulz, A., Strandberg, A., Sussmann, R., Tanimoto, H.,
Ve-15
lazco, V., Zander, R., and Zhao, Y.: A quantitative assessment of the 1998 carbon monoxide emission anomaly in the northern hemisphere based on total column and surface concen-tration measurements, J. Geophys. Res., 109, D15, D15305, doi:10.1029/2004JD004559, 2004.
Zhao, Y., Strong,, K., Kondo, Y., et al.: Spectroscopic Measurements of Tropospheric CO,
20
C2H6, C2H2, and HCN in Northern Japan 2002, J. Geophys. Res., 107, D18, 4343, doi:10.1029/2001JD000748, 2002.
ACPD
4, 4999–5017, 2004 Increased Northern Hemispheric carbon monoxide L. N. Yurganov et al. Title Page Abstract Introduction Conclusions References Tables Figures J I J I Back Close Full Screen / EscPrint Version
Interactive Discussion
© EGU 2004
Table 1. Sites of total column measurements and characteristics of spectrometers.
Site Coordinates Altitude, Type of spectrometer Typical resolution, Typical number of
m a.s.l. cm−1 spectra per day
Ny ˚Alesund,
Spitsbergen 78.92◦N 11.94◦E 20 Bruker IFS 120 HR 0.005 2–3 Kiruna,
Sweden 67.84◦N 20.41◦E 419 Bruker IFS 120 HR 0.005 2–3 Harestua,
Norway 60.22◦N 10.75◦E 596 Bruker IFS 120 M 0.005 12±6 Zvenigorod,
Russia 55.70◦N 36.80◦E 200 Grating, home-made 0.18–0.23 17±6 Zugspitze,
German Alps 47.42◦N 10.98◦E 2964 Bruker IFS 120 HR 0.0045 8±4 Jungfraujoch,
Swiss Alps 46.55◦N 8.00◦E 3580 Bruker IFS 120 HR 0.0028 and 0.0044 6 Iza ˜na,
ACPD
4, 4999–5017, 2004 Increased Northern Hemispheric carbon monoxide L. N. Yurganov et al. Title Page Abstract Introduction Conclusions References Tables Figures J I J I Back Close Full Screen / EscPrint Version
Interactive Discussion
© EGU 2004
Table 2. Surface CO monitoring locations.
Name Agency Latitude Longitude Altitude, m
Alert, Nunavut, Canada CMDL 82.45 −62.50 210
Ny- ˚Alesund, Spitsbergen, Norway CMDL 78.90 11.88 475
Barrow, Alaska, USA CMDL 71.32 −156.60 11
“M” Ocean Station, Norway CMDL 66.00 2.00 7
Heimaey, Vestmannaeyjar, Iceland CMDL 63.25 −20.15 100
Shetland Island, UK CSIRO 60.17 −1.17 30
Cold Bay, Alaska, USA CMDL 55.20 −162.72 25
Mace Head, Galway, Ireland CMDL 53.33 −9.90 25
Shemya Isl. Alaska, USA CMDL 52.72 174.10 40
Vancouver, Estevan Pt., Canada CSIRO 49.38 −126.54 39
Zugspitze, Germany (*) IMK-IFU 47.42 10.98 2964
Jungfraujoch, Switzerland (*) EMPA 46.55 7.98 3578
Park Falls, Wisconsin, USA CMDL 45.93 −90.27 868
Rishiri Isl, Japan NIES 45.07 141.12 35
Sary Taukum, Kazakhstan CMDL 44.45 77.57 412
Kaz mount, Plateau Assy, Kazakhstan (*) CMDL 43.25 77.88 2519 Niwot Ridge, Colorado, USA (*) CMDL 40.05 −105.58 3475
Wendover, Utah, USA (*) CMDL 39.90 −113.43 1320
Ryori, Japan JMA 39.03 141.83 230
Azores, Terceira Island, Portugal CMDL 38.77 −27.38 40
St. Davids, Bermuda, UK CMDL 32.37 −64.65 30
Notes: 1) (*) indicate mountain stations.
2) Monitoring agencies: CMDL= Climate monitoring and Diagnostics Laboratory, Boulder, Col-orado, USA; CSIRO= Commonwealth Science and Industry Research Organization, Canberra, Austaralia; JMA= Japan Meteorological Agency, Tokyo, Japan; NIES = National Institute of Environmental Studies, Tsukuba, Japan; IMK-IFU= IMK-IFU, Forschungszentrum Karlsruhe, Garmisch-Partenkirchen, Germany; EMPA= Swiss Federal Laboratories for Materials Testing and Research, St. Gallen, Switzerland.
ACPD
4, 4999–5017, 2004 Increased Northern Hemispheric carbon monoxide L. N. Yurganov et al. Title Page Abstract Introduction Conclusions References Tables Figures J I J I Back Close Full Screen / EscPrint Version
Interactive Discussion
© EGU 2004
Table 3. Annual CO emission anomalies in Tg CO/year for the HNH retrieved from the
low-altitude FTIR (P0(FTIR)); in situ BL, combined with mountain FTIR and in situ data (P0(BL+FT)); and satellite measurements (P0(MOPITT)) using a box model. The average of the three esti-mates is also given.
Year P0(FTIR) P0(BL+FT) P0(MOPITT) Average Accuracy, Tg/yr
1996 166.6 80.8 123.7 40 1997 14.8 2.5 8.7 6 1998 149.2 121.3 135.2 20 1999 39.3 18.8 29.1 10 2000 −4.7 3.8 1.8 0.3 4 2001 9.7 −4.6 −0.9 1.4 7 2002 120.5 99.4 73.5 97.8 30 2003 165.3 118.0 141.6 30
ACPD
4, 4999–5017, 2004 Increased Northern Hemispheric carbon monoxide L. N. Yurganov et al. Title Page Abstract Introduction Conclusions References Tables Figures J I J I Back Close Full Screen / EscPrint Version
Interactive Discussion
© EGU 2004
Figure 1. Monthly mean column amounts (triangles; in molecules/cm2) of carbon
monoxide above various sites. Heavy blue lines correspond to the monthly means, averaged over the period between March, 2000, and February, 2002.
Fig. 1. Monthly mean column amounts (triangles; in molecules/cm2) of carbon monoxide above various sites. Heavy blue lines correspond to the monthly means, averaged over the period between March, 2000, and February, 2002.
ACPD
4, 4999–5017, 2004 Increased Northern Hemispheric carbon monoxide L. N. Yurganov et al. Title Page Abstract Introduction Conclusions References Tables Figures J I J I Back Close Full Screen / EscPrint Version
Interactive Discussion
© EGU 2004
19
Figure 2. Anomalies of CO total column amounts and surface mixing ratios
(measured monthly means divided by the averages over the period between March 2000 and February 2002, grey rectangle). MOPITT data are averaged over the HNH, mean BL is the average over the data of 16 low-level stations with standard deviations. Extreme daily values exceeding 2.9 E18 molecules cm-2 in Zvenigorod in July – August, 2002, were omitted (see text).
Fig. 2. Anomalies of CO total column amounts and surface mixing ratios (measured monthly
means divided by the averages over the period between March 2000 and February 2002, grey rectangle). MOPITT data are averaged over the HNH, mean BL is the average over the data of 16 low-level stations with standard deviations. Extreme daily values exceeding 2.9 E18 molecules cm−2in Zvenigorod in July–August, 2002, were omitted (see text).
ACPD
4, 4999–5017, 2004 Increased Northern Hemispheric carbon monoxide L. N. Yurganov et al. Title Page Abstract Introduction Conclusions References Tables Figures J I J I Back Close Full Screen / EscPrint Version
Interactive Discussion
© EGU 2004
20
Figure 3. Top panel and left axis. Deviations of CO burden (Tg CO) in the HNH
from “normal” values averaged over the period indicated by the grey rectangle. “TC, FTIR” curve represents the average anomaly measured at four low altitude stations. “BL+FT” curve corresponds to the BL network (sixteen stations) for lower 1.5 km, the in situ data of six mountain stations, and two Alpine FTIR (until December, 2002). “MOPITT” curve is the anomaly of CO total column amounts measured by MOPITT and integrated over the HNH.
Middle panel and right axis. Anomalies of CO emission rates (Tg CO/year) in the HNH derived from three data sets for CO burden (top panel), using the box model (see text).
Bottom panel and left axis. Anomalies of monthly ATSR fire-counts integrated over HNH.
Fig. 3. Top panel and left axis. Deviations of CO burden in the HNH from “normal” values
averaged over the period indicated by the grey rectangle. “TC, FTIR” curve represents the average anomaly measured at four low altitude stations. “BL+FT” curve corresponds to the BL network (sixteen stations) for lower 1.5 km, the in situ data of six mountain stations, and two Alpine FTIR (until December, 2002). “MOPITT” curve is the anomaly of CO total column amounts measured by MOPITT and integrated over the HNH. Middle panel and right axis. Anomalies of CO emission rates in the HNH derived from three data sets for CO burden (top panel), using the box model (see text). Bottom panel and left axis. Anomalies of monthly ATSR fire-counts integrated over HNH.
ACPD
4, 4999–5017, 2004 Increased Northern Hemispheric carbon monoxide L. N. Yurganov et al. Title Page Abstract Introduction Conclusions References Tables Figures J I J I Back Close Full Screen / EscPrint Version
Interactive Discussion
© EGU 2004
21
Figure 4. Seasonal variations of CO emission from the biomass burning in the
HNH calculated from a top-down estimate of the anomaly (Figure 3) plus the normal seasonal cycle (MOZART inventory for 2000). Error bars (shown for 2003, but valid for other years) correspond to 30% accuracy [Yurganov et al., 2004].
Fig. 4. Seasonal variations of CO emission from the biomass burning in the HNH calculated
from a top-down estimate of the anomaly (Fig. 3) plus the normal seasonal cycle (MOZART-2 inventory for 2000). Error bars correspond to 30% accuracy (Yurganov et al., 2004).