HAL Id: hal-00295622
https://hal.archives-ouvertes.fr/hal-00295622
Submitted on 21 Feb 2005
HAL is a multi-disciplinary open access
archive for the deposit and dissemination of
sci-entific research documents, whether they are
pub-lished or not. The documents may come from
teaching and research institutions in France or
abroad, or from public or private research centers.
L’archive ouverte pluridisciplinaire HAL, est
destinée au dépôt et à la diffusion de documents
scientifiques de niveau recherche, publiés ou non,
émanant des établissements d’enseignement et de
recherche français ou étrangers, des laboratoires
publics ou privés.
burden in the troposphere in 2002 and 2003 detected
from the ground and from space
L. N. Yurganov, P. Duchatelet, A. V. Dzhola, D. P. Edwards, F. Hase, I.
Kramer, E. Mahieu, J. Mellqvist, J. Notholt, P. C. Novelli, et al.
To cite this version:
L. N. Yurganov, P. Duchatelet, A. V. Dzhola, D. P. Edwards, F. Hase, et al.. Increased Northern
Hemispheric carbon monoxide burden in the troposphere in 2002 and 2003 detected from the ground
and from space. Atmospheric Chemistry and Physics, European Geosciences Union, 2005, 5 (2),
pp.563-573. �hal-00295622�
L. N. Yurganov , P. Duchatelet , A. V. Dzhola , D. P. Edwards , F. Hase , I. Kramer , E. Mahieu , J. Mellqvist , J. Notholt7, P. C. Novelli8, A. Rockmann9, H. E. Scheel9, M. Schneider5, A. Schulz10, A. Strandberg6, R. Sussmann9, H. Tanimoto11, V. Velazco7, J. R. Drummond12, and J. C. Gille4
1Frontier Research Center for Global Change, JAMSTEC, Yokohama, Japan 2Institute of Astrophysics and Geophysics, University of Li`ege, Li`ege, Belgium 3Obukhov Institute of Atmospheric Physics, Moscow, Russia
4Atmospheric Chemistry Division, National Center for Atmospheric Research, Boulder, CO, USA 5IMK-ASF, Forschungszentrum Karlsruhe, Karlsruhe, Germany
6Radio and Space Science, Chalmers University of Technology, G¨oteborg, Sweden 7University of Bremen, Bremen, Germany
8Climate Monitoring and Diagnostic Laboratory, NOAA, Boulder, Colorado, USA 9IMK-IFU, Forschungszentrum Karlsruhe, Garmisch-Partenkirchen, Germany 10Alfred-Wegener-Institute, Potsdam, Germany
11National Institute for Environmental Studies, Tsukuba, Japan 12University of Toronto, Toronto, Canada
Received: 4 June 2004 – Published in Atmos. Chem. Phys. Discuss.: 6 September 2004 Revised: 26 November 2004 – Accepted: 15 February 2005 – Published: 21 February 2005
Abstract. Carbon monoxide total column amounts in the
atmosphere have been measured in the High Northern Hemi-sphere (30◦–90◦N, HNH) between January 2002 and De-cember 2003 using infrared spectrometers of high and mod-erate resolution and the Sun as a light source. They were compared to ground-level CO mixing ratios and to total col-umn amounts measured from space by the Terra/MOPITT instrument. All these data reveal increased CO abundances in 2002–2003 in comparison to the unperturbed 2000–2001 period. Maximum anomalies were observed in September 2002 and August 2003. Using a simple two-box model, the corresponding annual CO emission anomalies (referenced to 2000–2001 period) have been found equal to 95 Tg in 2002 and 130 Tg in 2003, thus close to those for 1996 and 1998. A good correlation with hot spots detected by a satellite ra-diometer allows one to assume strong boreal forest fires, oc-curred mainly in Russia, as a source of the increased CO bur-dens.
1 Introduction
The importance of biomass burning for atmospheric com-position, including the concentrations of greenhouse gases on global and hemispheric scales, is widely recognized (An-dreae and Merlet, 2001; Galanter et al., 2000 and references therein). Flannigan et al. (1998) proposed a possible pos-itive feedback between the emissions of greenhouse gases and wild forest fires. According to Holloway et al. (2000), during a normal year (i.e., without catastrophic wildfires) biomass burning contributes 748 Tg CO/year globally. An-dreae and Merlet (2001) estimated a contribution from extra-tropical forest fires to be 68 Tg CO per year. The IPCC report of 2001 (Ehhalt et al., 2001) considered all of the available information and adopted for global conditions 700 Tg CO per year as emitted by the biomass burning and 650 Tg CO per year due to combustion of fossil and domestic fuels. Petron et al. (2004) inverted the MOPITT (Measurements Of Pol-lution In The Troposphere) satellite measurements between April 2000 and March 2001 (i.e., during a period of rela-tively low fire activity in the Northern Hemisphere (NH), see Correspondence to: L. N. Yurganov
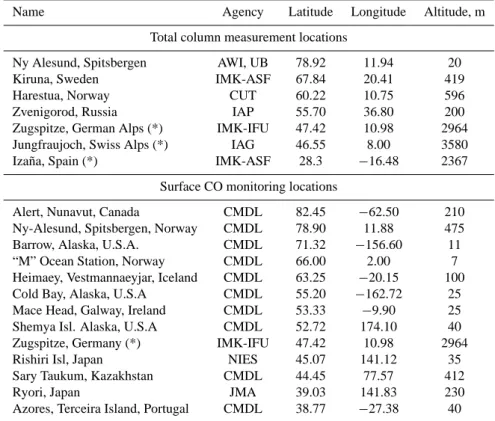
Table 1. CO monitoring locations.
Name Agency Latitude Longitude Altitude, m
Total column measurement locations
Ny Alesund, Spitsbergen AWI, UB 78.92 11.94 20
Kiruna, Sweden IMK-ASF 67.84 20.41 419
Harestua, Norway CUT 60.22 10.75 596
Zvenigorod, Russia IAP 55.70 36.80 200
Zugspitze, German Alps (*) IMK-IFU 47.42 10.98 2964 Jungfraujoch, Swiss Alps (*) IAG 46.55 8.00 3580 Iza˜na, Spain (*) IMK-ASF 28.3 −16.48 2367
Surface CO monitoring locations
Alert, Nunavut, Canada CMDL 82.45 −62.50 210 Ny-Alesund, Spitsbergen, Norway CMDL 78.90 11.88 475 Barrow, Alaska, U.S.A. CMDL 71.32 −156.60 11 “M” Ocean Station, Norway CMDL 66.00 2.00 7 Heimaey, Vestmannaeyjar, Iceland CMDL 63.25 −20.15 100 Cold Bay, Alaska, U.S.A CMDL 55.20 −162.72 25 Mace Head, Galway, Ireland CMDL 53.33 −9.90 25 Shemya Isl. Alaska, U.S.A CMDL 52.72 174.10 40 Zugspitze, Germany (*) IMK-IFU 47.42 10.98 2964
Rishiri Isl, Japan NIES 45.07 141.12 35
Sary Taukum, Kazakhstan CMDL 44.45 77.57 412
Ryori, Japan JMA 39.03 141.83 230
Azores, Terceira Island, Portugal CMDL 38.77 −27.38 40
Notes: 1) Asterisks indicate mountain stations, latitude and longitude are in degrees, negative longitude corresponds to West from Greenwich. 2) Monitoring agencies:
CMDL = Climate monitoring and Diagnostics Laboratory, Boulder, Colorado, USA CSIRO = Commonwealth Science and Industry Research Organization, Canberra, Austaralia JMA = Japan Meteorological Agency, Tokyo, Japan
NIES = National Institute of Environmental Studies, Tsukuba, Japan
IMK-IFU = IMK-IFU, Forschungszentrum Karlsruhe, Garmisch-Partenkirchen, Germany IMK-ASF = IMK-ASF, Forschungszentrum Karlsruhe, Karlsruhe, Germany
AWI = Alfred-Wegener-Institute, Potsdam, Germany UB = University of Bremen, Germany
CUT = Chalmers University of Technology, G¨oteborg, Sweden IAP = Institute of Atmospheric Physics, Moscow, Russia IAG = Institute of Astrophysics and Geophysics, Li`ege, Belgium
results of this paper). They derived 408 Tg CO per year from the vegetation fires and 683 Tg CO per year from fossil fuel and biofuel use combined. It is well known that the CO emis-sion from the mid and high latitude NH boreal forest fires experiences significant interannual variations (Wotawa et al., 2001). Kasischke et al. (2005) bottom-up calculations of CO amounts emitted by the biomass burning in the boreal areas in 2002 and 2003 were higher than those for the previous two years (i.e., 60–150 Tg per year versus 30–90 Tg per year in 2000–2001).These values may be compared to the indus-trial/transportation emission in the HNH estimated by Kasis-chke et al. (2005) for the period between 1998 and 2003 as high as 291 Tg CO per year.
In a recent paper (Yurganov et al., 2004) the CO tropo-spheric burden anomaly in the High Northern Hemisphere (HNH) between 1996 and 2001 was determined from total column spectrometric measurements combined with surface in situ data. Using a simple box model, the CO emission anomaly in 1998 in comparison to the period 1996–2001, without 1998, was estimated at 38 Tg/month in August and 96±29 Tg for the entire year of 1998. This result is in agree-ment with the emission anomaly calculated for 1998 by Ka-sischke et al. (2005): 45–113 Tg, but higher than most other bottom-up estimates referenced by Yurganov et al. (2004). The upper limit of the error due to possible changes in CO sinks was estimated at ±20%.
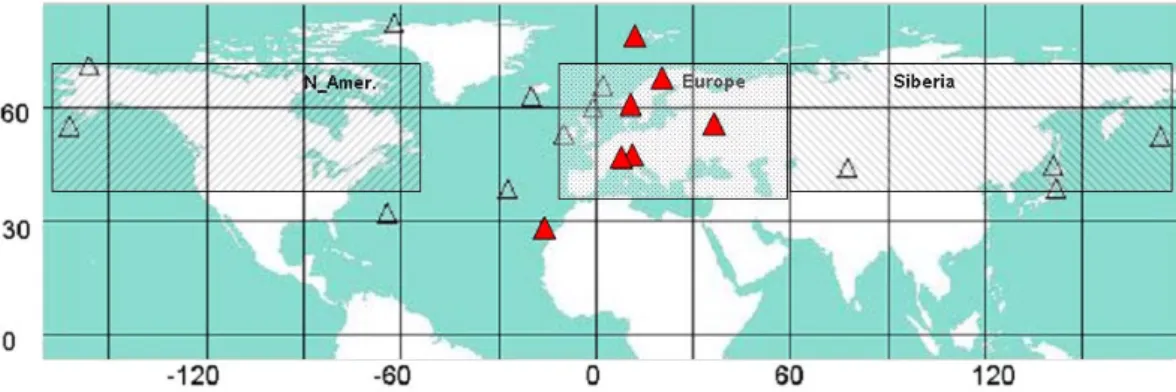
Fig. 1. Location of observation sites. Empty triangles are sites of in situ measurements in the boundary layer; red triangles designate locations of total column measurements. The shaded rectangles denote areas used in further analysis.
Jaffe et al. (2004) found an enhancement in June-July-August 2003 CO background surface concentrations of 23– 37 ppb at 10 sites in Alaska, Canada and Pacific Northwest and explained this by a transport from Siberia. Jaffe et al. (2004) calculated the CO emission from Siberian fires in 2003 to be 68 Tg CO using a bottom-up approach.
3-dimensional chemical transport models (CTM) are now widely used for forward and inverse modeling of CO sources (e.g., Arellano et al., 2004, Petron et al., 2004 and refer-ences therein). The CTM models allow studying specific sources and specific areas on the Globe. However, the mod-els are very complicated and simple box modmod-els applied to large reservoirs can be used as well. The CO burden (to-tal mass) in the HNH is regulated by the sources inside the semi-hemisphere and removal processes. The most impor-tant of the latter are i) the transport into the subtropics, where CO concentrations are usually lower (Novelli et al., 2003) and, ii) a reaction with OH that is responsible for 90% of the CO chemical sink (Holloway et al., 2000). The CO lifetime in the HNH due to these two sinks, (1.5–3 months and 1.4– 12 months, respectively, depending on the season (Yurganov et al., 2004)) makes mixing inside the reservoir very effec-tive in spite of an extremely inhomogeneous distribution of wild fires. This box-model study does not aim to retrieve the rates of regional CO sources, which would require a more sophisticated CTM and higher temporal resolution. On the contrary, a simple box model and a synthesis of all available data for the entire HNH allows one to retrieve the integrated imbalance of the burden of CO resulting from anomalies of the integrated source on a monthly basis.
This paper presents updated results of surface-based to-tal column and in-situ measurements of CO burdens supple-mented by new satellite data (Edwards et al., 2004). The CO burdens in summer-autumn of 2002 and 2003 were found to be higher than in 2000 and 2001, and the corresponding CO emission anomalies have been updated using a methodology similar to that used by Yurganov et al. (2004).
2 Observational stations and methods
In this work we present for the first time CO total column amounts derived from infrared solar absorption observations performed between January 2002 and December 2003 with Fourier transform spectrometers (FTIR) operated at stations located in the European Arctic, Scandinavia, Western Russia, the European Alps, and the subtropical Atlantic (Table 1 and Fig. 1). The high resolution spectra (better than 0.005 cm−1)
were fitted with calculated spectra, and CO vertical profiles were retrieved. Total column amounts derived from the pro-files have been used in this paper. Spectra recorded by a Rus-sian home-made grating spectrometer with a resolution of 0.2 cm−1just allowed determination of total column amounts
of CO (Yurganov et al., 2002). Rinsland et al. (1998) esti-mated the random and systematic error of a single total col-umn measurement of CO as ±2–3% and ±5%, respectively. Retrieval techniques are based on the same absolute spectro-scopic constants of absorption lines and do not need a cali-bration; different fitting algorithms applied to the same spec-tra agree within 1% (Hase et al., 2004). Details of retrieval procedures can be found in the papers by Hase et al. (2004), Yurganov et al. (2002), and Yurganov et al. (2004). Results of comparisons between grating and FTIR spectrometers in-stalled at Egbert, Ontario, Canada and at Lamont, Oklahoma, USA, were described by Yurganov et al. (2002); the maxi-mum systematic disagreement between the instruments with different spectral resolution amounted to 5%. Yurganov et al. (2002) also compared the grating spectrometer data in Zvenigorod, Russia with CO mixing ratios, measured using an aircraft between 0 and 6 km of altitude in the same area on 7 June 1995, 17 August 1995, and 25 March 1996. In spite of differences in locations up to 160 km, differences in the sam-pling time up to several hours, and a diurnal CO cycle of 10– 15% in magnitude, the results show a reasonable agreement between two different modes of measurements (differences between spectroscopic data and in situ data were from 0 to 8%). It should be noted also than an analysis of anomalies
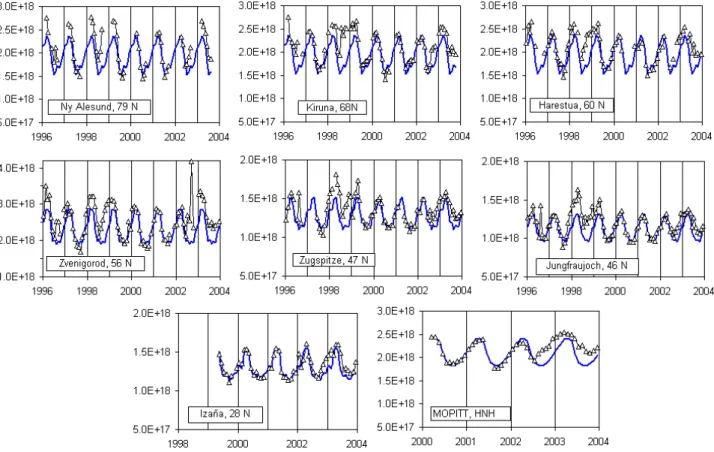
Fig. 2. Monthly mean total column amounts (triangles; in molecules/cm2)of carbon monoxide above various sites. The repeating every year solid blue lines (here and in Fig. 3) correspond to the monthly means, averaged over the period between March, 2000, and February, 2002.
(not the absolute values) employed in this paper allows one to minimize the influence of systematic errors introduced by retrieval techniques or differences due to geographic loca-tions. These data were used for a calculation of the anoma-lies of CO burden (total mass) in the reservoir 30◦N–90◦N between 0 and 10 km altitude.
Air samples collected in the surface atmospheric layer by the NOAA/CMDL Cooperative Air Sampling Network and by other programs (Table 1 and Fig. 1) were analyzed for lo-cal CO concentrations. The CMDL analysis of the air sam-ples were made by gas chromatography/HgO reduction de-tection using instruments from Trace Analytical, Inc. They were referenced to the so-called CMDL Reference Scale, which was based on two sets of primary standards produced at CMDL during the late 1980s and early 1990s (Novelli et al., 2003). At the two Japanese stations, CO mixing ratios were measured continuously using non-dispersive gas corre-lation IR instruments (Tanimoto et al., 2000, WMO, 2004) and calibrated using standards of the Chemical Evaluation and Research Institute, Japan, or Nippon Sanso company. In both cases the calibration was cross-checked against the Na-tional Center of Atmospheric Research standard (Tanimoto et al., 2000). The uncertainty of measurements is estimated as ±(1–3) ppb (Novelli et al., 2003) and ±7% (Tanimoto et al., 2000).
The satellite-borne MOPITT instrument is a thermal IR nadir-viewing gas correlation radiometer described in detail by Drummond (1992) and Deeter et al. (2003). MOPITT uses a cross-track scan, which allows for almost complete coverage of the Earth’s surface in about 3 days, with individ-ual pixels of 22 km×22 km horizontal resolution. Accuracy of the measured CO total column amount is ±10% but the sensitivity of the instrument significantly drops in the bound-ary layer (Deeter et al., 2004). The measured total column, therefore, depends on an a priori profile. In polluted bound-ary layer conditions the standard background a priori profile used instead of a more realistic one leads to an underestima-tion of the total column (cf., Edwards et al., 2004).
3 Results and discussion
Monthly mean CO total column (TC) amounts above 7 ground-based sites are plotted in Fig. 2. Ny-Alesund (Spits-bergen), Kiruna (Sweden), Harestua (Norway) and Zvenig-orod (Russia) are low altitude stations and the measured to-tal column amounts represent concentrations integrated over the entire atmosphere, thus including the boundary layer (BL), the free troposphere (FT), and the stratosphere. Total columns measured at the Alpine mountain sites Zugspitze,
Fig. 3. Examples of monthly mean mixing ratios (in parts per billion in mole fraction) at the surface layer sampling sites.
Jungfraujoch, and at the high altitude site Iza˜na (Canary Isles) are CO amounts integrated between the altitude of the station and the top of the atmosphere (note a change in the vertical scale).
It is known that 90% of the CO column amount resides be-low 12 km (Zhao et al., 2002). We assume here that the fire-induced variations of CO column amounts with durations of a few months occur mainly in the troposphere: the time con-stant for the vertical exchange between the troposphere and stratosphere is more than one year (Brasseur et al., 1999).
Monthly mean values in Fig. 2 (triangles) may be com-pared to values averaged over the 24-month-long reference period between March 2000 and February 2002 (solid blue lines). The particular choice of the beginning of the reference period is determined by the start of the MOPITT measure-ments in March, 2000. 24 following months were character-ized by low CO levels, comparing to previous and following time. A common reference seasonal cycle for three stations (Harestua, Kiruna, and Ny-Alesund) was calculated using the data for all three locations. This was done because of some gaps in the measurements at Harestua and Ny-Alesund dur-ing the reference period. These raw data indicate higher than normal CO total columns during summer-autumn periods of 2002 and 2003 at all sites. A similar effect (even more clearly due to averaging over the entire semi-hemisphere) is found in the MOPITT data also presented in Fig. 2.
Record high CO column amounts were measured at Zvenigorod in summer-autumn 2002 with a maximum in September. According to the International Forest Fire News (IFFN, 2003), there was smoke pollution from peat and forest fires in the region around Moscow between July and Septem-ber, 2002. This caused a dramatic reduction in visibility, to
less than 100 m in the city, and also had detrimental im-pacts on the health of the Muscovite population. The fires reached a peak on 6 September. The observed CO spikes (up to 7.3 E18 molecules/cm2 on 10 September 2002) re-flected intrusions of this polluted air (there were no visi-ble fires around the station itself). The horizontal extent of the highly polluted area remains uncertain. In this pa-per the days with these spikes were omitted. There were nine days in July–September, 2002 with CO columns that exceeded the summer time 2002 lowest daily value (2.02 E18 molecules/cm2)by more than 4 standard deviations, i.e., above 2.9 E18 molecules/cm2. Standard deviation of daily mean values, 0.22 E18 molecules/cm2, was calculated for the reference period of 2000–2001. Specifically, we omit-ted 1 out of 12 measurement days in July, 1 out of 6 days in August, and 7 out of 10 days in September.
Increased CO mixing ratios were found in the boundary layer over many remote sites of HNH in 2002 and 2003 as well. Figure 3 demonstrates examples for the Arctic, two At-lantic sites and an East Asian location. However, the increase of CO mixing ratio in Ryori, Japan was less pronounced than for other sites.
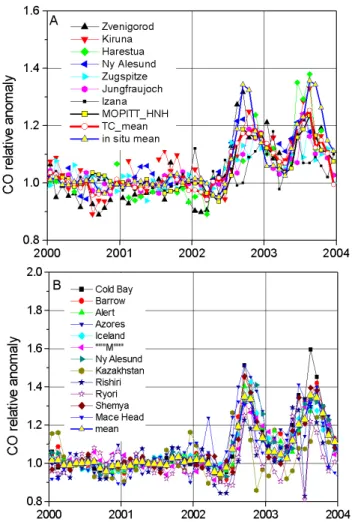
The further analysis will be carried on for anomalies to exclude seasonal variations of CO and to highlight the differ-ences between the 2002–2003 and 2000–2001 periods. The relative anomalies in CO abundance (monthly means divided by the values measured during the reference period) are plot-ted in Fig. 4 (the top panel is for total column contents, the bottom panel is for mixing ratios in the BL). The anoma-lies in CO total columns for both data sets have two max-ima, in September–October, 2002, and in August, 2003. The CO anomalies at the southernmost station Iza˜na (28◦N) are
Fig. 4. Anomalies of CO total column amounts (A) and surface mixing ratios (B). The measured monthly means were divided by the averages over the period between March 2000 and February 2002. MOPITT data are averaged over the HNH, mean BL is the average over the data of 12 low-level stations. Extreme daily values exceeding 2.9 E18 molecules cm−2in Zvenigorod in July– September, 2002, were omitted (see text).
lower than those at other sites. The lower CO anomalies sup-port the assumption that the northern mid-latitude wildfires play a decisive role in the anomaly in hemispheric CO bur-dens (cf., a conclusion of Yurganov et al. (2004) for 1998).
The anomalies averaged over in situ BL stations in Fig. 4b (maximum 35% in 2002 and 36% in 2003) were higher than corresponding TC anomalies in Fig. 4a (19% and 25%, respectively). A similar effect was observed in August, 1998: 71% for the BL and 48% for the total column rela-tive to 2000–2001 (Yurganov et al., 2004). The larger sur-face anomalies are expected if the source of additional CO is on the surface and the vertical mixing is not instantaneous. Moreover, a photochemical removal of anomalous CO oc-curs during its uplifting.
Fig. 5. Monthly sums of hot spot numbers for selected geographical areas (the locations of the areas are shown in Fig. 1). The numbers of hot spots averaged over the period between March, 2000, and February, 2002 used as a reference are designated by a dashed line.
The total column anomaly measured by MOPITT and inte-grated over the HNH, has a similar temporal shape (Fig. 4a). Edwards et al. (2004) analyzed the MOPITT data in conjunc-tion with simultaneously measured aerosol optical depths (AOD) from the Moderate-resolution Imaging Spectrora-diometer (MODIS) and fire counts, determined by special algorithm based on several channels of MODIS. In Septem-ber 2002, enhanced CO, AOD, and fire counts were observed concurrently over the European part of Russia. In 2003, for-est fires detected by MODIS started burning in early spring and were most intense in Siberia near the Baikal Lake in May. Later on the fires moved northwards through Siberia during the summer.
A convenient tool for fire detection is the number of hot spots on the Earth’s surface, detected at night time by the Along Track Scanning Radiometer (ATSR) or re-cently launched Advanced Along Track Scanning Radiome-ter (AATSR) (the “Algorithm 1” was described by Arino and Plummer, 2001). The total number of hot spots was counted separately for three geographical areas (Fig. 5) with bound-aries shown in Fig. 1. Although Siberia experienced a larger variation of hot spots, the relative anomalies of CO total col-umn measured by MOPITT and averaged over the same areas do not show significant differences (Fig. 6). It seems that the atmospheric transport effectively mixes this anomalous CO in the semi-hemisphere horizontally.
The anomalies of the CO burden (in Tg) in the reservoir 30◦N–90◦N, 0–10 km were calculated using three data sets (Fig. 7, top panel and left scale). Firstly, the anomalies in CO total column amounts at four low altitude stations, Harestua, Kiruna, Zvenigorod, and Ny Alesund were averaged and multiplied by the surface area of the reservoir (red open cir-cles in Fig. 7). Secondly (blue rectangles in Fig. 7), the aver-age anomalies in CO mixing ratios in the BL were multiplied by the number of air molecules in the lowest 1.5 km layer
Fig. 6. CO total columns, measured by MOPITT, related to those during the reference period (grey rectangle), and averaged over se-lected areas.
(0.355 E25 molecules cm2, according to the 1976 US Stan-dard Atmosphere) and by the surface area of the reservoir. These CO burden anomalies were added to the FT anomalies derived from the measurements at the Alpine Jungfraujoch and Zugspitze stations. The data from the Iza˜na mountain station were not considered here, because the station is lo-cated outside the chosen reservoir. And thirdly, the CO bur-den anomalies for the same reservoir were calculated from the global MOPITT data (full green triangles). All three data sets have similar patterns and are very close in their abso-lute values. A good general agreement of the data, obtained by different instruments, in different locations is notewor-thy. This can be explained by a significant averaging of the data and also by a good horizontal mixing. The only period of disagreement is January–April, 2003, when the total col-umn data resulted in approximately 10 Tg higher values of the CO burden than other data sets. Local effects (mostly at the Zvenigorod station) and an insufficient coverage of the Globe by the total column measurements (only European sector) may be a cause of this disagreement.
A box model (Yurganov et al., 2004) was applied to es-timate the monthly mean anomalies in the CO source in the HNH taking into account transport to the Low North-ern Hemisphere (LNH, 0◦N–30◦N, 0–10 km of altitude) and chemical removal. PH N H0 =dMH N H0 /dt + L0t rans+L0chem (1) L0t rans =(MH N H0 −MLN H0 )/T AUt rans (2) L0chem=MH N H0 /T AUchem (3) T AUchem=1/k[OH] (4) k =1.5∗E −13(1 + 0.6∗p)cm3mol−1s−1 (DeMore et al., 1997) (5)
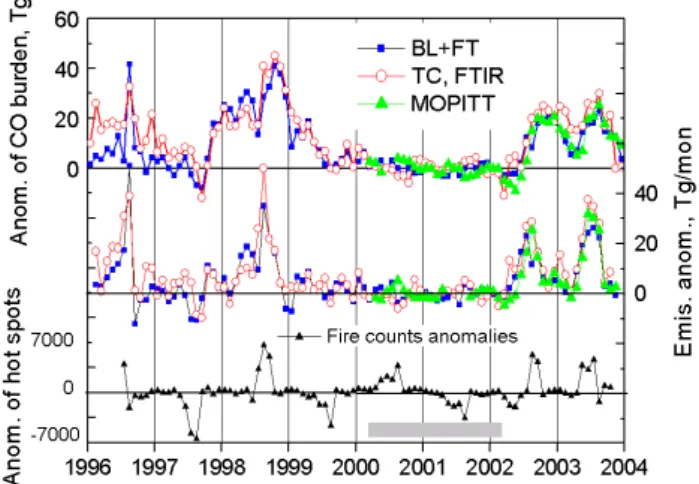
Fig. 7. Top panel and left axis. Deviations of CO burden in the HNH from “normal” values averaged over the period indicated by the grey rectangle. “T C, F T I R” curve represents the aver-age anomaly measured at four low altitude total column stations. “BL+F T ” curve is derived using the BL network (twelve stations) for lower 1.5 km and three mountain (free tropospheric) stations (Table 1); the data for Iza˜na (28◦N) site were omitted because the station is located outside the chosen reservoir. “MOP I T T ” curve is the anomaly of CO total column amounts measured by MOPITT and integrated over the HNH. Middle panel and right axis. Anomalies of CO emission rates in the HNH derived from three data sets for CO burden (top panel), using the box model (see text). Bottom panel and left axis. Anomalies of monthly ATSR fire-counts integrated over HNH.
where PH N His the CO emission rate (in Tg/month), MH N H, and MLN H are CO tropospheric burdens in the HNH and LNH reservoirs (in Tg); dMH N H/dt is the change in the tro-pospheric CO burden during the month, Lt ransand Lchemare loss terms due to the transport between the semi-hemispheres and OH-consumption, respectively; p is air pressure in atm; the prime (0) designates the anomaly, i.e., the deviation from the average over the reference period between March 2000 and February 2002.
The interannual variations of the sinks (in other words,
T AUchem0 and T AUt rans0 ) were neglected. T AUt rans was calculated using the GEOS-CHEM global 3-D CTM (Bey et al., 2001) with assimilated 1998 meteorology (Yurganov et al., 2004). T AUchemwas calculated using OH fields as a function of season, latitude, and altitude (Spivakovsky et al., 2000).
Burden anomalies for LNH (MLN H0 ) in 1996–1999 were calculated from the surface measurements by Novelli et al. (2003), in 2002–2003 they were assumed from the MO-PITT measurements. They were taken as the average of the two data sets mentioned above in 2000 and 2001.
Estimates of the CO emission anomalies in the HNH, rived from the model (Eqs. 1–5) using the three data sets de-scribed before are plotted on the middle panel of Fig. 7 (the reference period is indicated by the shaded area). Results
Table 2. Annual CO emission anomalies in Tg CO/year for the HNH retrieved from the low-altitude FTIR (P0(F T I R)); satellite measure-ments (P0(MOP I T T )), and in situ BL, combined with mountain sites (P0(BL+F T )) using a box model. The averages of two (1996–1999) or three (2000–2003) estimates are also given. The accuracy is estimated from standard deviation for eight runs of the box model for per-turbed input parameters described by Yurganov et al. (2004). For Kasischke et al. (2005) both emissions and anomalies in reference to 2000–2001 are presented.
Year P0, F T I R P0, MOP I T T P0, BL+F T Average anomaly Accuracy, Tg/yr Kasischke et al. (2005) High severity scenario Emission Anomaly 1996 158.7 88.5 123.6 40 41.6 −30.2 1997 26.8 0.9 13.9 6 18 −53.8 1998 151.4 141.3 146.3 20 163.3 91.5 1999 32.3 23.8 28.0 10 49.1 −22.7 2000 −1.8 1.8 5.0 1.7 4 49.9 −21.9 2001 5.1 −0.9 −1.4 0.9 7 93.7 21.9 2002 120.6 73.5 90.7 94.9 30 146.5 74.7 2003 160.6 118.0 111.9 130.2 30 139 67.2
presented in Figs. 2, 4a, and 7 are given also in a tabu-lar form in the Electronic Supplement. All three data sets clearly reveal abnormally high CO emission rates in 2002 and 2003. The yearly emission anomalies are presented in Table 2. Since 1996 there have been four years with high CO emission of similar magnitude (1996, 1998, 2002, and 2003) and four years with low emission (1997, 1999, 2000, and 2001).
Kasischke et al. (2005) obtained bottom-up estimates of CO emissions from boreal fires. Attempts were undertaken to quantify the depth of burning layer more accurately than previously. To take into account types of fires different burn severity scenarios were assumed. CO emissions for the high severity case (the estimates for two other scenarios were lower), are presented in Table 2 together with their anomalies referenced to 2000–2001. Our top-down estimates usually are higher then the bottom-up one. The difference between the studies is less for 2002 (the inversion of the MOPITT data agrees with the bottom-up value), but amounts to 100% in 2003. Yurganov et al. (2004) estimated that up to 11% of the additional CO burden measured in the atmosphere may be a result of a photochemical conversion from the pyro-genic non-methane hydrocarbons. This secondary CO source was not considered by Kasischke et al. Some contribution in resolving the discrepancy may also be obtained from tak-ing into account a depletion of [OH] caused by higher [CO]. Daniel and Solomon (1998) estimated that a 1% increase of [CO] led to a 0.34% decrease of [OH]. Yurganov et al. (2004) estimated that halving [OH] leads to 22% lower values of P0 in August, 1998. Therefore, the observed 30% increase of [CO] in summer times of 2002 and 2003 would result in a 10% drop of [OH]. This consequently leads to less that 10% lower values of P0 retrieved using our model and assump-tions for 2002 and 2003. Both effects diminish the differ-ence, but do not resolve the disagreement completely.
The bottom panel of Fig. 7 illustrates the interannual vari-ations of total numbers of hot spots detected by the ATSR after July 1996. The monthly anomalies of hot spots were calculated similarly to CO anomalies. The years 2002 and 2003 were characterized by positive anomalies of hot spots with maxima in August, 2002 and May–July, 2003. Posi-tive anomalies of hot spots were observed also in 1996 and 1998. During all of these years higher numbers of fire counts were found mostly in Siberia (see Fig. 5). Note that the high numbers of counts observed in 2000 was distributed almost equally over the three geographical areas (Fig. 5), and the CO level was normal during that year. This apparently im-plies that the Siberian forest fires influence the hemispheric CO levels disproportionately more than the wild fires in other continental areas.
Plots of the correlation between CO emission anomalies and the fire counts anomalies are displayed in Fig. 8. The slopes of the plots indicate that on a monthly basis 144 fire counts detected correspond to 1 Tg CO emitted. The HNH CO emission anomalies correlate better to the fire counts in Siberia (R2=0.51), than to the fire counts in the entire semi-hemisphere (R2=0.36). This is in agreement with Kasischke et al. (2005), who pointed out that the average emission per unit area for fires in the boreal region were higher in East-ern Russia than in North America, mainly because of higher aboveground biomass levels and deeper organic soil layers.
The average anomalies derived from all three data sets were converted into absolute emission rates assuming a “nor-mal” emission seasonal cycle. Biomass burning emission rates in 2000 (50.7 Tg CO/year) calculated for the MOZART-2 CTM (M. Schultz and C. Granier, personal communication, 2003; Schultz, 2002; Olivier et al., 1996) were used to define a “normal” seasonal cycle (Fig. 9). In 1996 and 1998 max-imum emissions were observed in August. In 2002 emis-sions had a maximum in July–August. In 2003 the emisemis-sions
Fig. 8. Correlation plots. (A) correlation between anomalies of hot spot numbers counted for the entire HNH and the corresponding semi-hemispheric anomalies of CO emission. (B) correlation between anomalies of hot spots numbers in Siberia (area shown in Fig. 1) and the semi-hemispheric anomalies of CO emission.
started to grow in May–June and reached a peak in July, in accordance with the fire pattern in Siberia (Fig. 5); these three months were characterized by very high numbers of fire counts. However, the August emission was still higher than normal in contrast to a low number of hot spots. There may be two explanations for this effect. Firstly, as previously mentioned, up to 11% of the additional CO in the HNH may be a result of the photochemical conversion from hydrocar-bons. A maximum input of this secondary CO source may be expected to occur with some delay after the emission of hydrocarbons, depending on their chemical life-times. Sec-ondly, ATSR can easily detect the flaming fires but the smol-dering fires may be under its detection limit.
4 Conclusions
Spectroscopic measurements of carbon monoxide total col-umn amounts from ground based stations in the Arctic and Europe reveal an increased CO abundance in summer and au-tumn of 2002 and 2003 in comparison with the previous two years. Similar increases were observed in 1996 and 1998 (Yurganov et al., 2004). Increased CO concentrations near the surface were also observed by the CMDL network. More-over, space-based MOPITT measurements with a full HNH coverage reveal a similar pattern in 2002 and 2003. An in-version of emission source anomalies from monthly burden anomalies (assuming a stable sink) has been done using a simple box model. The annual emission anomalies calcu-lated in 2002 and 2003 are in the range 70–160 Tg CO/year which are similar in magnitude to those in 1996 and 1998. The estimate for 2002 is close to the most recent bottom-up calculations by Kasischke et al. (2005), but our top-down es-timate for 2003 is a factor of two higher than that by Ka-sischke et al. (1995). The anomalies in the CO emission rates correlate with anomalies of fire counts, detected by a satellite-based radiometer. It is most likely that strong
Fig. 9. Seasonal variations of CO emission from biomass burning in the HNH calculated from our top-down estimate of the emission anomaly plus the normal seasonal cycle (MOZART-2 inventory for 2000). Error bars (shown for 2003, but valid also for other years) correspond to 30% accuracy (Yurganov et al., 2004).
wildfires are responsible for the interannual variations of the hemispheric CO burden.
Acknowledgements. The authors thank colleagues and
collabora-tors who participated actively in the production and analysis of the data used in this work. Thanks are further extended to H. Akimoto, T. Blumenstock, E. Grechko, and R. Zander for helpful discussions, to M. Schultz for the MOZART inventory, to O. Wild and D. Lukas for English editing and useful discussions. The financial support was provided by the Bundesministerium f¨ur Bildung und Forschung via the DLR by contracts 50EE0008 & 50EE0203, by German BMBF, by EU within the UFTIR project (EVK2-2002-00159) and within SOGE, by the Russian RFBR grant number 02-05-64148, by
Belgian (OSTC) grants, and by the Swedish National Space Board. Fire counts are taken from ATSR World Fire Atlas, European Space Agency, ESA/ESRIN, via Galileo Galilei, CP 64, 00044 Frascati, Italy (http://dup.esrin.esa.int/ionia/wfa/index.asp).
Edited by: D. Lowe
References
Andreae, M. O. and Merlet, P.: Emissions of trace gases and aerosols from biomass burning, Glob. Biogeochem. Cycles, 15, 955–966, 2001.
Arino, O. and Plummer, S. (Eds): Along Track Scanning Radiome-ter World Fire Atlas: Validation of the 1997–98 Active Fire Prod-uct, ESA-ESRIN, Italy, 2001.
Arellano Jr., A. F., Kasibhatla, P. S., Giglio, L., van der Werf, G. R., and Randerson, J. T.: Top-down estimates of global CO sources using MOPITT measurements, Geophys. Res. Lett., 31, L01104, doi:10.1029/2003GL018609, 2004.
Bey, I., Jacob, D. J., Yantosca, R. M., Logan, J. A., Field, B. D., Fiore, A. M., Li, Q., Liu, H., Mickley, L. J., and Schultz, M.: Global modeling of tropospheric chemistry with assimilated me-teorology: Model description and evaluation, J. Geophys. Res., 106, 23 073–23 095, 2001.
Brasseur, G., Orlando, J., Tyndall, G. (Eds): Atmospheric Chem-istry and Global Change, Oxford University Press, New York, 1999.
Daniel, J. S. and Solomon, S.: On the climate forcing of carbon monoxide, J. Geophys. Res., 103(D11), 13 249-13 260, 1998. Deeter, M. N., Emmons, L. K., Francis, G. L., et al.:
Opera-tional carbon monoxide retrieval algorithm and selected results for the MOPITT instrument, J. Geophys. Res., 108(D14), 4399, doi:10.1029/2002JD003186, 2003.
Deeter, M. N., Emmons, L. K., Edwards, D. P., Gille, J. C., and Drummond, J. R.: Vertical resolution and information content of CO profiles retrieved by MOPITT, Geophys. Res. Lett., 31, L15112, doi:10.1029/2004GL020235, 2004.
DeMore, W. B., Sander, S. P., Golden, D. M., Hampson, R. F., Kurylo, M. J., Howard, C. J., Ravishankara, A. R., Kolb, C. E., and Molina, M. J.: Chemical kinetics and photochemical data for use in stratospheric modeling, JPL Publ., 97-4, 1997.
Drummond, J. R.: Measurements of Pollution in the Troposphere (MOPITT), in: The Use of EOS for Studies of Atmospheric Physics, edited by: Gille, J. C. and Visconti, G., pp. 77–101, North-Holland, NY, 1992.
Edwards, D. P , Emmons, L. K., Hauglustaine, D. A., Chu, A., Gille, J. C., Kaufman, Y. J., Petron, G., Yurganov, L. N., Giglio, L., Deeter, M. N., Yudin, V., Ziskin, D. C., Warner, J., Lamarque, J. -F., Francis, G. L., Ho, S. P., Mao, D., Chen, J., Grechko, E. I., and Drummond, J. R.: Observations of car-bon monoxide and aerosols from the Terra satellite: North-ern Hemisphere variability , J. Geophys. Res., 109, D24202, doi:10.1029/2004JD004727, 2004.
Ehhalt , D., Prather, M., Dentener, F., Derwent, R., Dlugokencky, E., Holland, E., Isaksen, I., Katima, J., Kirchhoff, V., Matson, P., Midgley, P., and Wang, M.: Chapter 4: Atmospheric Chemistry and Greenhouse Gases, in: Climate Change 2001: The Scientific Basis. Contribution of Working Group I to the Third Assessment Report of the Intergovernmental Panel on Climate Change edited
by: Houghton, J. T., Ding, Y., Griggs, D. J., Noguer, M., van der Linden, P. J., Dai, X., Maskell, K., and Johnson, C. A., Cam-bridge University Press, CamCam-bridge, United Kingdom and New York, NY, USA, 881 pp. 2001.
Flannigan, M. D., Bergeron, Y., Engelmark, O., and Wotton, B. M.: Future wildfire in circumboreal forests in relation to global warming, J. Veget. Sci., 9, 469–476, 1998.
Galanter, M., Levy, H., and Carmichael, G. R.: Impacts of biomass burning on tropospheric CO, NOx, and O3, J. Geophys. Res.,
105(D5), 6633–6653, 2000.
Hase, F., Hannigan, J. W., Coffey, M. T., Goldman, A., H¨opfner, M., Jones, N. B., Rinsland, C. P., and Wood, S. W.: Intercompar-ison of retrieval codes used for the analysis of high-resolution, ground-based FTIR measurements, J. Quant. Spectrosc. Radiat. Transfer, 87(1), 25–52, 2004.
Holloway, T., Levy, H., and Kasibhatla, P.: Global distribution of carbon monoxide, J. Geophys. Res., 105(D10), 12 123–12 147, 2000.
IFFN, Russian Federation 2002 Fire Special, International Forest Fire News, 28, Parts I–IV, 2–32, 2003.
Jaffe, D., Bertschi, I., Jaegl´e, L., Novelli, P., Reid, J. S., Tanimoto, H., Vingarzan, R., and Westphal, D. L.: Long-range transport of Siberian biomass burning emissions and impact on surface ozone in western North America, Geophys. Res. Lett., 31, L16106, doi:10.1029/2004GL020093, 2004.
Kasischke, E. S., Hyer, E. J., Novelli, P. C., Bruhwiler, L. P., French, N. H. F., Sukhinin, A. I., Hewson, J. H., and Stocks, B. J.: In-fluences of boreal fire emissions on Northern Hemisphere atmo-spheric carbon and carbon monoxide, Global Biogeochem. Cy-cles, 19, GB1012, doi:10.1029/2004GB002300, 2005.
Novelli, P. C., Masarie, K. A., Lang, P. M., Hall, B. D., Myers, R. C., and Elkins, J. W.: Reanalysis of tropospheric CO trends: Effects of the 1997–1998 wildfires, J. Geophys. Res., 108(D15), 4464, doi: 10.1029/2002JD003031, 2003.
Olivier, J., Bouwman, A., van der Maas, C., Berdowski, J., Veldt, C., Bloos, J., Visschedijk, A., Zandveld, P., and Haverlag, J.: Description of EDGAR Version 2.0: A set of global emission inventories of greenhouse gases and ozone-depleting substances for all anthropogenic and most natural sources on a per country basis and on 1×1 grid, Tech. Rep. 771060 002, RIVM, TNO-MEP, 1996.
Petron, G., Granier, C., Khattatov, B., Yudin, V., Lamar-que, J.-F., Emmons, L., Gille, J., and Edwards, D. P.: Monthly CO surface sources inventory based on the 2000– 2001 MOPITT satellite data, Geophys. Res. Lett., 31, L21107, doi:10.1029/2004GL020560, 2004.
Rinsland, C. P., Jones, N. B., Connor, B. J., et al.: Northern and Southern Hemisphere ground-based infrared spectroscopic mea-surements of tropospheric carbon monoxide and ethane, J. Geo-phys. Res., 103(D21), 28 197–28 217, 1998.
Schultz, M. G.: On the use of ATSR fire count data to estimate the seasonal and interannual variability of vegetation fire emissions, Atmos. Chem. Phys., 2, 387–395, 2002,
SRef-ID: 1680-7324/acp/2002-2-387.
Spivakovsky, C. M., Logan, J. A., Montzka, S. A., et al.: Three-dimensional climatological distribution of tropospheric OH: Up-date and evaluation, J. Geophys. Res., 105(D7), 8931–8980, 2000.
and Russia, Geophys. Res. Lett., 24, 4575–4578, 2001. Yurganov, L. N., Grechko, E. I., and Dzhola, A. V.: Long-term
mea-surements of carbon monoxide over Russia using a spectrometer of medium resolution, Recent Res. Devel. Geophysics, 4, 249– 265, ISBN 81-7736-076-0, 2002.


![Design, Synthesis, and Evaluation of 2,9-Bis[(substituted-aminomethyl)phenyl]-1,10-phenanthroline Derivatives as G-Quadruplex Ligands.](data:image/gif;base64,R0lGODlhAQABAIAAAP///wAAACH5BAEAAAAALAAAAAABAAEAAAICRAEAOw==)